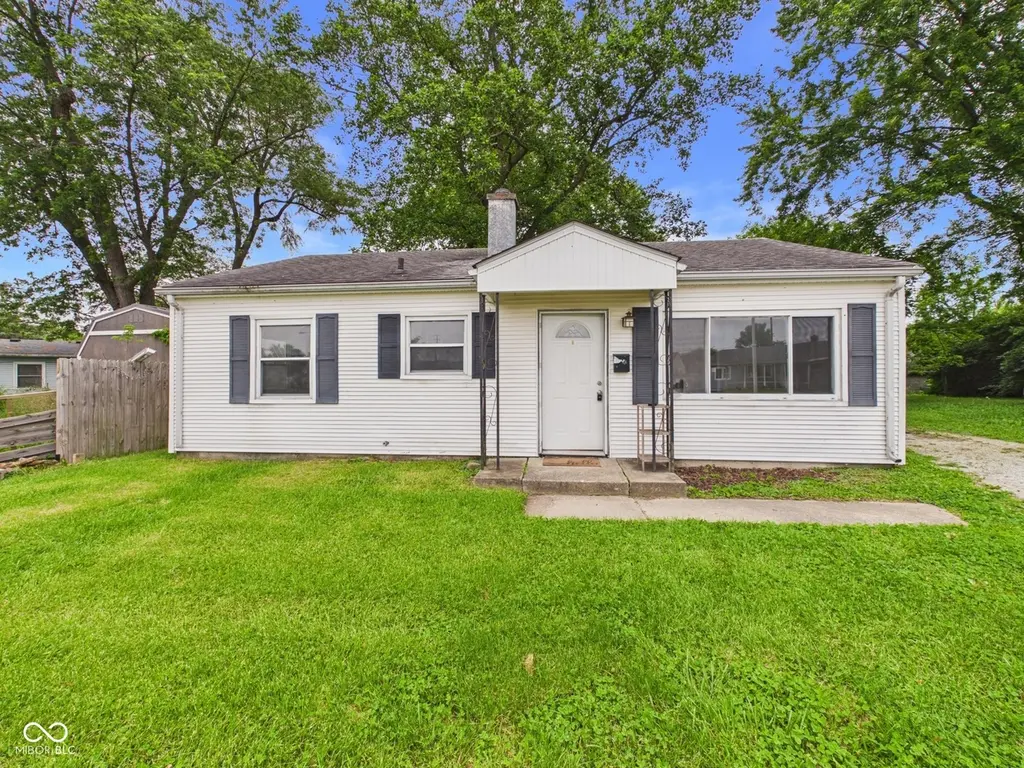
105 Mohawk Ct · Anderson, IN
Flood risk 1/10 · Minimal
- FEMA flood zone
- X (unshaded)
- Chance of flooding over 30 yrs
- 0.0%
- Est. flood insurance / yr
- $507 – $1,088
Fire risk 1/10 · Minimal
- Est. fire insurance / yr
- $717 – $1,331
Heat risk 3/10 · Minor
- Hot days now (above 100°F)
- 7 days/yr
- Hot days in 30 yrs
- 18 days/yr
Wind risk 2/10 · Minimal
- Chance of severe wind over 30 yrs
- —
Air-quality risk 3/10 · Minor
- Unhealthy air days now
- 2 days/yr
- Unhealthy air days in 30 yrs
- 3 days/yr
Risk factors via First Street. Map © Google.
Why this score? — see what drove the C+ grade
The composite is a weighted blend of 9 inputs, each scored 0–100. Each bar is that input's sub-score; the figure is the points it added to the 100-point composite (weight × sub-score).
- Cash flow +25.7/30.0
- ARV discount +10.2/15.0
- DSCR +8.6/10.0
- 1% rule +6.3/10.0
- Rent growth +3.0/5.0
- Livability +3.0/5.0
- Condition / age +2.5/5.0
- Schools +1.6/10.0
- Appreciation +0.0/10.0
$112,000
🖨 Deal sheet 📄 Offer letter ✓ Due diligence
Listing remarks MLS
HUD HOME SOLD IN AS IS CONDITION. FOR INFORMATION REGARDING HUD FORMS,EARNEST MONEY, REGISTERING AND BIDDING SEE THE WEB ADDRESS LISTED BELOW. NO SHOWING APPOINTMENT NECESSARY. ALL INFORMATION DEEMED RELIABLE BUT NOT GUARANTEED. CASE NUMBER 151-569336 INSURED STATUS: UI LBP
Key facts
- Large backyard
- Brand new carpet
- Cul-de-sac
Tags
Property features AI
Exterior
- Parking: Detached 1-car garage (approximately 320 sq ft)
- Utilities: Public water; Municipal sewer connected; Municipal solid waste service
- Home design: Single-family residence; One level
- Construction: Vinyl siding; Block foundation
- Exterior features: City lot (approximately 0.24 acres)
Interior
- Kitchen: Gas oven; Range hood; Refrigerator; Electric water heater
- Bedrooms: Three bedrooms on the main level (sizes include 9x12, 9x12, 8x12)
- Bathrooms: One full bathroom (main level)
- Heating & cooling: Forced air heating (natural gas); Central air conditioning
- Interior features: Eat-in kitchen; Covered patio or porch
- Laundry & utility: Washer/dryer connections (all)
Neighborhood map
What this means for you Summary
Snapshot
- This is a 3-bed/1.0-bath single-family listed at $112k.
Deal economics
- At list price, monthly cash flow is $269 ($3k/yr) — positive.
- The deal already cash-flows at list — no discount required.
- Meets the 1% rule at list price ($1k rent vs $112k).
- Cap rate 9.2% vs local median 6.5% in Anderson — top-decile yield for the area; either an underpriced asset or a hidden risk that comps aren't pricing in. Stress-test before assuming the spread holds.
Location & tenants
- Location reads 60/100 on livability (#521 in IN) — a middle-class / working-renter tenant base. Strengths: cost of living A+, housing A+; Watch: schools F, crime D-, amenities F.
- Anderson Community School Corporation (urban): math 15% / reading 23% proficiency, ranked #280 of 301 in IN (top 93%) — low school quality limits family demand, transient renter base, plan for 1-2y turnover; 70% free/reduced lunch — lower-income household profile, screen leases tightly.
- Market conditions: Rents rising (+1.8%/yr); 159 active listings in the ZIP; 16 comparable units currently listed for rent nearby; rentals lingering (median 44d on market — plan ~5-8 weeks vacancy on turnover, expect pricing pressure); 50% of comp listings sitting > 30 days — soft ceiling on asking rent; 184 units permitted in Madison County in 2024 (0 in 5+ unit buildings).
Forward outlook
- Local home prices are declining (-3.0%/yr); year-one equity from $774 of loan paydown is wiped out by about $3k of value loss. Plan a longer hold.
- Madison County population projected at -14% by 2050 — secular population decline; favor cash flow + early exit over multi-decade hold.
Negotiation context
- Only 2 days on market — expect competitive offers; lowballing is unlikely to land.
- 3 sale attempts since 22y ago with the ask held roughly flat each time — persistent listings suggest the price (not the market) is what's stuck; bring a comps-based counter.
- Current owner paid $28k; list at $112k implies a 298% gain — meaningful room to come down on a strong offer.
Risks & watch-outs
- Watch-outs: built in 1954 — expect roof / HVAC / electrical / plumbing capex.
Questions for the listing agent
- Built in 1954 — when were the roof, HVAC, electrical panel, plumbing, and water heater last replaced?
- Is there a deadline driving the sale (1031 exchange, divorce, estate, relocation)? That informs how much negotiation room exists.
- Schools are F-rated, which usually means shorter tenancies and higher turnover. Who's the typical renter profile here, and what's been the actual vacancy rate?
- Crime grade is D in this area — have there been break-ins, vandalism, or insurance claims at this property in the last 3 years? What carrier currently insures it and at what premium?
- What's the average days-on-market for RENTAL listings here right now (not sales)? A rising rental-DOM trend means longer vacancies and softer asking-rent achievability than the comps imply.
- What's the recent tenant-quality profile in this submarket — average credit score on applications, eviction rate, late-payment / NSF rate, and stable-employment percentage? A property-management company in the area should have these aggregated.
- How much new for-sale + rental construction is in the pipeline within 1–3 miles? Heavy new supply typically softens prices + rents 12–24 months out; constrained supply supports both.
Investment metrics
- 1% rule
- 1.13% ✓
- Cap rate
- 9.18%
- Cash-on-cash
- 10.30%
- DSCR
- 1.46
- GRM
- 7.4
CMA / ARV
- ARV (on-the-fly)
- $119,280
- Comps found
- 12
Show comp detail 12 sales within ~0.75 mi
| Address | Dist | Beds/Ba | Sqft | Sold | Price | $/sf | Match |
|---|---|---|---|---|---|---|---|
| 2608 Shawnee Dr | 0.06mi | 3/1.0 | 850 (+1%) | 4mo | $110,000 | $129 | 92 |
| 305 Mohawk St | 0.11mi | 2/1.0 (-1) | 840 (0%) | 4mo | $119,500 | $142 | 86 |
| 2419 Crystal St | 0.10mi | 2/1.0 (-1) | 780 (-7%) | 1mo | $51,500 | $66 | 78 |
| 216 Seminole Dr | 0.23mi | 2/1.0 (-1) | 800 (-5%) | 2mo | $141,000 | $176 | 75 |
| 308 Mohawk St | 0.12mi | 2/1.0 (-1) | 792 (-6%) | 12mo | $110,000 | $139 | 70 |
| 2722 Dakota Dr | 0.33mi | 2/1.0 (-1) | 792 (-6%) | 1mo | $137,000 | $173 | 70 |
| 2124 Poplar St | 0.39mi | 2/1.0 (-1) | 804 (-4%) | 2mo | $64,500 | $80 | 68 |
| 2913 Dakota Dr | 0.46mi | 3/1.0 | 916 (+9%) | 0mo | $140,000 | $153 | 63 |
| 2125 State St | 0.43mi | 2/1.0 (-1) | 780 (-7%) | 5mo | $130,000 | $167 | 59 |
| 2829 Dakota Dr | 0.42mi | 2/1.0 (-1) | 792 (-6%) | 11mo | $118,000 | $149 | 57 |
| 2328 Lafayette St | 0.31mi | 2/1.0 (-1) | 720 (-14%) | 1mo | $79,200 | $110 | 56 |
| 2108 Silver St | 0.45mi | 2/1.0 (-1) | 918 (+9%) | 8mo | $98,400 | $107 | 52 |
Match score weights: distance 35% · size 25% · config 20% · recency 20%. Top-matched comps best support the ARV.
Projected returns pro-forma
-3.0% appreciation · 1.82% rent growth · sell at horizon
- IRR
- -2.1%
- Equity multiple
- 0.92×
- Total profit
- $-2,503
- Equity at exit
- $16,700
- IRR
- 6.3%
- Equity multiple
- 1.44×
- Total profit
- $13,908
- Equity at exit
- $9,684
Cash invested: $31,360 (down + closing). Projections, not guarantees.
Landlord ↔ Tenant lean methodology
- Overall (STATE)
- 90 Strongly Landlord-Friendly
- State Indiana
- 90 Strongly Landlord-Friendly · R+11
- County
- — inherits STATE
- City
- — inherits STATE
ZIP-level market 46012
- Home prices YoY
- -18.6%
- Rents YoY
- 1.8%
- Active inventory
- 159
- Price-to-rent
- 7.4×
Monthly cashflow live
- Estimated rent
- $1,265 high interval (Pro) →
- Mortgage (P&I)
- −$587
- Tax from tax record
- −$96 /mo · $1,151/yr
- Insurance
- −$47
- HOA
- −$0
- Vacancy / Maint / Mgmt
- −$266
- Net cashflow
- $269
Break-even live
UW: 25.0% down · 7.5% · 30yr · 1.5% tax · 5.0% vac · 8.0% maint · 8.0% mgmt
Financing live
Cash to close
- Down payment
- $28,000
- Closing costs
- $3,360
- Reserves months
- —
- Total cash needed
- —
Loan-product check · same deal, 3 products live
Conventional
25% down · 7.5% · 30yr
- Down + closing
- —
- Monthly P&I
- —
- Monthly cashflow
- —
- DSCR
- —
- Eligible?
- —
Personal DTI + credit; lowest rate.
DSCR
20% down · 8.5% · 30yr
- Down + closing
- —
- Monthly P&I
- —
- Monthly cashflow
- —
- DSCR
- —
- Eligible?
- —
No personal income docs; deal must DSCR.
Hard money
10% down · 12.0% · 12mo
- Down + closing
- —
- Monthly P&I
- —
- Monthly cashflow
- —
- DSCR
- —
- Eligible?
- —
Short-term bridge; refi at stabilization.
Rent comps 16 comps
| Address | Beds | Baths | Sqft | Rent | $/sqft | DOM | Units | Dist |
|---|---|---|---|---|---|---|---|---|
| 235 W School St Unit 235 Anderson, IN | 3.0 | 1.0 | 925 | $1,200 | $1.30 | 43d | 1 | 0.34mi |
| 1321 Lafayette Ct Anderson, IN | 3.0 | 1.5 | 962 | $1,350 | $1.40 | 10d | 1 | 1.03mi |
| 1705 Lake Shore Dr Unit 1705A Anderson, IN | 2.0 | 2.0 | 912 | $1,277 | $1.40 | 43d | 1 | 1.04mi |
| 1705 Lake Shore Dr Unit 1705G Anderson, IN | 2.0 | 2.0 | 912 | $1,229 | $1.35 | 17d | 1 | 1.04mi |
| 1807 Lake Shore Dr Unit 1807K Anderson, IN | 2.0 | 2.0 | 912 | $1,344 | $1.47 | 43d | 1 | 1.10mi |
| 1808 N Cross Lakes Cir Unit 1808HN Anderson, IN | 2.0 | 2.0 | 944 | $1,177 | $1.25 | 3d | 1 | 1.11mi |
| 1716 N Cross Lakes Cir Unit 1716KN Anderson, IN | 2.0 | 2.0 | 912 | $1,274 | $1.40 | 23d | 1 | 1.11mi |
| 1812 N Cross Lakes Cir Unit 1812AN Anderson, IN | 2.0 | 2.0 | 912 | $1,229 | $1.35 | 43d | 1 | 1.12mi |
| 1800 Cross Lakes Blvd Anderson, IN | 1.0–2.0 | 1.0–2.0 | 847 | $1,344 | $1.59 | 1d | 22 | 1.16mi |
| 1912 N Cross Lakes Cir Unit 1912HN Anderson, IN | 2.0 | 2.0 | 944 | $1,174 | $1.24 | 12d | 1 | 1.17mi |
| 1805 S Cross Lakes Cir Unit 1805LS Anderson, IN | 2.0 | 2.0 | 912 | $1,294 | $1.42 | 12d | 1 | 1.18mi |
| 1708 S Cross Lakes Cir Unit 1708ES Anderson, IN | 2.0 | 2.0 | 944 | $1,115 | $1.18 | 43d | 1 | 1.20mi |
| 1804 S Cross Lakes Cir Unit 1804DS Anderson, IN | 2.0 | 2.0 | 944 | $1,144 | $1.21 | 43d | 1 | 1.21mi |
| 1812 S Cross Lakes Cir Unit 1812ES Anderson, IN | 2.0 | 2.0 | 944 | $1,115 | $1.18 | 14d | 1 | 1.22mi |
| 1904 S Cross Lakes Cir Unit 1904KS Anderson, IN | 2.0 | 2.0 | 912 | $1,183 | $1.30 | 43d | 1 | 1.24mi |
| 1904 S Cross Lakes Cir Unit 1904LS Anderson, IN | 2.0 | 2.0 | 912 | $1,309 | $1.44 | 43d | 1 | 1.24mi |
Listing history 5 events
-
2026-05-27$112,000 Active
-
2018-12-20historical
-
2018-08-06$47,900 Active
-
2004-07-22soldstatus $28,173 277-char remark
Show marketing remark (277 chars)
HUD HOME SOLD IN AS IS CONDITION. FOR INFORMATION REGARDING HUD FORMS,EARNEST MONEY, REGISTERING AND BIDDING SEE THE WEB ADDRESS LISTED BELOW. NO SHOWING APPOINTMENT NECESSARY. ALL INFORMATION DEEMED RELIABLE BUT NOT GUARANTEED. CASE NUMBER 151-569336 INSURED STATUS: UI LBP
-
2004-05-14$31,000 277-char remark
Show marketing remark (277 chars)
HUD HOME SOLD IN AS IS CONDITION. FOR INFORMATION REGARDING HUD FORMS,EARNEST MONEY, REGISTERING AND BIDDING SEE THE WEB ADDRESS LISTED BELOW. NO SHOWING APPOINTMENT NECESSARY. ALL INFORMATION DEEMED RELIABLE BUT NOT GUARANTEED. CASE NUMBER 151-569336 INSURED STATUS: UI LBP
ⓘ Source: listings_history table (triggers on properties + properties_extension) + one-shot
backfill from property_details.listing_events for pre-trigger history.
Tax reassessment forecast IN · Partial reset (capped growth)
- Current annual tax
- $1,151 · $96/mo
- Projected year-2 tax
- $1,151 · $96/mo
- Expected delta
- $0/yr ($0/mo · 0.0%)
ⓘ Screening estimate from a state-policy table — verify with the county assessor before closing.
Climate risk First Street
- Flood 1/10 Low FEMA zone X (unshaded) · 0% chance over 30 yrs
- Wildfire 1/10 Low
- Heat 3/10 Moderate 7 d/yr ≥100°F today · 18 d/yr by 30 yrs out
- Wind 2/10 Low
- Air quality 3/10 Moderate 2 unhealthy d/yr today · 3 by 30 yrs out
Nearby sold comps map
Loading sold comps map…
Walkable amenities ~0.75 mi
Loading nearby amenities…
Taxation est. · year 1
- Rental income
- $15,175
- − Mortgage interest
- −$6,274
- − Property taxes
- −$1,151
- − Insurance
- −$560
- − Repairs & maintenance
- −$1,214
- − Management
- −$1,214
- − Depreciation
- −$3,258
- Taxable income
- $1,504
- Est. tax owed @ 24.0%
- −$361
- After-tax cash flow
- $2,868/yr
For passive investors: Depreciation is non-cash, so a rental often shows a tax loss while cash-flowing — sheltering income. Rental losses are passive: they offset passive income freely, and up to $25,000/yr can offset ordinary (W-2) income if you actively participate and your MAGI is under $100k (phasing out to $0 by $150k); unused losses carry forward. On sale, claimed depreciation is recaptured at up to 25%, and gains may owe capital-gains tax (a 1031 exchange can defer both). Figures are a year-1 estimate at your 24.0% rate — not tax advice; consult a CPA.
Schools (NCES district)
- District
- Anderson Community School Corporation
- NCES district ID
- 1800150
- Math proficiency
- 15% ▼ -14.00%
- Reading proficiency
- 23% ▼ -7.00%
- Median HH income
- $38,208
- Composite
- 15.93/100
- National rank
- #9250
- State rank
- #280 of 301 in IN
Livability — Anderson
- Score
- 60/100
- State rank
- #521
- US rank
- #18709
Category grades
Schools grade is shown separately in the Schools card above.
Census & demographics
- Census place
- Anderson, IN
- County
- Madison County · 69,445 people
- City population
- 57,762
- Metro
- Indianapolis-Carmel-Anderson, IN
- Population (ZIP)
- 20,855
- Household income
- $58,041
- Rent vs Own
- Severe rent burden
- 987.0
Population outlook (Madison County) Hauer SSP2
- Today (2025)
- 125,800 people
- By 2030
- 122,640 · -2.5%
- By 2040
- 115,420 · -8.3%
- By 2050
- 108,148 · -14.0%
- By 2075
- 91,838 · -27.0%
- By 2100
- 75,670 · -39.8%
Race, ethnicity, and origin ACS 2023
- Neighborhood character
- Predominantly White (85%)
- Race & ethnicity
- White 85% Hispanic / Latino 5% Two or more races 4% Black 4%
- Hispanic origin (detail)
- Mexican 4%
- Common ancestry
- Slovak 3% Serbian 2% Italian 1%
- Foreign-born
- 2% · Canada, Vietnam
- Languages at home
- 96% English-only · Spanish 3%
Political lean MEDSL · Madison
- 2024 margin
- Strong R (+26.9) · D 35.6% · R 62.5% · Other 1.9%
- 2008→2024 swing
- -33.5pp toward R · 2008: 6.5pp · 2024: -26.9pp
- All cycles
- 2024: R+26.9 2020: R+22.6 2016: R+25.7 2012: R+4.5 2008: D+6.5
Not yet ingested
- Civics
- —
Market trends
- HPI YoY
- ▼ -61.16%
- Current HPI
- 266.9819
- Rent YoY
- ▲ 1.82%
- Metro
- Indianapolis-Carmel-Anderson, IN
- State GDP YoY
- ▲ 2.90%
- F500 in state
- 18
Industry mix (Fortune 500 HQ in IN)
| Industry | F500 HQs | Revenue |
|---|---|---|
| Industrial Machinery | 2 | $37B |
|
||
| Healthcare | 1 | $177B |
|
||
| Pharmaceuticals | 1 | $45B |
|
||
| Metals / Steel | 1 | $18B |
|
||
| Agriculture | 1 | $17B |
|
||
| Packaging | 1 | $12B |
|
||
Price history
+261.3% since first listed5 events — show timeline
- 2026-05-27 Listed $112,000 MIBOR as Distributed by MLS Grid
- 2018-12-20 Listing Removed — MIBOR as Distributed by MLS Grid
- 2018-08-06 Listed $47,900 MIBOR as Distributed by MLS Grid
- 2004-07-22 Sold (MLS) $28,173 MIBOR as Distributed by MLS Grid
- 2004-05-14 Listed $31,000 MIBOR as Distributed by MLS Grid
Property tax history
+6.2%/yrLatest (2024): $1,151 · +7.7% YoY. Source: county tax records.
Cash-flow waterfall
monthlySold comps — $/sqft
last 12 mo · ≤1 miLoading sold comps…