 🏗️ New Construction
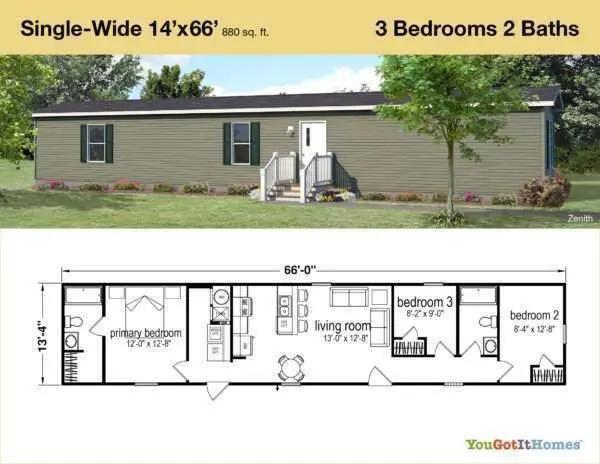
Zenith (Bradbury Pointe) Plan · Richmond, KY
Flood risk No data
- FEMA flood zone
- —
- Chance of flooding over 30 yrs
- —
- Est. flood insurance / yr
- —
Fire risk No data
- Est. fire insurance / yr
- —
Heat risk No data
- Hot days now (above threshold)
- —
- Hot days in 30 yrs
- —
Wind risk No data
- Chance of severe wind over 30 yrs
- —
Air-quality risk No data
- Unhealthy air days now
- —
- Unhealthy air days in 30 yrs
- —
Risk factors via First Street. Map © Google.
Why this score? — see what drove the C- grade
The composite is a weighted blend of 9 inputs, each scored 0–100. Each bar is that input's sub-score; the figure is the points it added to the 100-point composite (weight × sub-score).
- Cash flow +15.7/30.0
- 1% rule +10.0/10.0
- ARV discount +7.5/15.0
- DSCR +4.8/10.0
- Condition / age +4.0/5.0
- Livability +3.5/5.0
- Schools +3.3/10.0
- Rent growth +3.2/5.0
- Appreciation +0.0/10.0
$64,995
🖨 Deal sheet 📄 Offer letter ✓ Due diligence
Listing remarks MLS
Located less than one mile from Eastern Kentucky University, and just around the corner from University Shopping Center, Bradbury Pointe is an established community surrounded by mature trees that is close to shopping, employment and schools. Community Amenities Clubhouse and Playground
Key facts
- Close to schools
- Clubhouse
- Close to employment
Tags
Neighborhood map
What this means for you Summary
Snapshot
- This is a 3-bed/2.0-bath manufactured listed at $65k. Condition is rated good.
Deal economics
- At list price, monthly cash flow is $28 ($337/yr) — positive.
- The deal already cash-flows at list — no discount required.
- Meets the 1% rule at list price ($1k rent vs $65k).
- Recommended offer: $57k (12.0% below list) — sets the bar for market timing.
- Cap rate 6.8% vs local median 3.1% in Richmond — top-decile yield for the area; either an underpriced asset or a hidden risk that comps aren't pricing in. Stress-test before assuming the spread holds.
Location & tenants
- Location reads 69/100 on livability (#163 in KY) — a middle-class / working-renter tenant base. Strengths: cost of living A+, health & safety A+, housing A; Watch: schools D+, amenities F, commute F.
- Madison County (town): math 31% / reading 47% proficiency, ranked #35 of 165 in KY (top 21%) — families likely to look elsewhere, expect single-tenant / working-renter base with shorter leases.
- Market conditions: Rents rising (+2.8%/yr); 487 active listings in the ZIP; 15 comparable units currently listed for rent nearby; rentals at typical pace (median 24d on market — plan ~3-4 weeks tenant-placement turnaround); 47% of comp listings sitting > 30 days — soft ceiling on asking rent; 453 units permitted in Madison County in 2024 (64 in 5+ unit buildings).
Forward outlook
- Local home prices are declining (-3.0%/yr); year-one equity from $449 of loan paydown is wiped out by about $2k of value loss. Plan a longer hold.
- Madison County population projected at +28% by 2050 — long-run rental-demand tailwind backs the buy-and-hold thesis.
Negotiation context
- It's been on market 236 days — a 12% lower offer ($57k) is reasonable based on typical stale-listing flexibility.
Risks & watch-outs
- Watch-outs: HOA is 39% of rent.
Questions for the listing agent
- It's been on market 236 days. Have you received any prior offers? Is the seller open to a 12% concession, seller financing, or rate buy-down credit?
- What does the HOA fee cover, when was the last increase, and are there any pending special assessments or reserve-fund shortfalls?
- Why hasn't it sold? Are there any deal-killer items the seller is aware of (foundation, flood, title, zoning, code violations)?
- Is there a deadline driving the sale (1031 exchange, divorce, estate, relocation)? That informs how much negotiation room exists.
- Schools are D-rated, which usually means shorter tenancies and higher turnover. Who's the typical renter profile here, and what's been the actual vacancy rate?
- What's the average days-on-market for RENTAL listings here right now (not sales)? A rising rental-DOM trend means longer vacancies and softer asking-rent achievability than the comps imply.
- What's the recent tenant-quality profile in this submarket — average credit score on applications, eviction rate, late-payment / NSF rate, and stable-employment percentage? A property-management company in the area should have these aggregated.
- How much new for-sale + rental construction is in the pipeline within 1–3 miles? Heavy new supply typically softens prices + rents 12–24 months out; constrained supply supports both.
Investment metrics
- 1% rule
- 1.84% ✓
- Cap rate
- 6.81%
- Cash-on-cash
- 1.85%
- DSCR
- 1.08
- GRM
- 4.5
CMA / ARV
No comps found within radius.
Projected returns pro-forma
-3.0% appreciation · 2.82% rent growth · sell at horizon
- IRR
- -13.2%
- Equity multiple
- 0.52×
- Total profit
- $-8,656
- Equity at exit
- $9,691
- IRR
- -4.0%
- Equity multiple
- 0.73×
- Total profit
- $-4,881
- Equity at exit
- $5,620
Cash invested: $18,199 (down + closing). Projections, not guarantees.
Landlord ↔ Tenant lean methodology
- Overall (STATE)
- 83 Strongly Landlord-Friendly
- State Kentucky
- 83 Strongly Landlord-Friendly · R+16
- County
- — inherits STATE
- City
- — inherits STATE
ZIP-level market 40475
- Home prices YoY
- -22.7%
- Rents YoY
- 2.8%
- Active inventory
- 487
- Price-to-rent
- 4.5×
Monthly cashflow live
- Estimated rent
- $1,195 high interval (Pro) →
- Mortgage (P&I)
- −$341
- Tax est. 1.5%
- −$81 /mo · $975/yr
- Insurance
- −$27
- HOA
- −$467
- Vacancy / Maint / Mgmt
- −$251
- Net cashflow
- $28
Break-even live
UW: 25.0% down · 7.5% · 30yr · 1.5% tax · 5.0% vac · 8.0% maint · 8.0% mgmt
Financing live
Cash to close
- Down payment
- $16,249
- Closing costs
- $1,950
- Reserves months
- —
- Total cash needed
- —
Loan-product check · same deal, 3 products live
Conventional
25% down · 7.5% · 30yr
- Down + closing
- —
- Monthly P&I
- —
- Monthly cashflow
- —
- DSCR
- —
- Eligible?
- —
Personal DTI + credit; lowest rate.
DSCR
20% down · 8.5% · 30yr
- Down + closing
- —
- Monthly P&I
- —
- Monthly cashflow
- —
- DSCR
- —
- Eligible?
- —
No personal income docs; deal must DSCR.
Hard money
10% down · 12.0% · 12mo
- Down + closing
- —
- Monthly P&I
- —
- Monthly cashflow
- —
- DSCR
- —
- Eligible?
- —
Short-term bridge; refi at stabilization.
Rent comps 15 comps
| Address | Beds | Baths | Sqft | Rent | $/sqft | DOM | Units | Dist |
|---|---|---|---|---|---|---|---|---|
| 1000 Heathcliff Dr Unit 1 Richmond, KY | 3.0 | 2.0 | 1100 | $1,225 | $1.11 | 23d | 1 | 0.56mi |
| 172 S Killarney Ln Unit 6 Richmond, KY | 2.0 | 1.5 | 1000 | $875 | $0.88 | 14d | 1 | 0.67mi |
| 107 Robbins Dr Unit 18 Richmond, KY | 2.0 | 1.0 | 810 | $900 | $1.11 | 23d | 1 | 0.79mi |
| 107 Robbins Dr Unit 4 Richmond, KY | 2.0 | 1.0 | 810 | $900 | $1.11 | 43d | 1 | 0.80mi |
| 2319 Lantern Ridge Dr Unit 3 Richmond, KY | 2.0 | 2.0 | 1121 | $1,450 | $1.29 | 23d | 1 | 1.06mi |
| 337 High St Apt 2 Richmond, KY | 2.0 | 1.0 | 750 | $750 | $1.00 | 14d | 1 | 1.13mi |
| 337 High St Apt 3 Richmond, KY | 2.0 | 1.0 | 750 | $875 | $1.17 | 43d | 1 | 1.13mi |
| 325 S 3rd St Unit B Richmond, KY | 2.0 | 1.0 | 1000 | $1,195 | $1.20 | 23d | 1 | 1.14mi |
| 333 High St Unit A Richmond, KY | 2.0 | 2.0 | 1100 | $1,600 | $1.45 | 43d | 1 | 1.15mi |
| 327 High St Apt B Richmond, KY | 2.0 | 2.0 | 1100 | $1,550 | $1.41 | 14d | 1 | 1.16mi |
| 327 High St Unit C Richmond, KY | 2.0 | 2.0 | 1100 | $950 | $0.86 | 43d | 1 | 1.16mi |
| 2 Wellington Ct Unit A Richmond, KY | 3.0 | 1.0 | 1100 | $2,450 | $2.23 | 43d | 1 | 1.21mi |
| 512 Claire Pl Richmond, KY | 1.0–2.0 | 1.0–2.0 | 913 | $1,345 | $1.47 | 43d | 2 | 1.45mi |
| 103 Rice Ct Unit 3 Richmond, KY | 2.0 | 1.0 | 700 | $950 | $1.36 | 43d | 1 | 1.50mi |
| 103 Rice Ct Unit 5 Richmond, KY | 2.0 | 1.0 | 700 | $800 | $1.14 | 23d | 1 | 1.50mi |
HOA detail
- Monthly dues
- $467 · $5,604/yr
Listing history 16 events
-
2026-06-18days on market $64,995 Active 236 DOM
-
2026-06-17days on market $64,995 Active 235 DOM
-
2026-06-16days on market $64,995 Active 234 DOM
-
2026-06-15days on market $64,995 Active 233 DOM
-
2026-06-14days on market $64,995 Active 231 DOM
-
2026-06-10days on market $64,995 Active 228 DOM
-
2026-06-09days on market $64,995 Active 227 DOM
-
2026-06-08days on market $64,995 Active 226 DOM
-
2026-06-07days on market $64,995 Active 225 DOM
-
2026-06-05days on market $64,995 Active 222 DOM
-
2026-06-03days on market $64,995 Active 221 DOM
-
2026-06-02days on market $64,995 Active 220 DOM
-
2026-06-01days on market $64,995 Active 219 DOM
-
2026-05-31days on market $64,995 Active 218 DOM
-
2026-05-31days on market $64,995 Active 217 DOM
-
2025-10-26$64,995 Active 287-char remark
Show marketing remark (287 chars)
Located less than one mile from Eastern Kentucky University, and just around the corner from University Shopping Center, Bradbury Pointe is an established community surrounded by mature trees that is close to shopping, employment and schools. Community Amenities Clubhouse and Playground
ⓘ Source: listings_history table (triggers on properties + properties_extension) + one-shot
backfill from property_details.listing_events for pre-trigger history.
Nearby sold comps map
Loading sold comps map…
Walkable amenities ~0.75 mi
Loading nearby amenities…
Taxation est. · year 1
- Rental income
- $14,343
- − Mortgage interest
- −$3,641
- − Property taxes
- −$975
- − Insurance
- −$325
- − Repairs & maintenance
- −$1,147
- − Management
- −$1,147
- − HOA
- −$5,604
- − Depreciation
- −$1,891
- Taxable loss
- −$388
- Est. tax savings @ 24.0%
- +$93
- After-tax cash flow
- $430/yr
For passive investors: Depreciation is non-cash, so a rental often shows a tax loss while cash-flowing — sheltering income. Rental losses are passive: they offset passive income freely, and up to $25,000/yr can offset ordinary (W-2) income if you actively participate and your MAGI is under $100k (phasing out to $0 by $150k); unused losses carry forward. On sale, claimed depreciation is recaptured at up to 25%, and gains may owe capital-gains tax (a 1031 exchange can defer both). Figures are a year-1 estimate at your 24.0% rate — not tax advice; consult a CPA.
Condition & rehab AI · 12 photos
This manufactured home is in good condition with a modern interior and exterior. It is move-in ready and has potential for further value enhancement through minor updates.
Value-add opportunities
- Both Paint exterior siding — Enhances curb appeal and adds value.
- Both Replace window treatments — Modernizes look and improves energy efficiency.
- Both Install smart home devices — Enhances convenience and adds value for potential buyers/renters.
Renovation cost estimate screening
Value-add ROI direction
- Both Paint exterior siding — Enhances curb appeal and adds value. ↑
- Both Replace window treatments — Modernizes look and improves energy efficiency. ↑
- Both Install smart home devices — Enhances convenience and adds value for potential buyers/renters. ↑
ⓘ Cost ranges are severity-bucket heuristics (US national rule-of-thumb). Get contractor quotes + a written scope before underwriting a rehab budget.
Schools (NCES district)
- District
- Madison County
- NCES district ID
- 2103720
- Math proficiency
- 31% ▼ -16.00%
- Reading proficiency
- 47% ▼ -14.00%
- Median HH income
- $43,590
- Composite
- 32.99/100
- National rank
- #5580
- State rank
- #35 of 165 in KY
Livability — Richmond
- Score
- 69/100
- State rank
- #163
- US rank
- #8196
Category grades
Schools grade is shown separately in the Schools card above.
Census & demographics
- Census place
- Richmond, KY
- County
- Madison County · 93,568 people
- City population
- 65,961
- Metro
- Richmond-Berea, KY
- Population (ZIP)
- 65,961
- Household income
- $63,050
- Rent vs Own
- Severe rent burden
- 2031.0
Population outlook (Madison County) Hauer SSP2
- Today (2025)
- 99,241 people
- By 2030
- 104,927 · +5.7%
- By 2040
- 116,079 · +17.0%
- By 2050
- 127,293 · +28.3%
- By 2075
- 155,644 · +56.8%
- By 2100
- 176,488 · +77.8%
Race, ethnicity, and origin ACS 2023
- Neighborhood character
- Predominantly White (87%)
- Race & ethnicity
- White 87% Two or more races 5% Black 4% Hispanic / Latino 3%
- Common ancestry
- Slovak 2% Italian 2% Serbian 1%
- Foreign-born
- 3% · Canada
- Languages at home
- 96% English-only · Spanish 3%
Political lean MEDSL · Madison
- 2024 margin
- Solid R (+30.9) · D 33.6% · R 64.5% · Other 1.9%
- 2008→2024 swing
- -8.4pp toward R · 2008: -22.4pp · 2024: -30.9pp
- All cycles
- 2024: R+30.9 2020: R+26.8 2016: R+31.2 2012: R+28.9 2008: R+22.4
Not yet ingested
- Civics
- —
Market trends
- HPI YoY
- ▼ -72.04%
- Current HPI
- 245.8489
- Rent YoY
- ▲ 2.82%
- Metro
- Richmond-Berea, KY
- State GDP YoY
- ▲ 1.81%
- F500 in state
- 4
Industry mix (Fortune 500 HQ in KY)
| Industry | F500 HQs | Revenue |
|---|---|---|
| Healthcare | 1 | $118B |
|
||
| Food / Beverage | 1 | $7B |
|
||
Price history
1 event — show timeline
- 2025-10-26 Listed $64,995 Zillow
Cash-flow waterfall
monthlySold comps — $/sqft
last 12 mo · ≤1 miLoading sold comps…