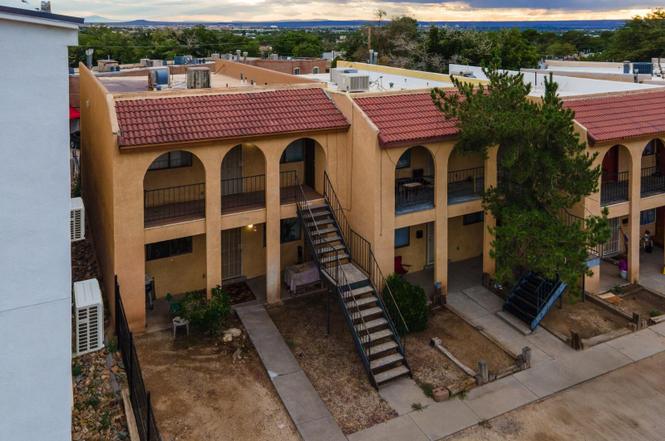
12708 Copper Ave NE · Albuquerque, NM
Flood risk 1/10 · Minimal
- FEMA flood zone
- X (unshaded)
- Chance of flooding over 30 yrs
- 0.0%
- Est. flood insurance / yr
- $507 – $1,088
Fire risk 4/10 · Minor
- Est. fire insurance / yr
- $706 – $1,312
Heat risk 4/10 · Minor
- Hot days now (above 91°F)
- 6 days/yr
- Hot days in 30 yrs
- 15 days/yr
Wind risk 1/10 · Minimal
- Chance of severe wind over 30 yrs
- —
Air-quality risk 1/10 · Minimal
- Unhealthy air days now
- 0 days/yr
- Unhealthy air days in 30 yrs
- 0 days/yr
Risk factors via First Street. Map © Google.
Why this score? — see what drove the D+ grade
The composite is a weighted blend of 9 inputs, each scored 0–100. Each bar is that input's sub-score; the figure is the points it added to the 100-point composite (weight × sub-score).
- Cash flow +18.7/30.0
- ARV discount +7.5/15.0
- DSCR +5.9/10.0
- Schools +5.3/10.0
- 1% rule +4.4/10.0
- Livability +3.6/5.0
- Condition / age +2.5/5.0
- Rent growth +2.0/5.0
- Appreciation +0.0/10.0
$225,000
🖨 Deal sheet 📄 Offer letter ✓ Due diligence
Listing remarks
The property features specious two bedroom one bathroom units with stand alone front and rear entrances as well as their own internal laundry room. The two units are stacked on top of each other and adjacent to two similar duplexes. Additionally, each unit is separately metered for electric and gas. The upper floor unit is vacant and needs a bit of work to be rent-ready. With an ask $225,000 there is a lot of runway on this deal as the dozen comparable sales support a market value of $383,826, this charmer will go fast.
Key facts
- Separately metered
- 3,920 sq ft lot
- Built 1978
Tags
Neighborhood map
What this means for you Summary
Snapshot
- This is a 4-bed/2.0-bath other listed at $225k.
Deal economics
- At list price, monthly cash flow is $222 ($3k/yr) — positive.
- The deal already cash-flows at list — no discount required.
- To meet the 1% rule (rent ≥ 1% of price), the offer needs to be $213k (5.5% below list).
- Recommended offer: $205k (9.0% below list) — sets the bar for market timing.
- Cap rate 7.5% vs local median 3.7% in Albuquerque — top-decile yield for the area; either an underpriced asset or a hidden risk that comps aren't pricing in. Stress-test before assuming the spread holds.
Location & tenants
- Location reads 72/100 on livability (#13 in NM) — a middle-class / working-renter tenant base. Strengths: amenities A+, commute A+, cost of living A+; Watch: schools D-, crime F.
- Albuquerque Public Schools (urban): math 51% / reading 75% proficiency, ranked #3 of 29 in NM (top 10%) — acceptable for families but not a draw, mixed tenant base, ~2y average lease; 60% free/reduced lunch — lower-income household profile, screen leases tightly.
- Market conditions: Rents soft (-2.1%/yr); 202 active listings in the ZIP; 11 comparable units currently listed for rent nearby; rentals at typical pace (median 24d on market — plan ~3-4 weeks tenant-placement turnaround); 45% of comp listings sitting > 30 days — soft ceiling on asking rent; 1,316 units permitted in Bernalillo County in 2024 (546 in 5+ unit buildings).
- This rent runs 40% of the median local income ($64k/yr) — at the standard rent-burdened threshold; future hikes will face affordability resistance.
Forward outlook
- Local home prices are declining (-3.0%/yr); year-one equity from $2k of loan paydown is wiped out by about $7k of value loss. Plan a longer hold.
Negotiation context
- It's been on market 93 days — a 9% lower offer ($205k) is reasonable based on typical stale-listing flexibility.
- 2 sale attempts; this cycle's ask is 13% above the opening price — seller raised mid-cycle; expect resistance to lowballs.
Questions for the listing agent
- It's been on market 93 days. Have you received any prior offers? Is the seller open to a 9% concession, seller financing, or rate buy-down credit?
- Built in 1978 — when were the roof, HVAC, electrical panel, plumbing, and water heater last replaced?
- Why hasn't it sold? Are there any deal-killer items the seller is aware of (foundation, flood, title, zoning, code violations)?
- Is there a deadline driving the sale (1031 exchange, divorce, estate, relocation)? That informs how much negotiation room exists.
- Schools are D-rated, which usually means shorter tenancies and higher turnover. Who's the typical renter profile here, and what's been the actual vacancy rate?
- Crime grade is F in this area — have there been break-ins, vandalism, or insurance claims at this property in the last 3 years? What carrier currently insures it and at what premium?
- The area grade is low — what's the realistic commute time and amenity access for the typical tenant pool here? Any planned neighborhood developments (good or bad) we should know about?
- What's the average days-on-market for RENTAL listings here right now (not sales)? A rising rental-DOM trend means longer vacancies and softer asking-rent achievability than the comps imply.
- What's the recent tenant-quality profile in this submarket — average credit score on applications, eviction rate, late-payment / NSF rate, and stable-employment percentage? A property-management company in the area should have these aggregated.
- How much new for-sale + rental construction is in the pipeline within 1–3 miles? Heavy new supply typically softens prices + rents 12–24 months out; constrained supply supports both.
Investment metrics
- 1% rule
- 0.94% ✗
- Cap rate
- 7.48%
- Cash-on-cash
- 4.23%
- DSCR
- 1.19
- GRM
- 8.8
CMA / ARV
No comps found within radius.
Projected returns pro-forma
-3.0% appreciation · 0.0% rent growth · sell at horizon
- IRR
- -13.0%
- Equity multiple
- 0.55×
- Total profit
- $-28,589
- Equity at exit
- $33,548
- IRR
- -9.1%
- Equity multiple
- 0.51×
- Total profit
- $-30,889
- Equity at exit
- $19,454
Cash invested: $63,000 (down + closing). Projections, not guarantees.
Landlord ↔ Tenant lean methodology
- Overall (STATE)
- 55 Moderately Landlord-Leaning
- State New Mexico
- 55 Moderately Landlord-Leaning · D+3
- County
- — inherits STATE
- City
- — inherits STATE
ZIP-level market 87123
- Rents YoY
- -2.1%
- Active inventory
- 202
- Price-to-rent
- 8.8×
Monthly cashflow live
- Estimated rent
- $2,126 high interval (Pro) →
- Mortgage (P&I)
- −$1,180
- Tax from tax record
- −$184 /mo · $2,205/yr
- Insurance
- −$94
- HOA
- −$0
- Vacancy / Maint / Mgmt
- −$446
- Net cashflow
- $222
Break-even live
UW: 25.0% down · 7.5% · 30yr · 1.5% tax · 5.0% vac · 8.0% maint · 8.0% mgmt
Financing live
Cash to close
- Down payment
- $56,250
- Closing costs
- $6,750
- Reserves months
- —
- Total cash needed
- —
Loan-product check · same deal, 3 products live
Conventional
25% down · 7.5% · 30yr
- Down + closing
- —
- Monthly P&I
- —
- Monthly cashflow
- —
- DSCR
- —
- Eligible?
- —
Personal DTI + credit; lowest rate.
DSCR
20% down · 8.5% · 30yr
- Down + closing
- —
- Monthly P&I
- —
- Monthly cashflow
- —
- DSCR
- —
- Eligible?
- —
No personal income docs; deal must DSCR.
Hard money
10% down · 12.0% · 12mo
- Down + closing
- —
- Monthly P&I
- —
- Monthly cashflow
- —
- DSCR
- —
- Eligible?
- —
Short-term bridge; refi at stabilization.
Rent comps 11 comps
| Address | Beds | Baths | Sqft | Rent | $/sqft | DOM | Units | Dist |
|---|---|---|---|---|---|---|---|---|
| 13412 Turquoise Ave NE Albuquerque, NM | 3.0 | 2.0 | 1425 | $1,900 | $1.33 | 23d | 1 | 0.34mi |
| 12004 Zia Rd NE Albuquerque, NM | 2.0–3.0 | 1.5–2.0 | 1323 | $2,145 | $1.62 | 3d | 7 | 0.40mi |
| 905 La Charles Dr NE Albuquerque, NM | 3.0 | 2.0 | 1473 | $2,650 | $1.80 | 43d | 1 | 0.61mi |
| 1115 Hupmobile Dr NE Albuquerque, NM | 3.0 | 2.0 | 1950 | $2,400 | $1.23 | 43d | 1 | 0.72mi |
| 1221 Paisano St NE Albuquerque, NM | 4.0 | 2.0 | 2027 | $2,600 | $1.28 | 43d | 1 | 1.07mi |
| 328 Via Vista St SE Albuquerque, NM | 3.0 | 2.0 | 1460 | $2,075 | $1.42 | 3d | 1 | 1.08mi |
| 10843 Fort Point Ln NE Albuquerque, NM | 3.0 | 2.5 | 1768 | $2,195 | $1.24 | 23d | 1 | 1.19mi |
| 11208 Deer Lodge Pl SE Albuquerque, NM | 3.0 | 2.0 | 1408 | $1,950 | $1.38 | 43d | 1 | 1.26mi |
| 419 Sawtooth St SE Albuquerque, NM | 3.0 | 2.0 | 1785 | $1,950 | $1.09 | 3d | 1 | 1.26mi |
| 1500 Shirley St NE Albuquerque, NM | 3.0 | 2.0 | 1625 | $2,300 | $1.42 | 14d | 1 | 1.43mi |
| 829 Hackberry Trl SE Albuquerque, NM | 3.0 | 2.0 | 1516 | $1,950 | $1.29 | 43d | 1 | 1.47mi |
Listing history 15 events
-
2026-06-18days on market $225,000 Active 93 DOM
-
2026-06-17days on market $225,000 Active 92 DOM
-
2026-06-16days on market $225,000 Active 91 DOM
-
2026-06-15days on market $225,000 Active 90 DOM
-
2026-06-13days on market $225,000 Active 88 DOM
-
2026-06-10days on market $225,000 Active 85 DOM
-
2026-06-09days on market $225,000 Active 84 DOM
-
2026-06-08days on market $225,000 Active 83 DOM
-
2026-06-07statusdays on market $225,000 Active 82 DOM
-
2026-02-17status Pending
-
2026-01-13price $225,000
-
2026-01-13status Active
-
2025-11-15status Pending
-
2025-10-01$199,975 Active
-
2005-02-28soldstatus
ⓘ Source: listings_history table (triggers on properties + properties_extension) + one-shot
backfill from property_details.listing_events for pre-trigger history.
Tax reassessment forecast NM · Resets to sale price
- Current annual tax
- $2,205 · $184/mo
- Projected year-2 tax
- $2,205 · $184/mo
- Expected delta
- $0/yr ($0/mo · 0.0%)
ⓘ Screening estimate from a state-policy table — verify with the county assessor before closing.
Climate risk First Street
- Flood 1/10 Low FEMA zone X (unshaded) · 0% chance over 30 yrs
- Wildfire 4/10 Moderate
- Heat 4/10 Moderate 6 d/yr ≥91°F today · 15 d/yr by 30 yrs out
- Wind 1/10 Low
- Air quality 1/10 Low 0 unhealthy d/yr today · 0 by 30 yrs out
Nearby sold comps map
Loading sold comps map…
Walkable amenities ~0.75 mi
Loading nearby amenities…
Taxation est. · year 1
- Rental income
- $25,507
- − Mortgage interest
- −$12,603
- − Property taxes
- −$2,205
- − Insurance
- −$1,125
- − Repairs & maintenance
- −$2,041
- − Management
- −$2,041
- − Depreciation
- −$6,545
- Taxable loss
- −$1,053
- Est. tax savings @ 24.0%
- +$253
- After-tax cash flow
- $2,915/yr
For passive investors: Depreciation is non-cash, so a rental often shows a tax loss while cash-flowing — sheltering income. Rental losses are passive: they offset passive income freely, and up to $25,000/yr can offset ordinary (W-2) income if you actively participate and your MAGI is under $100k (phasing out to $0 by $150k); unused losses carry forward. On sale, claimed depreciation is recaptured at up to 25%, and gains may owe capital-gains tax (a 1031 exchange can defer both). Figures are a year-1 estimate at your 24.0% rate — not tax advice; consult a CPA.
Schools (NCES district)
- District
- Albuquerque Public Schools
- NCES district ID
- 3500060
- Math proficiency
- 51% ▲ 30.00%
- Reading proficiency
- 75% ▲ 45.00%
- Median HH income
- $48,151
- Composite
- 53.29/100
- National rank
- #1487
- State rank
- #3 of 29 in NM
Livability — Albuquerque
- Score
- 72/100
- State rank
- #13
- US rank
- #6219
Category grades
Schools grade is shown separately in the Schools card above.
Census & demographics
- Census place
- Albuquerque, NM
- County
- Bernalillo County · 647,165 people
- City population
- 647,165
- Metro
- Albuquerque, NM
- Population (ZIP)
- 42,252
- Household income
- $64,359
- Rent vs Own
- Severe rent burden
- 1657.0
Population outlook (Bernalillo County) Hauer SSP2
- Today (2025)
- 704,528 people
- By 2030
- 711,723 · +1.0%
- By 2040
- 714,522 · +1.4%
- By 2050
- 709,274 · +0.7%
- By 2075
- 680,015 · -3.5%
- By 2100
- 619,879 · -12.0%
Race, ethnicity, and origin ACS 2023
- Neighborhood character
- Diverse neighborhood (Simpson 0.64)
- Race & ethnicity
- Hispanic / Latino 44% White 40% Two or more races 18% Native American 6% Asian 5% Black 2%
- Hispanic origin (detail)
- Mexican 28%
- Common ancestry
- Italian 2% Romanian 2% Lithuanian 1%
- Foreign-born
- 12% · Canada, Vietnam
- Languages at home
- 71% English-only · Spanish 22% Vietnamese 2%
Political lean MEDSL · Bernalillo
- 2024 margin
- Strong D (+21.0) · D 59.2% · R 38.2% · Other 2.6%
- 2008→2024 swing
- -0.3pp no change · 2008: 21.4pp · 2024: 21.0pp
- All cycles
- 2024: D+21.0 2020: D+24.4 2016: D+17.8 2012: D+16.2 2008: D+21.4
Not yet ingested
- Civics
- —
Market trends
- HPI YoY
- ▼ -231.76%
- Current HPI
- 233.3553
- Rent YoY
- ▼ -2.10%
- Metro
- Albuquerque, NM
- State GDP YoY
- —
- F500 in state
- 0
Price history
+12.5% since first listed6 events — show timeline
- 2026-02-17 Pending — Southwest MLS
- 2026-01-13 Price Changed $225,000 Southwest MLS
- 2026-01-13 Relisted — Southwest MLS
- 2025-11-15 Pending — Southwest MLS
- 2025-10-01 Listed $199,975 Southwest MLS
- 2005-02-28 Sold (Public Records) — Public Records
Property tax history
+2.6%/yrLatest (2025): $2,205 · +3.2% YoY. Source: county tax records.
Cash-flow waterfall
monthlySold comps — $/sqft
last 12 mo · ≤1 miLoading sold comps…