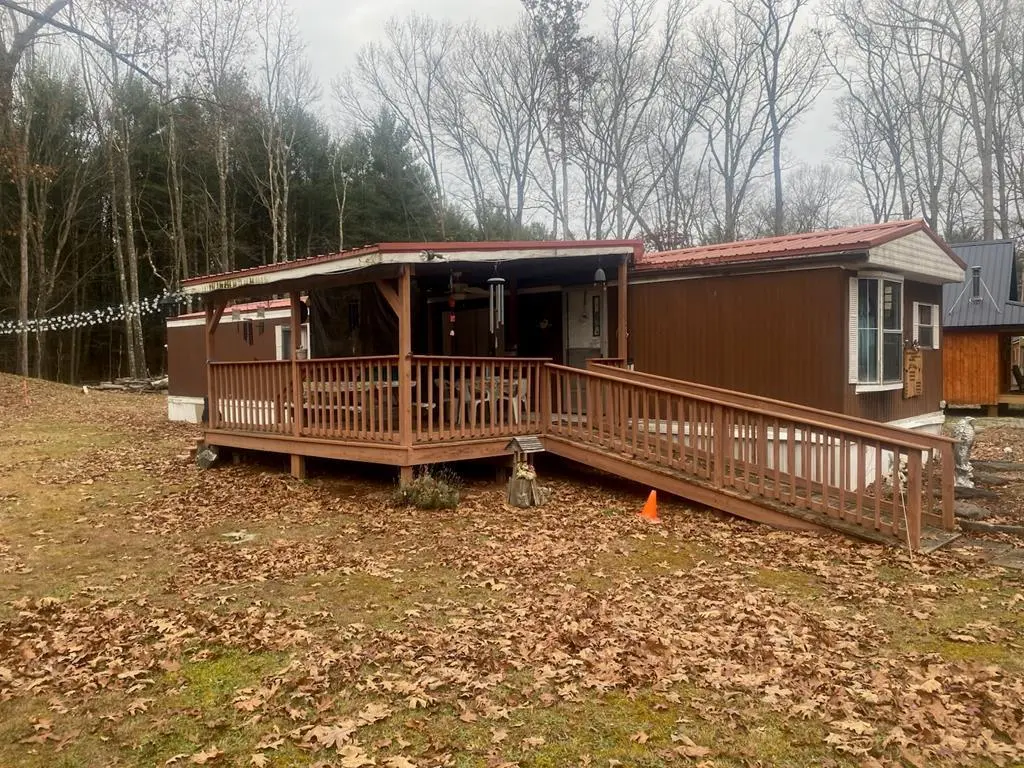
541 Red Pine Cir · Farmington, PA
Flood risk 1/10 · Minimal
- FEMA flood zone
- X (unshaded)
- Chance of flooding over 30 yrs
- 0.0%
- Est. flood insurance / yr
- $507 – $1,088
Fire risk 2/10 · Minimal
- Est. fire insurance / yr
- $511 – $949
Heat risk 2/10 · Minimal
- Hot days now (above 91°F)
- 7 days/yr
- Hot days in 30 yrs
- 17 days/yr
Wind risk 2/10 · Minimal
- Chance of severe wind over 30 yrs
- —
Air-quality risk 2/10 · Minimal
- Unhealthy air days now
- 1 days/yr
- Unhealthy air days in 30 yrs
- 2 days/yr
Risk factors via First Street. Map © Google.
Why this score? — see what drove the B- grade
The composite is a weighted blend of 9 inputs, each scored 0–100. Each bar is that input's sub-score; the figure is the points it added to the 100-point composite (weight × sub-score).
- Cash flow +23.3/30.0
- Appreciation +7.9/10.0
- DSCR +7.5/10.0
- ARV discount +7.5/15.0
- 1% rule +6.8/10.0
- Schools +4.3/10.0
- Livability +3.4/5.0
- Rent growth +2.5/5.0
- Condition / age +2.5/5.0
$76,900
🖨 Deal sheet 📄 Offer letter ✓ Due diligence
Listing remarks MLS
Well kept, three-bedroom Mobile Home in great location. Minutes from thousands of acres of State Game Lands, and Nebraska boat launch (Tionesta Lak Access). Very nearby are ATV trails, snowmobile trails, hiking trails, Allegheny River, Allegheny National Forest, Cook Forest State Park. Loads of outdoor activities and minimal upkeep for the lot and mobile home.
Key facts
- Snowmobile trails
- Allegheny river
- Atv trails
Tags
Neighborhood map
What this means for you Summary
Snapshot
- This is a 3-bed/1.0-bath manufactured listed at $77k.
Deal economics
- At list price, monthly cash flow is $141 ($2k/yr) — positive.
- The deal already cash-flows at list — no discount required.
- Meets the 1% rule at list price ($907 rent vs $77k).
- Recommended offer: $68k (12.0% below list) — sets the bar for market timing.
Location & tenants
- Location reads 68/100 on livability (#904 in PA) — a middle-class / working-renter tenant base. Strengths: cost of living A+, housing A+, employment A-; Watch: crime C-, amenities F, commute F.
- North Clarion County SD (rural): math 45% / reading 56% proficiency, ranked #178 of 539 in PA (top 33%) — acceptable for families but not a draw, mixed tenant base, ~2y average lease.
- Market conditions: 28 active listings in the ZIP; 25 units permitted in Clarion County in 2024 (0 in 5+ unit buildings).
Forward outlook
- In year one you build about $5k of equity ($532 loan paydown + $5k appreciation (5.9% local appreciation)).
- Clarion County population projected at -18% by 2050 — secular population decline; favor cash flow + early exit over multi-decade hold.
- At projected returns (5.9% appreciation + 3.0% rent growth), your $22k cash investment doubles in ~3 years — after that, you're playing with house money.
- By year 7, paydown + projected appreciation supports a ~$33k cash-out refi (75% LTV) — recoverable capital for the next deal without selling this one.
Negotiation context
- It's been on market 567 days — a 12% lower offer ($68k) is reasonable based on typical stale-listing flexibility.
Questions for the listing agent
- It's been on market 567 days. Have you received any prior offers? Is the seller open to a 12% concession, seller financing, or rate buy-down credit?
- Why hasn't it sold? Are there any deal-killer items the seller is aware of (foundation, flood, title, zoning, code violations)?
- Is there a deadline driving the sale (1031 exchange, divorce, estate, relocation)? That informs how much negotiation room exists.
- Schools are B-rated — typically a magnet for longer-tenancy family renters. What's the average tenant stay here, and is there a school-zone premium baked into asking?
- What's the average days-on-market for RENTAL listings here right now (not sales)? A rising rental-DOM trend means longer vacancies and softer asking-rent achievability than the comps imply.
- What's the recent tenant-quality profile in this submarket — average credit score on applications, eviction rate, late-payment / NSF rate, and stable-employment percentage? A property-management company in the area should have these aggregated.
- How much new for-sale + rental construction is in the pipeline within 1–3 miles? Heavy new supply typically softens prices + rents 12–24 months out; constrained supply supports both.
Investment metrics
- 1% rule
- 1.18% ✓
- Cap rate
- 8.49%
- Cash-on-cash
- 7.85%
- DSCR
- 1.35
- GRM
- 7.1
CMA / ARV
No comps found within radius.
Projected returns pro-forma
5.89% appreciation · 3.0% rent growth · sell at horizon
- IRR
- 21.6%
- Equity multiple
- 2.43×
- Total profit
- $30,718
- Equity at exit
- $47,811
- IRR
- 20.7%
- Equity multiple
- 4.88×
- Total profit
- $83,543
- Equity at exit
- $86,248
Cash invested: $21,532 (down + closing). Projections, not guarantees.
Landlord ↔ Tenant lean methodology
- Overall (STATE)
- 62 Landlord-Friendly
- State Pennsylvania
- 62 Landlord-Friendly · EVEN
- County
- — inherits STATE
- City
- — inherits STATE
ZIP-level market 16353
- Home prices YoY
- 4.2%
- Active inventory
- 28
- Price-to-rent
- 7.1×
Monthly cashflow live
- Estimated rent
- $907 medium interval (Pro) →
- Mortgage (P&I)
- −$403
- Tax from tax record
- −$140 /mo · $1,681/yr
- Insurance
- −$32
- HOA
- −$0
- Vacancy / Maint / Mgmt
- −$190
- Net cashflow
- $141
Break-even live
UW: 25.0% down · 7.5% · 30yr · 1.5% tax · 5.0% vac · 8.0% maint · 8.0% mgmt
Financing live
Cash to close
- Down payment
- $19,225
- Closing costs
- $2,307
- Reserves months
- —
- Total cash needed
- —
Loan-product check · same deal, 3 products live
Conventional
25% down · 7.5% · 30yr
- Down + closing
- —
- Monthly P&I
- —
- Monthly cashflow
- —
- DSCR
- —
- Eligible?
- —
Personal DTI + credit; lowest rate.
DSCR
20% down · 8.5% · 30yr
- Down + closing
- —
- Monthly P&I
- —
- Monthly cashflow
- —
- DSCR
- —
- Eligible?
- —
No personal income docs; deal must DSCR.
Hard money
10% down · 12.0% · 12mo
- Down + closing
- —
- Monthly P&I
- —
- Monthly cashflow
- —
- DSCR
- —
- Eligible?
- —
Short-term bridge; refi at stabilization.
Listing history 16 events
-
2026-06-18days on market $76,900 Active 567 DOM
-
2026-06-17days on market $76,900 Active 566 DOM
-
2026-06-16days on market $76,900 Active 565 DOM
-
2026-06-15days on market $76,900 Active 564 DOM
-
2026-06-13days on market $76,900 Active 562 DOM
-
2026-06-12days on market $76,900 Active 561 DOM
-
2026-06-09days on market $76,900 Active 558 DOM
-
2026-06-08days on market $76,900 Active 557 DOM
-
2026-06-08days on market $76,900 Active 556 DOM
-
2026-06-07days on market $76,900 Active 555 DOM
-
2026-06-04days on market $76,900 Active 552 DOM
-
2026-06-02days on market $76,900 Active 551 DOM
-
2026-06-01days on market $76,900 Active 550 DOM
-
2026-05-31days on market $76,900 Active 549 DOM
-
2025-11-22price $79,900 362-char remark
Show marketing remark (362 chars)
Well kept, three-bedroom Mobile Home in great location. Minutes from thousands of acres of State Game Lands, and Nebraska boat launch (Tionesta Lak Access). Very nearby are ATV trails, snowmobile trails, hiking trails, Allegheny River, Allegheny National Forest, Cook Forest State Park. Loads of outdoor activities and minimal upkeep for the lot and mobile home.
-
2024-11-28$74,900 Active 362-char remark
Show marketing remark (362 chars)
Well kept, three-bedroom Mobile Home in great location. Minutes from thousands of acres of State Game Lands, and Nebraska boat launch (Tionesta Lak Access). Very nearby are ATV trails, snowmobile trails, hiking trails, Allegheny River, Allegheny National Forest, Cook Forest State Park. Loads of outdoor activities and minimal upkeep for the lot and mobile home.
ⓘ Source: listings_history table (triggers on properties + properties_extension) + one-shot
backfill from property_details.listing_events for pre-trigger history.
Tax reassessment forecast PA · Partial reset (capped growth)
- Current annual tax
- $1,681 · $140/mo
- Projected year-2 tax
- $1,681 · $140/mo
- Expected delta
- $0/yr ($0/mo · 0.0%)
ⓘ Screening estimate from a state-policy table — verify with the county assessor before closing.
Climate risk First Street
- Flood 1/10 Low FEMA zone X (unshaded) · 0% chance over 30 yrs
- Wildfire 2/10 Low
- Heat 2/10 Low 7 d/yr ≥91°F today · 17 d/yr by 30 yrs out
- Wind 2/10 Low
- Air quality 2/10 Low 1 unhealthy d/yr today · 2 by 30 yrs out
Nearby sold comps map
Loading sold comps map…
Walkable amenities ~0.75 mi
Loading nearby amenities…
Taxation est. · year 1
- Rental income
- $10,881
- − Mortgage interest
- −$4,308
- − Property taxes
- −$1,681
- − Insurance
- −$384
- − Repairs & maintenance
- −$870
- − Management
- −$870
- − Depreciation
- −$2,237
- Taxable income
- $529
- Est. tax owed @ 24.0%
- −$127
- After-tax cash flow
- $1,564/yr
For passive investors: Depreciation is non-cash, so a rental often shows a tax loss while cash-flowing — sheltering income. Rental losses are passive: they offset passive income freely, and up to $25,000/yr can offset ordinary (W-2) income if you actively participate and your MAGI is under $100k (phasing out to $0 by $150k); unused losses carry forward. On sale, claimed depreciation is recaptured at up to 25%, and gains may owe capital-gains tax (a 1031 exchange can defer both). Figures are a year-1 estimate at your 24.0% rate — not tax advice; consult a CPA.
Schools (NCES district)
- District
- North Clarion County SD
- NCES district ID
- 4217130
- Math proficiency
- 45% ▼ -5.00%
- Reading proficiency
- 56% ▼ -11.00%
- Median HH income
- $45,965
- Composite
- 42.77/100
- National rank
- #3153
- State rank
- #178 of 539 in PA
Livability — Farmington
- Score
- 68/100
- State rank
- #904
- US rank
- #9641
Category grades
Schools grade is shown separately in the Schools card above.
Census & demographics
- Population (ZIP)
- 2,459
Population outlook (Clarion County) Hauer SSP2
- Today (2025)
- 37,796 people
- By 2030
- 36,830 · -2.6%
- By 2040
- 34,113 · -9.7%
- By 2050
- 31,092 · -17.7%
- By 2075
- 24,200 · -36.0%
- By 2100
- 18,737 · -50.4%
Race, ethnicity, and origin ACS 2023
- Neighborhood character
- Predominantly White (98%)
- Race & ethnicity
- White 98% Two or more races 1%
- Common ancestry
- Romanian 5% Lithuanian 2% Iranian 2%
- Foreign-born
- 1%
- Languages at home
- 96% English-only · German/W. Germanic 4%
Political lean MEDSL · Clarion
- 2024 margin
- Solid R (+53.1) · D 23.1% · R 76.2%
- 2008→2024 swing
- -30.7pp toward R · 2008: -22.4pp · 2024: -53.1pp
- All cycles
- 2024: R+53.1 2020: R+50.8 2016: R+47.4 2012: R+36.1 2008: R+22.4
Not yet ingested
- Civics
- —
Market trends
- HPI YoY
- ▲ 5.89%
- Current HPI
- 146.6533
- Rent YoY
- —
- Metro
- —
- State GDP YoY
- ▲ 1.68%
- F500 in state
- 34
Industry mix (Fortune 500 HQ in PA)
| Industry | F500 HQs | Revenue |
|---|---|---|
| Healthcare | 2 | $309B |
|
||
| Insurance | 2 | $27B |
|
||
| Telecommunications / Media | 1 | $124B |
|
||
| Industrial Distribution | 1 | $22B |
|
||
| Financial Services | 1 | $20B |
|
||
| Chemicals / Materials | 1 | $18B |
|
||
Price history
+6.7% since first listed2 events — show timeline
- 2025-11-22 Price Changed $79,900 AVBREALTORS
- 2024-11-28 Listed $74,900 AVBREALTORS
Property tax history
+21.8%/yrLatest (2026): $1,681 · +448.3% YoY. Source: county tax records.
Cash-flow waterfall
monthlySold comps — $/sqft
last 12 mo · ≤1 miLoading sold comps…