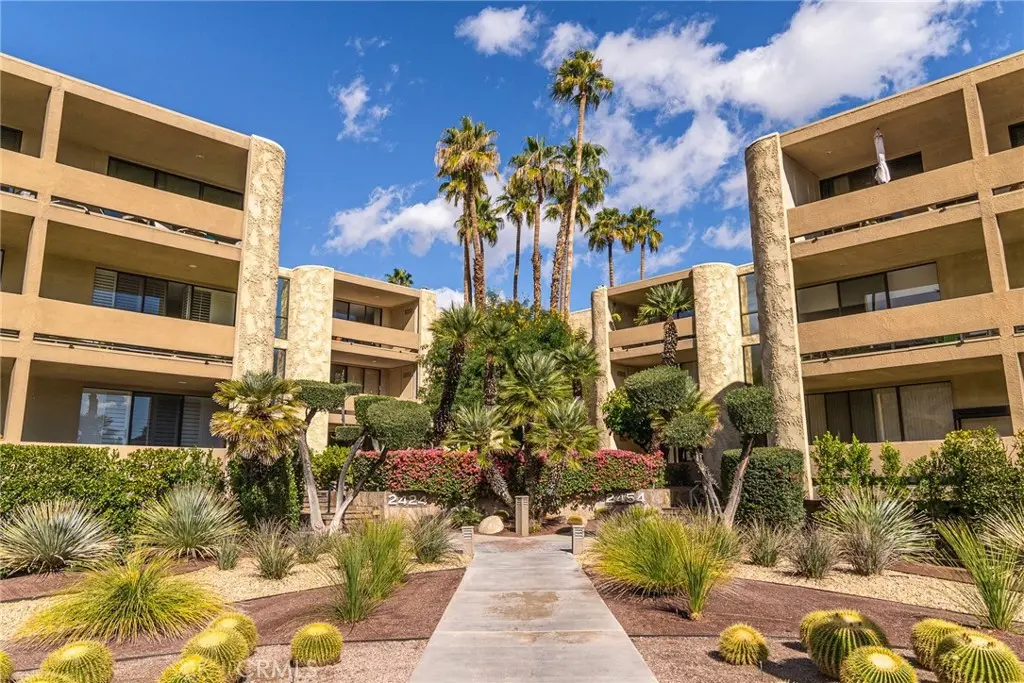
2424 E Palm Cyn Unit 2D · Palm Springs, CA
Flood risk 1/10 · Minimal
- FEMA flood zone
- X
- Chance of flooding over 30 yrs
- 0.0%
- Est. flood insurance / yr
- $507 – $1,088
Fire risk 5/10 · Moderate
- Est. fire insurance / yr
- $659 – $1,223
Heat risk 9/10 · Severe
- Hot days now (above 110°F)
- 7 days/yr
- Hot days in 30 yrs
- 22 days/yr
Wind risk 1/10 · Minimal
- Chance of severe wind over 30 yrs
- —
Air-quality risk 5/10 · Moderate
- Unhealthy air days now
- 6 days/yr
- Unhealthy air days in 30 yrs
- 8 days/yr
Risk factors via First Street. Map © Google.
Why this score? — see what drove the D- grade
The composite is a weighted blend of 9 inputs, each scored 0–100. Each bar is that input's sub-score; the figure is the points it added to the 100-point composite (weight × sub-score).
- Cash flow +10.5/30.0
- ARV discount +7.5/15.0
- 1% rule +5.9/10.0
- Livability +3.3/5.0
- DSCR +3.0/10.0
- Schools +2.7/10.0
- Condition / age +2.5/5.0
- Rent growth +2.4/5.0
- Appreciation +0.0/10.0
$450,000
🖨 Deal sheet 📄 Offer letter ✓ Due diligence
Listing remarks
Welcome to easy living at The Diplomat, a highly desirable mid-rise building in the heart of South Palm Springs. Step through the double doors into a sophisticated residence where floor-to-ceiling windows in every room flood the interior with natural light and frame breathtaking, panoramic views of the mountains and swaying palms. This move-in-ready, beautifully renovated home is designed for both relaxation and grand entertaining. The spacious living and dining area features upgraded lighting for a warm evening ambiance and a mirrored wet bar, perfect for hosting guests. For the culinary enthusiast, the elongated galley kitchen is a chef’s dream, boasting two French-door stainless-st
Key facts
- Mirrored wet bar
- Panoramic views
- $1,050 HOA
Tags
Property features AI
Finance
- Other: Community name: Diplomat (48 units)
- Financial info: Land lease: $6,000 (land lease renewal date: January 1, 2089)
- HOA & community: Part of an association; Monthly association fee: $1,050; Association covers insurance, water, sewer, pool, trash, and grounds maintenance; Association spa/jacuzzi available
Exterior
- Parking: Assigned parking (subterranean); 1 uncovered space
- Utilities: Public sewer; District/Public water
- Home design: Condominium in a multi-family building; Attached property; 3 total stories in the building; Has a view
- Construction: 48-unit community; 1 common wall
- Exterior features: Community pool (association); Sidewalks
Interior
- Kitchen: Tile counters; Microwave; Refrigerator; Electric range; Dishwasher; Water heater unit
- Bedrooms: 2 bedrooms on the main level; Primary bedroom
- Flooring: Tile flooring; Laminate flooring
- Bathrooms: 2 full bathrooms (main level)
- Heating & cooling: Central heating (furnace); Central cooling
- Interior features: Double door entry; Wet bar; Balcony; Ceiling fan(s); Recessed lighting; Open floor plan; Window blinds; One level (first floor entry)
- Laundry & utility: Washer hookup; Gas dryer hookup; In-closet laundry
Neighborhood map
What this means for you Summary
Snapshot
- This is a 2-bed/2.0-bath condo listed at $450k.
Deal economics
- At list price, monthly cash flow is $-234 ($-3k/yr) — negative.
- To cash-flow at today's rent, offer at most $409k (9.2% below list).
- Meets the 1% rule at list price ($5k rent vs $450k).
- Recommended offer: $409k (9.2% below list) — sets the bar for cash-flow.
- Cap rate 5.7% vs local median 2.7% in Palm Springs — top-decile yield for the area; either an underpriced asset or a hidden risk that comps aren't pricing in. Stress-test before assuming the spread holds.
Location & tenants
- Location reads 66/100 on livability (#348 in CA) — a middle-class / working-renter tenant base. Strengths: amenities A+, commute A+; Watch: schools C-, crime F, cost of living F.
- Palm Springs Unified (suburban): math 21% / reading 42% proficiency, ranked #328 of 517 in CA (top 63%) — families likely to look elsewhere, expect single-tenant / working-renter base with shorter leases; 73% free/reduced lunch — lower-income household profile, screen leases tightly.
- Market conditions: Rents soft (-0.4%/yr); 492 active listings in the ZIP; 40 comparable units currently listed for rent nearby; rentals lingering (median 44d on market — plan ~5-8 weeks vacancy on turnover, expect pricing pressure); 62% of comp listings sitting > 30 days — soft ceiling on asking rent; solid renter incomes; 9,195 units permitted in Riverside County in 2024 (1,512 in 5+ unit buildings).
- At $4,906/mo this rent would consume 76% of the median local household income ($78k/yr) (locally 1215% of renters already pay >50% of income on rent) — very limited rent-growth headroom before tenants either downsize or default.
Forward outlook
- Local home prices are declining (-3.0%/yr); year-one equity from $3k of loan paydown is wiped out by about $14k of value loss. Plan a longer hold.
- Riverside County population projected at +22% by 2050 — long-run rental-demand tailwind backs the buy-and-hold thesis.
Negotiation context
- It's been on market 36 days — a 3% lower offer ($436k) is reasonable based on typical stale-listing flexibility.
- 12 sale attempts since 25y ago with the ask held roughly flat each time — persistent listings suggest the price (not the market) is what's stuck; bring a comps-based counter.
Risks & watch-outs
- Watch-outs: HOA is 21% of rent.
- Climate carrying-cost: moderate wildfire risk; extreme-heat days projected 7→22/yr by 2055 (HVAC capex compounding) — expect insurance premiums to compound above CPI over the hold.
Questions for the listing agent
- What do current leases actually rent for vs. the listed asking? Can we see a recent rent roll and the last 12 months of T-12 income?
- It's been on market 36 days. Have you received any prior offers? Is the seller open to a 9% concession, seller financing, or rate buy-down credit?
- Built in 1972 — when were the roof, HVAC, electrical panel, plumbing, and water heater last replaced?
- What does the HOA fee cover, when was the last increase, and are there any pending special assessments or reserve-fund shortfalls?
- Any open or pending special assessments — roof, HVAC, plumbing, elevator, façade? What's the per-unit balance and payoff schedule, and is the seller paying it off at close or rolling it to the buyer?
- Is there a deadline driving the sale (1031 exchange, divorce, estate, relocation)? That informs how much negotiation room exists.
- Crime grade is F in this area — have there been break-ins, vandalism, or insurance claims at this property in the last 3 years? What carrier currently insures it and at what premium?
- The area grade is low — what's the realistic commute time and amenity access for the typical tenant pool here? Any planned neighborhood developments (good or bad) we should know about?
- What's the average days-on-market for RENTAL listings here right now (not sales)? A rising rental-DOM trend means longer vacancies and softer asking-rent achievability than the comps imply.
- What's the recent tenant-quality profile in this submarket — average credit score on applications, eviction rate, late-payment / NSF rate, and stable-employment percentage? A property-management company in the area should have these aggregated.
- How much new apartment / multifamily construction is in the pipeline within 1–3 miles? Heavy new supply (>2% of stock underway) typically softens rents 12–24 months out; light construction supports rent growth.
Investment metrics
- 1% rule
- 1.09% ✓
- Cap rate
- 5.67%
- Cash-on-cash
- -2.23%
- DSCR
- 0.90
- GRM
- 7.6
CMA / ARV
No comps found within radius.
Projected returns pro-forma
-3.0% appreciation · 0.0% rent growth · sell at horizon
- IRR
- -24.4%
- Equity multiple
- 0.19×
- Total profit
- $-101,498
- Equity at exit
- $67,096
- IRR
- -39.0%
- Equity multiple
- -0.27×
- Total profit
- $-160,323
- Equity at exit
- $38,908
Cash invested: $126,000 (down + closing). Projections, not guarantees.
Landlord ↔ Tenant lean methodology
- Overall (STATE)
- 18 Strongly Tenant-Friendly
- State California
- 18 Strongly Tenant-Friendly · D+13
- County
- — inherits STATE
- City
- — inherits STATE
ZIP-level market 92264
- Rents YoY
- -0.4%
- Active inventory
- 492
- Price-to-rent
- 7.6×
Monthly cashflow live
- Estimated rent
- $4,906 high interval (Pro) →
- Mortgage (P&I)
- −$2,360
- Tax from tax record
- −$512 /mo · $6,146/yr
- Insurance
- −$188
- HOA
- −$1,050
- Vacancy / Maint / Mgmt
- −$1,030
- Net cashflow
- $-234
Break-even live
UW: 25.0% down · 7.5% · 30yr · 1.5% tax · 5.0% vac · 8.0% maint · 8.0% mgmt
Financing live
Cash to close
- Down payment
- $112,500
- Closing costs
- $13,500
- Reserves months
- —
- Total cash needed
- —
Loan-product check · same deal, 3 products live
Conventional
25% down · 7.5% · 30yr
- Down + closing
- —
- Monthly P&I
- —
- Monthly cashflow
- —
- DSCR
- —
- Eligible?
- —
Personal DTI + credit; lowest rate.
DSCR
20% down · 8.5% · 30yr
- Down + closing
- —
- Monthly P&I
- —
- Monthly cashflow
- —
- DSCR
- —
- Eligible?
- —
No personal income docs; deal must DSCR.
Hard money
10% down · 12.0% · 12mo
- Down + closing
- —
- Monthly P&I
- —
- Monthly cashflow
- —
- DSCR
- —
- Eligible?
- —
Short-term bridge; refi at stabilization.
Rent comps 40 comps
| Address | Beds | Baths | Sqft | Rent | $/sqft | DOM | Units | Dist |
|---|---|---|---|---|---|---|---|---|
| 1816 Pintura Cir W Palm Springs, CA | 2.0 | 3.0 | 1650 | $3,145 | $1.91 | 43d | 1 | 0.23mi |
| 2716 Anza Trl Palm Springs, CA | 3.0 | 2.0 | 1508 | $4,950 | $3.28 | 43d | 1 | 0.45mi |
| 3113 E San Martin Cir Palm Springs, CA | 3.0 | 2.0 | 1737 | $3,950 | $2.27 | 43d | 1 | 0.46mi |
| 2918 E Alta Loma Dr Palm Springs, CA | 3.0 | 3.0 | 2200 | $3,695 | $1.68 | 43d | 1 | 0.48mi |
| 1710 E Sonora Rd Palm Springs, CA | 2.0 | 2.0 | 1391 | $2,800 | $2.01 | 24d | 1 | 0.50mi |
| 3180 E Escoba Dr Palm Springs, CA | 3.0 | 2.0 | 1532 | $3,700 | $2.42 | 24d | 1 | 0.51mi |
| 1331 S Sunrise Way Palm Springs, CA | 3.0 | 3.0 | 2160 | $7,000 | $3.24 | 43d | 1 | 0.56mi |
| 1592 S Calle Rolph Palm Springs, CA | 2.0 | 3.0 | 2612 | $6,000 | $2.30 | 43d | 1 | 0.57mi |
| 1595 S Calle Rolph Palm Springs, CA | 3.0 | 3.5 | 2509 | $8,500 | $3.39 | 43d | 1 | 0.60mi |
| 1486 E Palm Tree Dr Palm Springs, CA | 2.0 | 2.0 | 1300 | $3,000 | $2.31 | 43d | 1 | 0.65mi |
| 3545 Ridgeview Cir Palm Springs, CA | 3.0 | 3.0 | 1783 | $5,675 | $3.18 | 43d | 1 | 0.65mi |
| 3545 Ridgeview Cir Palm Springs, CA | 3.0 | 2.5 | 1783 | $9,750 | $5.47 | 24d | 1 | 0.65mi |
| 3545 Ridgeview Cir Palm Springs, CA | 3.0 | 2.5 | 1783 | $9,750 | $5.47 | 3d | 1 | 0.65mi |
| 477 Desert Lakes Dr Palm Springs, CA | 2.0 | 3.0 | 2174 | $9,500 | $4.37 | 43d | 1 | 0.68mi |
| 449 Desert Lakes Dr Palm Springs, CA | 2.0 | 2.0 | 1778 | $3,000 | $1.69 | 24d | 1 | 0.70mi |
| 447 Desert Lakes Dr Palm Springs, CA | 3.0 | 3.0 | 2452 | $9,500 | $3.87 | 43d | 1 | 0.71mi |
| 2120 Southridge Dr Palm Springs, CA | 2.0 | 2.0 | 1600 | $3,000 | $1.88 | 44d | 1 | 0.81mi |
| 1150 E Palm Canyon Dr #60 Palm Springs, CA | 2.0 | 2.0 | 1240 | $2,595 | $2.09 | 24d | 1 | 0.83mi |
| 157 Desert Lakes Dr Palm Springs, CA | 3.0 | 2.0 | 2165 | $9,500 | $4.39 | 43d | 1 | 0.87mi |
| 2240 Sunshine Way Palm Springs, CA | 3.0 | 2.0 | 1350 | $2,250 | $1.67 | 24d | 1 | 0.89mi |
| 177 Westlake Dr Palm Springs, CA | 2.0 | 2.0 | 1545 | $12,500 | $8.09 | 43d | 1 | 0.93mi |
| 555 S Sunrise Way Palm Springs, CA | 3.0 | 4.0 | 2274 | $8,000 | $3.52 | 24d | 1 | 0.98mi |
| 1533 E Canyon Estates Dr Palm Springs, CA | 2.0 | 2.5 | 2593 | $2,500 | $0.96 | 43d | 1 | 1.01mi |
| 1041 S La Verne Way Palm Springs, CA | 2.0 | 2.0 | 1325 | $2,800 | $2.11 | 24d | 1 | 1.02mi |
| 622 S Highland Dr Palm Springs, CA | 3.0 | 3.0 | 1523 | $6,000 | $3.94 | 43d | 1 | 1.03mi |
| 965 E Twin Palms Dr Palm Springs, CA | 3.0 | 2.0 | 1600 | $15,000 | $9.38 | 43d | 1 | 1.04mi |
| 215 Desert Lakes Dr Palm Springs, CA | 2.0 | 2.0 | 2028 | $4,250 | $2.10 | 43d | 1 | 1.05mi |
| 1970 S Joshua Tree Pl Palm Springs, CA | 3.0 | 2.0 | 1957 | $8,175 | $4.18 | 43d | 1 | 1.07mi |
| 1970 S Joshua Tree Pl Palm Springs, CA | 3.0 | 2.0 | 1957 | $8,175 | $4.18 | 15d | 1 | 1.07mi |
| 1111 E Ramon Rd #87 Palm Springs, CA | 3.0 | 2.0 | 1313 | $4,500 | $3.43 | 17d | 1 | 1.10mi |
| 1947 S Joshua Tree Pl Palm Springs, CA | 3.0 | 2.5 | 1928 | $6,000 | $3.11 | 24d | 1 | 1.11mi |
| 540 Highland Dr Apt 5 Palm Springs, CA | 2.0 | 2.0 | 1985 | $2,495 | $1.26 | 24d | 1 | 1.12mi |
| 3730 E Camino San Miguel Palm Springs, CA | 2.0 | 2.0 | 1711 | $3,500 | $2.05 | 43d | 1 | 1.12mi |
| 791 E Twin Palms Dr Palm Springs, CA | 3.0 | 2.0 | 1793 | $9,700 | $5.41 | 43d | 1 | 1.14mi |
| 780 E Palm Canyon Dr #202 Palm Springs, CA | 2.0 | 2.0 | 1305 | $2,950 | $2.26 | 24d | 1 | 1.15mi |
| 16 Lakeview Cir Palm Springs, CA | 2.0 | 2.0 | 1965 | $8,000 | $4.07 | 43d | 1 | 1.19mi |
| 24 Desert Lakes Dr Palm Springs, CA | 2.0 | 2.0 | 1545 | $9,500 | $6.15 | 43d | 1 | 1.19mi |
| 500 Paseo Soleado Unit 485 Palm Springs, CA | 2.0 | 2.5 | 1712 | $2,800 | $1.64 | 43d | 1 | 1.24mi |
| 500 Paseo Soleado Unit 497 Palm Springs, CA | 3.0 | 2.5 | 1812 | $3,000 | $1.66 | 43d | 1 | 1.24mi |
| 70 Lakeview Dr Palm Springs, CA | 2.0 | 2.0 | 1545 | $9,000 | $5.83 | 22d | 1 | 1.24mi |
HOA detail condo
- Monthly dues
- $1,050 · $12,600/yr
- Likely covers
- security
- Assessments
- None detected in remarks — confirm with the listing agent.
Listing history 50 events
-
2026-06-18days on market $450,000 Active 36 DOM
-
2026-06-17days on market $450,000 Active 35 DOM
-
2026-06-16days on market $450,000 Active 34 DOM
-
2026-06-15days on market $450,000 Active 33 DOM
-
2026-06-13days on market $450,000 Active 31 DOM
-
2026-06-13days on market $450,000 Active 30 DOM
-
2026-06-09days on market $450,000 Active 27 DOM
-
2026-06-08days on market $450,000 Active 26 DOM
-
2026-06-07days on market $450,000 Active 25 DOM
-
2026-06-04days on market $450,000 Active 22 DOM
-
2026-06-03days on market $450,000 Active 21 DOM
-
2026-06-02days on market $450,000 Active 20 DOM
-
2026-06-01days on market $450,000 Active 19 DOM
-
2026-05-31days on market $450,000 Active 18 DOM
-
2026-05-13$450,000 Active 1825-char remark
-
2026-04-30historical
-
2026-03-26price $450,000
-
2026-03-02price $479,000
-
2025-11-12$490,000 Active
-
2025-11-09historical
-
2025-09-05price $505,000
-
2025-07-02price $535,000
-
2025-06-11price $550,000
-
2025-05-09$560,000 Active
-
2025-05-05historical
-
2025-03-11price $560,000
-
2025-01-06$585,000 Active
-
2025-01-01historical
-
2024-10-07$585,000 Active
-
2024-08-16historical
-
2024-05-24$649,000 Active
-
2024-05-23historical
-
2024-05-21historical
-
2024-02-17price $649,000
-
2024-02-17$459,000 Active
-
2023-05-30soldstatus $485,000 Closed
-
2023-05-30soldstatus $485,000
-
2023-04-05status Pending
-
2023-03-07$499,000 Active
-
2019-07-11soldstatus $310,000 Sold
-
2019-06-25status Pending
-
2019-06-01historical
-
2019-04-29historical Backup Offers Accepted
-
2018-11-19$329,500 Active
-
2018-11-19$329,500
-
2016-10-11soldstatus $300,000 Sold
-
2016-10-11soldstatus $300,000
-
2016-10-03status Pending
-
2016-08-29historical Contingent
-
2016-05-07$315,000 Active
ⓘ Source: listings_history table (triggers on properties + properties_extension) + one-shot
backfill from property_details.listing_events for pre-trigger history.
Tax reassessment forecast CA · Resets to sale price
- Current annual tax
- $6,146 · $512/mo
- Projected year-2 tax
- $6,146 · $512/mo
- Expected delta
- $0/yr ($0/mo · 0.0%)
ⓘ Screening estimate from a state-policy table — verify with the county assessor before closing.
Climate risk First Street
- Flood 1/10 Low FEMA zone X · 0% chance over 30 yrs
- Wildfire 5/10 Major
- Heat 9/10 Extreme 7 d/yr ≥110°F today · 22 d/yr by 30 yrs out
- Wind 1/10 Low
- Air quality 5/10 Major 6 unhealthy d/yr today · 8 by 30 yrs out
Nearby sold comps map
Loading sold comps map…
Walkable amenities ~0.75 mi
Loading nearby amenities…
Taxation est. · year 1
- Rental income
- $58,871
- − Mortgage interest
- −$25,207
- − Property taxes
- −$6,146
- − Insurance
- −$2,250
- − Repairs & maintenance
- −$4,710
- − Management
- −$4,710
- − HOA
- −$12,600
- − Depreciation
- −$13,091
- Taxable loss
- −$9,842
- Est. tax savings @ 24.0%
- +$2,362
- After-tax cash flow
- $-443/yr
For passive investors: Depreciation is non-cash, so a rental often shows a tax loss while cash-flowing — sheltering income. Rental losses are passive: they offset passive income freely, and up to $25,000/yr can offset ordinary (W-2) income if you actively participate and your MAGI is under $100k (phasing out to $0 by $150k); unused losses carry forward. On sale, claimed depreciation is recaptured at up to 25%, and gains may owe capital-gains tax (a 1031 exchange can defer both). Figures are a year-1 estimate at your 24.0% rate — not tax advice; consult a CPA.
Schools (NCES district)
- District
- Palm Springs Unified
- NCES district ID
- 0629550
- Math proficiency
- 21% ▼ -7.00%
- Reading proficiency
- 42% ▬ 0.00%
- Median HH income
- $43,638
- Composite
- 26.76/100
- National rank
- #7131
- State rank
- #328 of 517 in CA
Livability — Palm Springs
- Score
- 66/100
- State rank
- #348
- US rank
- #11850
Category grades
Schools grade is shown separately in the Schools card above.
Census & demographics
- Census place
- Palm Springs, CA
- County
- Riverside County · 2,287,001 people
- City population
- 46,786
- Metro
- Riverside-San Bernardino-Ontario, CA
- Population (ZIP)
- 19,899
- Household income
- $77,688
- Rent vs Own
- Severe rent burden
- 1215.0
Population outlook (Riverside County) Hauer SSP2
- Today (2025)
- 2,664,475 people
- By 2030
- 2,802,692 · +5.2%
- By 2040
- 3,050,904 · +14.5%
- By 2050
- 3,256,783 · +22.2%
- By 2075
- 3,655,058 · +37.2%
- By 2100
- 3,766,594 · +41.4%
Race, ethnicity, and origin ACS 2023
- Neighborhood character
- Predominantly White (68%)
- Race & ethnicity
- White 68% Hispanic / Latino 20% Two or more races 12% Asian 6% Black 2% Native American 1%
- Hispanic origin (detail)
- Mexican 16%
- Common ancestry
- Lithuanian 4% Romanian 3% Slovak 3%
- Foreign-born
- 16% · Canada, China, South Korea
- Languages at home
- 81% English-only · Spanish 13% Tagalog/Filipino 2% Other Asian/Pacific 1%
Political lean MEDSL · Riverside
- 2024 margin
- Toss-up / Even · D 48.0% · R 49.3% · Other 2.6%
- 2008→2024 swing
- -3.6pp toward R · 2008: 2.3pp · 2024: -1.3pp
- All cycles
- 2024: R+1.3 2020: D+8.0 2016: D+4.3 2012: R+0.4 2008: D+2.3
Not yet ingested
- Civics
- —
Market trends
- HPI YoY
- ▼ -489.04%
- Current HPI
- 357.0969
- Rent YoY
- ▼ -0.43%
- Metro
- Riverside-San Bernardino-Ontario, CA
- State GDP YoY
- ▲ 3.21%
- F500 in state
- 116
Industry mix (Fortune 500 HQ in CA)
| Industry | F500 HQs | Revenue |
|---|---|---|
| Technology | 27 | $1,492B |
|
||
| Financial Services | 3 | $174B |
|
||
| Retail | 3 | $44B |
|
||
| Insurance | 3 | $26B |
|
||
| Media / Entertainment | 2 | $115B |
|
||
| Pharmaceuticals / Biotech | 2 | $62B |
|
||
Price history
+500.0% since first listed42 events — show timeline
- 2026-05-13 Listed $450,000 CRMLS
- 2026-04-30 Listing Removed — CRMLS
- 2026-03-26 Price Changed $450,000 CRMLS
- 2026-03-02 Price Changed $479,000 CRMLS
- 2025-11-12 Listed $490,000 CRMLS
- 2025-11-09 Listing Removed — CRMLS
- 2025-09-05 Price Changed $505,000 CRMLS
- 2025-07-02 Price Changed $535,000 CRMLS
- 2025-06-11 Price Changed $550,000 CRMLS
- 2025-05-09 Listed $560,000 CRMLS
- 2025-05-05 Listing Removed — CRMLS
- 2025-03-11 Price Changed $560,000 CRMLS
- 2025-01-06 Listed $585,000 CRMLS
- 2025-01-01 Listing Removed — GPSMLS
- 2024-10-07 Listed $585,000 GPSMLS
- 2024-08-16 Listing Removed — GPSMLS
- 2024-05-24 Listed $649,000 GPSMLS
- 2024-05-23 Coming Soon — GPSMLS
- 2024-05-21 Listing Removed — GPSMLS
- 2024-02-17 Price Changed $649,000 GPSMLS
- 2024-02-17 Listed $459,000 GPSMLS
- 2023-05-30 Sold (Public Records) $485,000 Public Records
- 2023-05-30 Sold (MLS) $485,000 GPSMLS
- 2023-04-05 Pending — GPSMLS
- 2023-03-07 Listed $499,000 GPSMLS
- 2019-07-11 Sold (MLS) $310,000 GPSMLS
- 2019-06-25 Pending — GPSMLS
- 2019-06-01 Listing Removed — SDMLS
- 2019-04-29 Contingent — GPSMLS
- 2018-11-19 Listed $329,500 SDMLS
- 2018-11-19 Listed $329,500 GPSMLS
- 2016-10-11 Sold (Public Records) $300,000 Public Records
- 2016-10-11 Sold (MLS) $300,000 GPSMLS
- 2016-10-03 Pending — GPSMLS
- 2016-08-29 Contingent — GPSMLS
- 2016-05-07 Listed $315,000 GPSMLS
- 2001-04-03 Sold (Public Records) $200,000 Public Records
- 2001-04-03 Sold (MLS) $200,000 PALM
- 2001-02-15 Delisted — PALM
- 2001-01-17 Listed $219,000 PALM
- 2000-10-13 Sold (Public Records) $146,000 Public Records
- 1998-04-09 Sold (Public Records) $75,000 Public Records
Property tax history
+4.5%/yrLatest (2025): $6,146 · -2.5% YoY. Source: county tax records.
Cash-flow waterfall
monthlySold comps — $/sqft
last 12 mo · ≤1 miLoading sold comps…