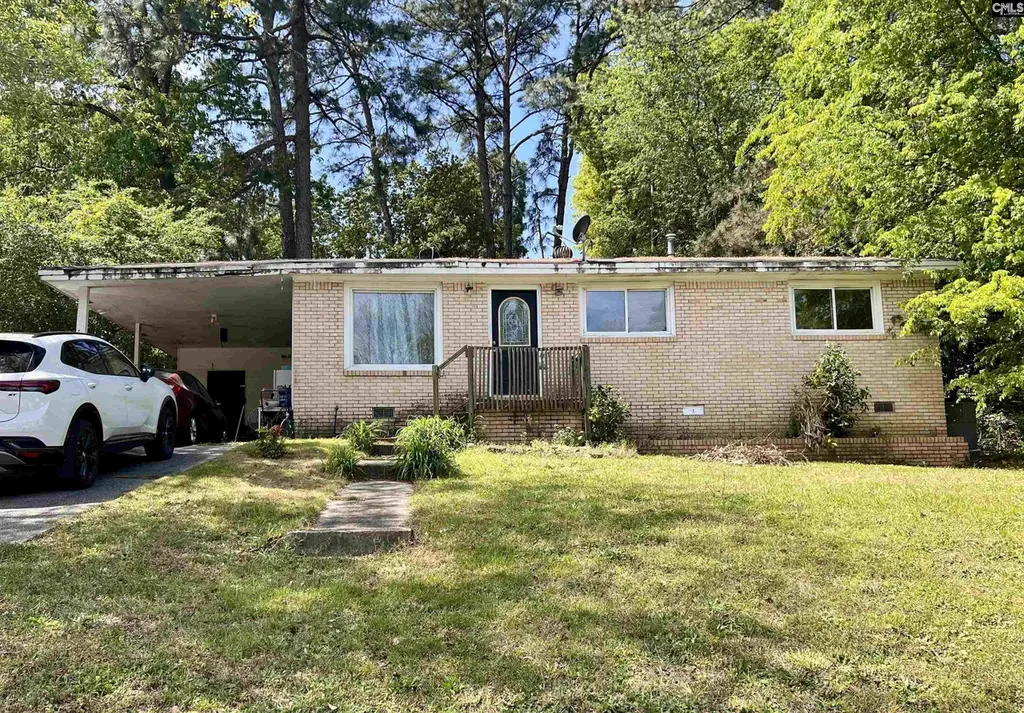
2529 Windsor Rd · Cayce, SC
Flood risk 1/10 · Minimal
- FEMA flood zone
- X (unshaded)
- Chance of flooding over 30 yrs
- 0.0%
- Est. flood insurance / yr
- $507 – $1,088
Fire risk 2/10 · Minimal
- Est. fire insurance / yr
- $783 – $1,453
Heat risk 7/10 · Major
- Hot days now (above 108°F)
- 7 days/yr
- Hot days in 30 yrs
- 16 days/yr
Wind risk 6/10 · Moderate
- Chance of severe wind over 30 yrs
- 68.0%
Air-quality risk 3/10 · Minor
- Unhealthy air days now
- 2 days/yr
- Unhealthy air days in 30 yrs
- 2 days/yr
Risk factors via First Street. Map © Google.
Why this score? — see what drove the C- grade
The composite is a weighted blend of 9 inputs, each scored 0–100. Each bar is that input's sub-score; the figure is the points it added to the 100-point composite (weight × sub-score).
- Cash flow +19.7/30.0
- ARV discount +7.5/15.0
- DSCR +6.3/10.0
- 1% rule +5.0/10.0
- Livability +3.6/5.0
- Rent growth +3.0/5.0
- Schools +2.9/10.0
- Condition / age +2.5/5.0
- Appreciation +0.0/10.0
$148,000
🖨 Deal sheet 📄 Offer letter ✓ Due diligence
Listing remarks
Investor Special in Cayce – Tenant-occupied, month-to-month, collecting $900/month with immediate cash flow. Located off Highway 26, just 15 minutes to downtown Columbia on a quiet street in Churchill Heights. Perfect for student housing, first-time buyers, or investors. With a little love, this home could easily rent for $1,600/month. Keep as is for income, renovate for market rent, or flip for profit. Disclaimer: CMLS has not reviewed and, therefore, does not endorse vendors who may appear in listings.
Key facts
- Quiet street
- 0.29 acre lot
- Garage
Tags
Property features AI
Exterior
- Parking: Attached carport; One garage space (part of parking); Two total parking spaces
- Utilities: Public water; Public sewer
- Home design: Single-story property
- Construction: Crawlspace foundation
- Exterior features: Partial brick above foundation; Chain link fencing at rear only; Paved road access
Interior
- Kitchen: Bay window; Formica countertops; Painted cabinets; Laminate flooring; Countertop microwave; Refrigerator; Free-standing smooth-surface range
- Bedrooms: Master bedroom on main level with ceiling fan, private closet, hardwood floors; Second bedroom on main level with ceiling fan, private closet, hardwood floors (shares bath); Third bedroom on main level with ceiling fan, private closet, hardwood floors (shares bath)
- Flooring: Hardwood floors in bedrooms and great room; Carpet in living room; Laminate in kitchen
- Bathrooms: One full bathroom; One half bathroom
- Heating & cooling: Gas pack heating; Gas pack cooling
- Interior features: Attic with pull-down access; French doors between living areas; Heated space mud room
- Laundry & utility: Washer/dryer area on main level; Mud room / heated laundry space
Neighborhood map
What this means for you Summary
Snapshot
- This is a 3-bed/1.5-bath single-family listed at $148k.
Deal economics
- At list price, monthly cash flow is $175 ($2k/yr) — positive.
- The deal already cash-flows at list — no discount required.
- To meet the 1% rule (rent ≥ 1% of price), the offer needs to be $147k (0.5% below list).
- Recommended offer: $144k (3.0% below list) — sets the bar for market timing.
Location & tenants
- Location reads 71/100 on livability (#55 in SC) — a middle-class / working-renter tenant base. Strengths: cost of living A+, housing A+, health & safety A+; Watch: employment D+, crime F, commute F.
- Lexington 02 (suburban): math 30% / reading 38% proficiency, ranked #45 of 80 in SC (top 56%) — families likely to look elsewhere, expect single-tenant / working-renter base with shorter leases.
- Zoned schools: Springdale Elementary (math 62% / reading 52%, grade C+, #102 of 597 statewide, top 18%, 389 students, 65% FRL); Airport High (math 40% / reading 79%, grade C+, #110 of 196 statewide, top 58%, 1,428 students, 84% FRL) — zoned schools average 75% FRL vs 59% district-wide (16 pts higher); higher-poverty schools than district average — tighter screening recommended.
- Zoned-school proficiency averages 58% at this address vs 34% district-wide (+24 pts) — the actual schools serving this property are materially stronger than the Lexington 02 average implies; a family-tenant draw the district grade alone would hide.
- Market conditions: Rents rising (+2.0%/yr); 76 active listings in the ZIP; 9 comparable units currently listed for rent nearby; rentals at typical pace (median 22d on market — plan ~3-4 weeks tenant-placement turnaround); 1,712 units permitted in Lexington County in 2024 (0 in 5+ unit buildings).
Forward outlook
- Local home prices are declining (-3.0%/yr); year-one equity from $1k of loan paydown is wiped out by about $4k of value loss. Plan a longer hold.
- Lexington County population projected at +26% by 2050 — long-run rental-demand tailwind backs the buy-and-hold thesis.
Negotiation context
- It's been on market 41 days — a 3% lower offer ($144k) is reasonable based on typical stale-listing flexibility.
- Current owner paid $38k; list at $148k implies a 289% gain — meaningful room to come down on a strong offer.
Risks & watch-outs
- Climate carrying-cost: major wind risk, 68% chance of damaging wind over 30y; extreme-heat days projected 7→16/yr by 2055 (HVAC capex compounding) — expect insurance premiums to compound above CPI over the hold.
Questions for the listing agent
- It's been on market 41 days. Have you received any prior offers? Is the seller open to a 3% concession, seller financing, or rate buy-down credit?
- Built in 1960 — when were the roof, HVAC, electrical panel, plumbing, and water heater last replaced?
- Is there a deadline driving the sale (1031 exchange, divorce, estate, relocation)? That informs how much negotiation room exists.
- Schools are D-rated, which usually means shorter tenancies and higher turnover. Who's the typical renter profile here, and what's been the actual vacancy rate?
- Crime grade is F in this area — have there been break-ins, vandalism, or insurance claims at this property in the last 3 years? What carrier currently insures it and at what premium?
- What's the average days-on-market for RENTAL listings here right now (not sales)? A rising rental-DOM trend means longer vacancies and softer asking-rent achievability than the comps imply.
- What's the recent tenant-quality profile in this submarket — average credit score on applications, eviction rate, late-payment / NSF rate, and stable-employment percentage? A property-management company in the area should have these aggregated.
- How much new for-sale + rental construction is in the pipeline within 1–3 miles? Heavy new supply typically softens prices + rents 12–24 months out; constrained supply supports both.
Investment metrics
- 1% rule
- 1.00% ✗
- Cap rate
- 7.71%
- Cash-on-cash
- 5.06%
- DSCR
- 1.23
- GRM
- 8.4
CMA / ARV
No comps found within radius.
Projected returns pro-forma
-3.0% appreciation · 2.04% rent growth · sell at horizon
- IRR
- -9.5%
- Equity multiple
- 0.66×
- Total profit
- $-14,264
- Equity at exit
- $22,067
- IRR
- -1.4%
- Equity multiple
- 0.91×
- Total profit
- $-3,760
- Equity at exit
- $12,796
Cash invested: $41,440 (down + closing). Projections, not guarantees.
Landlord ↔ Tenant lean methodology
- Overall (STATE)
- 90 Strongly Landlord-Friendly
- State South Carolina
- 90 Strongly Landlord-Friendly · R+6
- County
- — inherits STATE
- City
- — inherits STATE
ZIP-level market 29033
- Home prices YoY
- -12.2%
- Rents YoY
- 2.0%
- Active inventory
- 76
- Price-to-rent
- 8.4×
Monthly cashflow live
- Estimated rent
- $1,473 high interval (Pro) →
- Mortgage (P&I)
- −$776
- Tax from tax record
- −$151 /mo · $1,817/yr
- Insurance
- −$62
- HOA
- −$0
- Vacancy / Maint / Mgmt
- −$309
- Net cashflow
- $175
Break-even live
UW: 25.0% down · 7.5% · 30yr · 1.5% tax · 5.0% vac · 8.0% maint · 8.0% mgmt
Financing live
Cash to close
- Down payment
- $37,000
- Closing costs
- $4,440
- Reserves months
- —
- Total cash needed
- —
Loan-product check · same deal, 3 products live
Conventional
25% down · 7.5% · 30yr
- Down + closing
- —
- Monthly P&I
- —
- Monthly cashflow
- —
- DSCR
- —
- Eligible?
- —
Personal DTI + credit; lowest rate.
DSCR
20% down · 8.5% · 30yr
- Down + closing
- —
- Monthly P&I
- —
- Monthly cashflow
- —
- DSCR
- —
- Eligible?
- —
No personal income docs; deal must DSCR.
Hard money
10% down · 12.0% · 12mo
- Down + closing
- —
- Monthly P&I
- —
- Monthly cashflow
- —
- DSCR
- —
- Eligible?
- —
Short-term bridge; refi at stabilization.
Rent comps 9 comps
| Address | Beds | Baths | Sqft | Rent | $/sqft | DOM | Units | Dist |
|---|---|---|---|---|---|---|---|---|
| 605 Picadilly Sq Cayce, SC | 2.0 | 1.5 | 1100 | $1,275 | $1.16 | 21d | 1 | 0.14mi |
| 602 Picadilly Sq Cayce, SC | 2.0 | 1.5 | 1100 | $1,250 | $1.14 | 2d | 1 | 0.15mi |
| 7 Londonderry Sq Cayce, SC | 2.0 | 1.5 | 833 | $1,150 | $1.38 | 23d | 1 | 0.19mi |
| 2805 Shadblow Ln West Columbia, SC | 1.0–3.0 | 1.0–2.0 | 965 | $1,510 | $1.56 | 2d | 27 | 0.85mi |
| 1206 N Eden Dr Cayce, SC | 1.0–3.0 | 1.0–2.0 | 950 | $1,720 | $1.81 | 2d | 8 | 1.09mi |
| 1642 Oak St Cayce, SC | 2.0 | 1.0 | 1000 | $1,245 | $1.25 | 23d | 1 | 1.31mi |
| 1726 Smith Dr West Columbia, SC | 3.0 | 2.0 | 1182 | $1,595 | $1.35 | 11d | 1 | 1.33mi |
| 944 Glenn St West Columbia, SC | 2.0 | 1.0 | 960 | $1,150 | $1.20 | 23d | 1 | 1.37mi |
| 944 Glenn St Unit c3 West Columbia, SC | 2.0 | 1.5 | 1200 | $1,150 | $0.96 | 21d | 1 | 1.37mi |
Listing history 7 events
-
2026-05-21status Pending
-
2026-05-08price $148,000
-
2026-04-22price $158,000
-
2026-04-10$170,000 Active
-
2002-04-29soldstatus $38,000
-
2002-03-18soldstatus $30,000
-
1987-12-01soldstatus $41,200
ⓘ Source: listings_history table (triggers on properties + properties_extension) + one-shot
backfill from property_details.listing_events for pre-trigger history.
Tax reassessment forecast SC · Resets to sale price
- Current annual tax
- $1,817 · $151/mo
- Projected year-2 tax
- $1,817 · $151/mo
- Expected delta
- $0/yr ($0/mo · 0.0%)
ⓘ Screening estimate from a state-policy table — verify with the county assessor before closing.
Climate risk First Street
- Flood 1/10 Low FEMA zone X (unshaded) · 0% chance over 30 yrs
- Wildfire 2/10 Low
- Heat 7/10 Severe 7 d/yr ≥108°F today · 16 d/yr by 30 yrs out
- Wind 6/10 Major 68% chance of damaging wind over 30 yrs
- Air quality 3/10 Moderate 2 unhealthy d/yr today · 2 by 30 yrs out
Nearby sold comps map
Loading sold comps map…
Walkable amenities ~0.75 mi
Loading nearby amenities…
Taxation est. · year 1
- Rental income
- $17,679
- − Mortgage interest
- −$8,290
- − Property taxes
- −$1,817
- − Insurance
- −$740
- − Repairs & maintenance
- −$1,414
- − Management
- −$1,414
- − Depreciation
- −$4,305
- Taxable loss
- −$302
- Est. tax savings @ 24.0%
- +$72
- After-tax cash flow
- $2,169/yr
For passive investors: Depreciation is non-cash, so a rental often shows a tax loss while cash-flowing — sheltering income. Rental losses are passive: they offset passive income freely, and up to $25,000/yr can offset ordinary (W-2) income if you actively participate and your MAGI is under $100k (phasing out to $0 by $150k); unused losses carry forward. On sale, claimed depreciation is recaptured at up to 25%, and gains may owe capital-gains tax (a 1031 exchange can defer both). Figures are a year-1 estimate at your 24.0% rate — not tax advice; consult a CPA.
Schools (NCES district)
- District
- Lexington 02
- NCES district ID
- 4502730
- Math proficiency
- 30% ▼ -6.00%
- Reading proficiency
- 38% ▬ 0.00%
- Median HH income
- $42,532
- Composite
- 28.78/100
- National rank
- #6669
- State rank
- #45 of 80 in SC
Livability — Cayce
- Score
- 71/100
- State rank
- #55
- US rank
- #7173
Category grades
Schools grade is shown separately in the Schools card above.
Census & demographics
- Census place
- Cayce, SC
- County
- Lexington County · 232,571 people
- City population
- 12,837
- Metro
- Columbia, SC
- Population (ZIP)
- 12,837
- Household income
- $61,237
- Rent vs Own
- Severe rent burden
- 425.0
Population outlook (Lexington County) Hauer SSP2
- Today (2025)
- 322,999 people
- By 2030
- 342,356 · +6.0%
- By 2040
- 377,715 · +16.9%
- By 2050
- 406,984 · +26.0%
- By 2075
- 465,447 · +44.1%
- By 2100
- 485,674 · +50.4%
Race, ethnicity, and origin ACS 2023
- Neighborhood character
- Diverse neighborhood (Simpson 0.59)
- Race & ethnicity
- White 57% Black 28% Hispanic / Latino 10% Two or more races 9% Asian 3%
- Hispanic origin (detail)
- Mexican 4%
- Common ancestry
- Serbian 3% Iranian 2% Italian 2%
- Foreign-born
- 6% · Canada, China, South Korea
- Languages at home
- 91% English-only · Spanish 6% Other Indo-European 1%
Political lean MEDSL · Lexington
- 2024 margin
- Solid R (+33.5) · D 32.5% · R 66.0% · Other 1.4%
- 2008→2024 swing
- +4.6pp toward D · 2008: -38.0pp · 2024: -33.5pp
- All cycles
- 2024: R+33.5 2020: R+30.1 2016: R+36.7 2012: R+37.8 2008: R+38.0
Not yet ingested
- Civics
- —
Market trends
- HPI YoY
- ▼ -39.93%
- Current HPI
- 288.7749
- Rent YoY
- ▲ 2.04%
- Metro
- Columbia, SC
- State GDP YoY
- ▲ 4.51%
- F500 in state
- 2
Industry mix (Fortune 500 HQ in SC)
| Industry | F500 HQs | Revenue |
|---|---|---|
| Packaging | 1 | $7B |
|
||
Price history
+259.2% since first listed7 events — show timeline
- 2026-05-21 Pending — Consolidated MLS
- 2026-05-08 Price Changed $148,000 Consolidated MLS
- 2026-04-22 Price Changed $158,000 Consolidated MLS
- 2026-04-10 Listed $170,000 Consolidated MLS
- 2002-04-29 Sold (Public Records) $38,000 Public Records
- 2002-03-18 Sold (Public Records) $30,000 Public Records
- 1987-12-01 Sold (Public Records) $41,200 Public Records
Property tax history
+1.3%/yrLatest (2024): $1,817 · +7.9% YoY. Source: county tax records.
Cash-flow waterfall
monthlySold comps — $/sqft
last 12 mo · ≤1 miLoading sold comps…