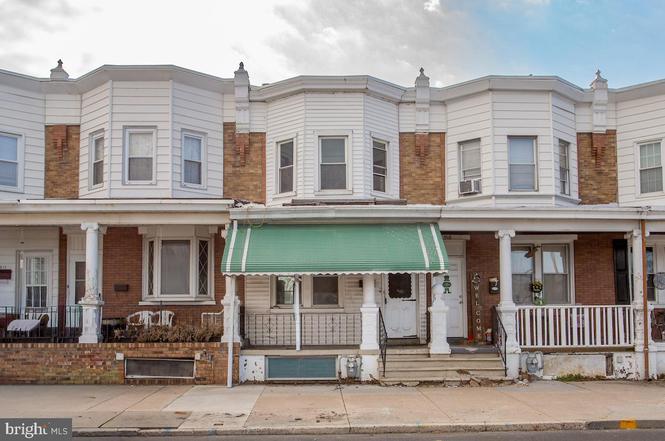
916 Jefferson Ave · Bristol, PA
Flood risk 1/10 · Minimal
- FEMA flood zone
- X (unshaded)
- Chance of flooding over 30 yrs
- 0.0%
- Est. flood insurance / yr
- $473 – $860
Fire risk 1/10 · Minimal
- Est. fire insurance / yr
- $511 – $949
Heat risk 7/10 · Major
- Hot days now (above 104°F)
- 7 days/yr
- Hot days in 30 yrs
- 15 days/yr
Wind risk 6/10 · Moderate
- Chance of severe wind over 30 yrs
- 27.0%
Air-quality risk 5/10 · Moderate
- Unhealthy air days now
- 6 days/yr
- Unhealthy air days in 30 yrs
- 8 days/yr
Risk factors via First Street. Map © Google.
Why this score? — see what drove the C- grade
The composite is a weighted blend of 9 inputs, each scored 0–100. Each bar is that input's sub-score; the figure is the points it added to the 100-point composite (weight × sub-score).
- Cash flow +16.0/30.0
- ARV discount +15.0/15.0
- DSCR +4.9/10.0
- 1% rule +4.5/10.0
- Livability +3.7/5.0
- Schools +2.7/10.0
- Rent growth +2.5/5.0
- Condition / age +2.5/5.0
- Appreciation +0.0/10.0
$250,000
🖨 Deal sheet 📄 Offer letter ✓ Due diligence
Listing remarks
Welcome to 916 Jefferson Avenue, ideally positioned directly across from the neighborhood baseball field in Bristol Borough. This interior row home offers a spacious main living area with high ceilings that create an open, airy atmosphere throughout. Just off the kitchen, you’ll find a bright sunroom—perfect for additional storage. The home also features a one-car rear garage, providing convenient off-street parking. The generously sized primary bedroom is filled with natural light, offering a comfortable and inviting retreat. Located in the heart of charming Bucks County, this property offers exceptional value at $250,000. With a few minor repairs, this home can be move-in read
Key facts
- Garage
- Built 1918
- Listed 42 days
Neighborhood map
What this means for you Summary
Snapshot
- This is a 3-bed/1.0-bath townhouse listed at $250k.
Deal economics
- At list price, monthly cash flow is $124 ($1k/yr) — positive.
- The deal already cash-flows at list — no discount required.
- To meet the 1% rule (rent ≥ 1% of price), the offer needs to be $238k (4.6% below list).
- Recommended offer: $238k (4.6% below list) — sets the bar for 1% rule.
- Cap rate 6.9% vs local median 3.4% in Bristol — top-decile yield for the area; either an underpriced asset or a hidden risk that comps aren't pricing in. Stress-test before assuming the spread holds.
Location & tenants
- Location reads 73/100 on livability (#546 in PA) — a middle-class / working-renter tenant base. Strengths: crime A+, cost of living A+, housing A+; Watch: commute C-, amenities F, health & safety F.
- Bristol Borough SD (suburban): math 24% / reading 40% proficiency, ranked #435 of 539 in PA (top 81%) — families likely to look elsewhere, expect single-tenant / working-renter base with shorter leases.
- Market conditions: 133 active listings in the ZIP; 6 comparable units currently listed for rent nearby; rentals leasing fast (median 6d on market — plan ~1-2 weeks tenant-placement turnaround); 663 units permitted in Bucks County in 2024 (106 in 5+ unit buildings).
- This rent runs 44% of the median local income ($66k/yr) — at the standard rent-burdened threshold; future hikes will face affordability resistance.
Forward outlook
- Local home prices are declining (-3.0%/yr); year-one equity from $2k of loan paydown is wiped out by about $8k of value loss. Plan a longer hold.
- Bucks County population projected to shrink 7% by 2050 — rents likely to lag national; underwrite the cash flow, not the appreciation.
Negotiation context
- It's been on market 42 days — a 3% lower offer ($242k) is reasonable based on typical stale-listing flexibility.
- Current owner paid $85k; list at $250k implies a 194% gain — meaningful room to come down on a strong offer.
Risks & watch-outs
- Watch-outs: built in 1918 — expect roof / HVAC / electrical / plumbing capex.
- Climate carrying-cost: major wind risk, 27% chance of damaging wind over 30y; extreme-heat days projected 7→15/yr by 2055 (HVAC capex compounding) — expect insurance premiums to compound above CPI over the hold.
Questions for the listing agent
- It's been on market 42 days. Have you received any prior offers? Is the seller open to a 5% concession, seller financing, or rate buy-down credit?
- Built in 1918 — when were the roof, HVAC, electrical panel, plumbing, and water heater last replaced?
- Is there a deadline driving the sale (1031 exchange, divorce, estate, relocation)? That informs how much negotiation room exists.
- What's the average days-on-market for RENTAL listings here right now (not sales)? A rising rental-DOM trend means longer vacancies and softer asking-rent achievability than the comps imply.
- What's the recent tenant-quality profile in this submarket — average credit score on applications, eviction rate, late-payment / NSF rate, and stable-employment percentage? A property-management company in the area should have these aggregated.
- How much new for-sale + rental construction is in the pipeline within 1–3 miles? Heavy new supply typically softens prices + rents 12–24 months out; constrained supply supports both.
Investment metrics
- 1% rule
- 0.95% ✗
- Cap rate
- 6.89%
- Cash-on-cash
- 2.12%
- DSCR
- 1.09
- GRM
- 8.7
CMA / ARV
- ARV (on-the-fly)
- $307,824
- Comps found
- 12
Show comp detail 12 sales within ~0.75 mi
| Address | Dist | Beds/Ba | Sqft | Sold | Price | $/sf | Match |
|---|---|---|---|---|---|---|---|
| 912 Jefferson Ave | 0.01mi | 3/2.0 | 1,272 (0%) | 4mo | $279,500 | $220 | 92 |
| 1506 Trenton Ave | 0.33mi | 3/1.5 | 1,283 (+1%) | 5mo | $310,000 | $242 | 77 |
| 261 Monroe St | 0.45mi | 3/1.0 | 1,275 (+0%) | 4mo | $325,000 | $255 | 75 |
| 635 Spruce St | 0.49mi | 3/1.0 | 1,290 (+1%) | 3mo | $260,500 | $202 | 72 |
| 702 Corson St | 0.37mi | 3/1.0 | 1,337 (+5%) | 2mo | $329,800 | $247 | 72 |
| 213 New Brook St | 0.58mi | 3/1.5 | 1,274 (+0%) | 3mo | $340,000 | $267 | 68 |
| 243 Monroe St | 0.48mi | 3/1.5 | 1,317 (+4%) | 3mo | $310,000 | $235 | 68 |
| 418 Jefferson Ave #9 | 0.38mi | 3/2.0 | 1,365 (+7%) | 2mo | $379,000 | $278 | 65 |
| 323 Wilson St | 0.69mi | 3/1.0 | 1,304 (+2%) | 3mo | $315,000 | $242 | 61 |
| 418 Jefferson Ave #4 | 0.38mi | 2/2.0 (-1) | 1,372 (+8%) | 3mo | $375,000 | $273 | 58 |
| 426 Logan St | 0.38mi | 2/1.0 (-1) | 1,128 (-11%) | 5mo | $180,000 | $160 | 54 |
| 348 Jefferson Ave | 0.43mi | 4/1.0 (+1) | 1,404 (+10%) | 4mo | $300,000 | $214 | 54 |
Match score weights: distance 35% · size 25% · config 20% · recency 20%. Top-matched comps best support the ARV.
Projected returns pro-forma
-3.0% appreciation · 3.0% rent growth · sell at horizon
- IRR
- -12.9%
- Equity multiple
- 0.53×
- Total profit
- $-32,562
- Equity at exit
- $37,276
- IRR
- -3.9%
- Equity multiple
- 0.74×
- Total profit
- $-17,965
- Equity at exit
- $21,615
Cash invested: $70,000 (down + closing). Projections, not guarantees.
Landlord ↔ Tenant lean methodology
- Overall (STATE)
- 62 Landlord-Friendly
- State Pennsylvania
- 62 Landlord-Friendly · EVEN
- County
- — inherits STATE
- City
- — inherits STATE
ZIP-level market 19007
- Active inventory
- 133
- Price-to-rent
- 8.7×
Monthly cashflow live
- Estimated rent
- $2,385 high interval (Pro) →
- Mortgage (P&I)
- −$1,311
- Tax from tax record
- −$345 /mo · $4,137/yr
- Insurance
- −$104
- HOA
- −$0
- Vacancy / Maint / Mgmt
- −$501
- Net cashflow
- $124
Break-even live
UW: 25.0% down · 7.5% · 30yr · 1.5% tax · 5.0% vac · 8.0% maint · 8.0% mgmt
Financing live
Cash to close
- Down payment
- $62,500
- Closing costs
- $7,500
- Reserves months
- —
- Total cash needed
- —
Loan-product check · same deal, 3 products live
Conventional
25% down · 7.5% · 30yr
- Down + closing
- —
- Monthly P&I
- —
- Monthly cashflow
- —
- DSCR
- —
- Eligible?
- —
Personal DTI + credit; lowest rate.
DSCR
20% down · 8.5% · 30yr
- Down + closing
- —
- Monthly P&I
- —
- Monthly cashflow
- —
- DSCR
- —
- Eligible?
- —
No personal income docs; deal must DSCR.
Hard money
10% down · 12.0% · 12mo
- Down + closing
- —
- Monthly P&I
- —
- Monthly cashflow
- —
- DSCR
- —
- Eligible?
- —
Short-term bridge; refi at stabilization.
Rent comps 6 comps
| Address | Beds | Baths | Sqft | Rent | $/sqft | DOM | Units | Dist |
|---|---|---|---|---|---|---|---|---|
| 269 Monroe St Bristol, PA | 2.0 | 1.0 | 900 | $2,600 | $2.89 | 1d | 1 | 0.45mi |
| 234 Franklin St Unit 1st Floor Bristol, PA | 3.0 | 1.0 | 1000 | $2,000 | $2.00 | 5d | 1 | 0.60mi |
| 1416 Ashby Ave Bristol, PA | 3.0 | 1.0 | 1050 | $2,300 | $2.19 | 1d | 1 | 0.67mi |
| 115 Cedar St Unit 2 Bristol, PA | 3.0 | 1.0 | 1700 | $2,600 | $1.53 | 1d | 1 | 0.81mi |
| 523 Locust St Bristol, PA | 3.0 | 1.0 | 1148 | $1,925 | $1.68 | 24d | 1 | 0.86mi |
| 5634 Mitchell Rd Levittown, PA | 2.0 | 1.0 | 960 | $2,150 | $2.24 | 18d | 1 | 1.35mi |
Listing history 5 events
-
2026-04-14status Pending
-
2026-03-04$250,000 Active
-
2026-02-26historical $250,000
-
2001-10-01soldstatus $85,000
-
1998-09-08soldstatus $70,000
ⓘ Source: listings_history table (triggers on properties + properties_extension) + one-shot
backfill from property_details.listing_events for pre-trigger history.
Tax reassessment forecast PA · Partial reset (capped growth)
- Current annual tax
- $4,137 · $345/mo
- Projected year-2 tax
- $4,137 · $345/mo
- Expected delta
- $0/yr ($0/mo · 0.0%)
ⓘ Screening estimate from a state-policy table — verify with the county assessor before closing.
Climate risk First Street
- Flood 1/10 Low FEMA zone X (unshaded) · 0% chance over 30 yrs
- Wildfire 1/10 Low
- Heat 7/10 Severe 7 d/yr ≥104°F today · 15 d/yr by 30 yrs out
- Wind 6/10 Major 27% chance of damaging wind over 30 yrs
- Air quality 5/10 Major 6 unhealthy d/yr today · 8 by 30 yrs out
Nearby sold comps map
Loading sold comps map…
Walkable amenities ~0.75 mi
Loading nearby amenities…
Taxation est. · year 1
- Rental income
- $28,615
- − Mortgage interest
- −$14,004
- − Property taxes
- −$4,137
- − Insurance
- −$1,250
- − Repairs & maintenance
- −$2,289
- − Management
- −$2,289
- − Depreciation
- −$7,273
- Taxable loss
- −$2,626
- Est. tax savings @ 24.0%
- +$630
- After-tax cash flow
- $2,117/yr
For passive investors: Depreciation is non-cash, so a rental often shows a tax loss while cash-flowing — sheltering income. Rental losses are passive: they offset passive income freely, and up to $25,000/yr can offset ordinary (W-2) income if you actively participate and your MAGI is under $100k (phasing out to $0 by $150k); unused losses carry forward. On sale, claimed depreciation is recaptured at up to 25%, and gains may owe capital-gains tax (a 1031 exchange can defer both). Figures are a year-1 estimate at your 24.0% rate — not tax advice; consult a CPA.
Schools (NCES district)
- District
- Bristol Borough SD
- NCES district ID
- 4204200
- Math proficiency
- 24% ▼ -13.00%
- Reading proficiency
- 40% ▼ -13.00%
- Median HH income
- $46,340
- Composite
- 27.45/100
- National rank
- #6963
- State rank
- #435 of 539 in PA
Livability — Bristol
- Score
- 73/100
- State rank
- #546
- US rank
- #5093
Category grades
Schools grade is shown separately in the Schools card above.
Census & demographics
- Census place
- Bristol, PA
- County
- Bucks County · 506,477 people
- City population
- 21,800
- Metro
- Philadelphia-Camden-Wilmington, PA-NJ-DE-MD
- Population (ZIP)
- 21,800
- Household income
- $65,511
- Rent vs Own
- Severe rent burden
- 808.0
Population outlook (Bucks County) Hauer SSP2
- Today (2025)
- 630,973 people
- By 2030
- 627,093 · -0.6%
- By 2040
- 609,680 · -3.4%
- By 2050
- 584,225 · -7.4%
- By 2075
- 539,840 · -14.4%
- By 2100
- 483,970 · -23.3%
Race, ethnicity, and origin ACS 2023
- Neighborhood character
- Diverse neighborhood (Simpson 0.59)
- Race & ethnicity
- White 60% Hispanic / Latino 14% Black 14% Two or more races 9% Asian 3%
- Hispanic origin (detail)
- Mexican 3% Puerto Rican 7% Dominican 2%
- Common ancestry
- Romanian 6% Swiss 1% Subsaharan African 1%
- Foreign-born
- 12% · Canada, South Korea
- Languages at home
- 84% English-only · Spanish 10% Other Indo-European 4% Russian/Polish/Slavic 1%
Political lean MEDSL · Bucks
- 2024 margin
- Toss-up / Even · D 49.5% · R 49.5%
- 2008→2024 swing
- -8.7pp toward R · 2008: 8.7pp · 2024: -0.1pp
- All cycles
- 2024: R+0.1 2020: D+4.4 2016: D+0.6 2012: D+1.2 2008: D+8.7
Not yet ingested
- Civics
- —
Market trends
- HPI YoY
- ▼ -190.79%
- Current HPI
- 307.0709
- Rent YoY
- —
- Metro
- Philadelphia-Camden-Wilmington, PA-NJ-DE-MD
- State GDP YoY
- ▲ 1.68%
- F500 in state
- 34
Industry mix (Fortune 500 HQ in PA)
| Industry | F500 HQs | Revenue |
|---|---|---|
| Healthcare | 2 | $309B |
|
||
| Insurance | 2 | $27B |
|
||
| Telecommunications / Media | 1 | $124B |
|
||
| Industrial Distribution | 1 | $22B |
|
||
| Financial Services | 1 | $20B |
|
||
| Chemicals / Materials | 1 | $18B |
|
||
Price history
+257.1% since first listed5 events — show timeline
- 2026-04-14 Pending — BRIGHT MLS
- 2026-03-04 Listed $250,000 BRIGHT MLS
- 2026-02-26 Coming Soon $250,000 BRIGHT MLS
- 2001-10-01 Sold (Public Records) $85,000 Public Records
- 1998-09-08 Sold (Public Records) $70,000 Public Records
Property tax history
+0.7%/yrLatest (2026): $4,137 · +0.9% YoY. Source: county tax records.
Cash-flow waterfall
monthlySold comps — $/sqft
last 12 mo · ≤1 miLoading sold comps…