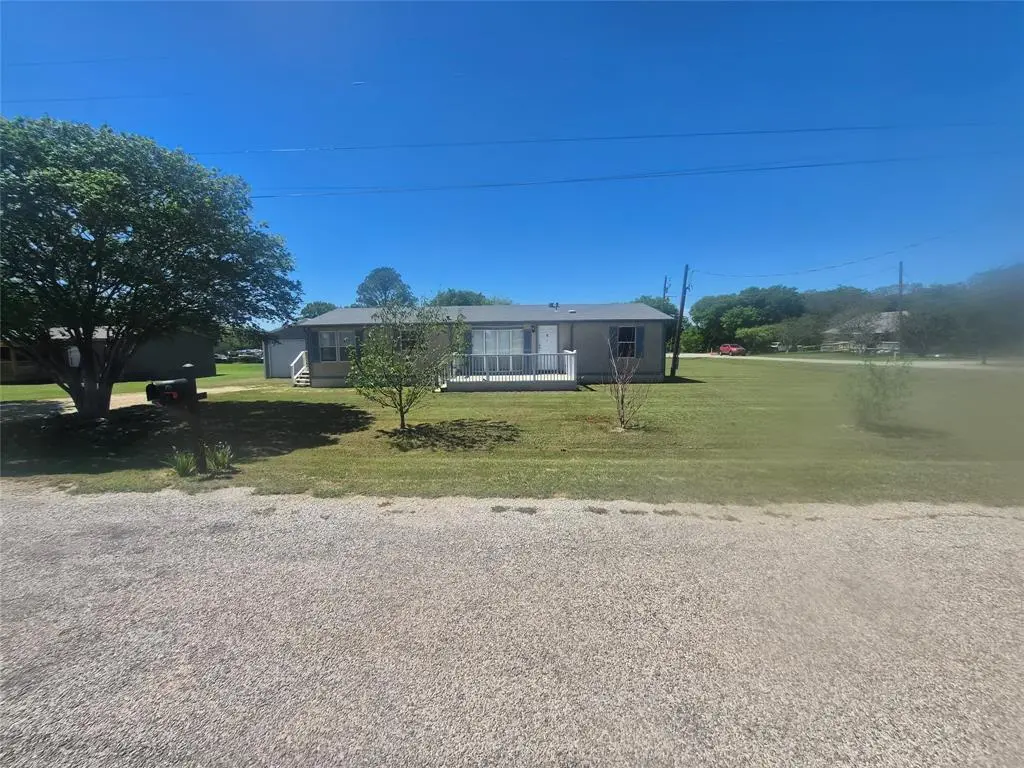
428 Penny Ct · Granbury, TX
Flood risk 1/10 · Minimal
- FEMA flood zone
- X (unshaded)
- Chance of flooding over 30 yrs
- 0.0%
- Est. flood insurance / yr
- $507 – $1,088
Fire risk 6/10 · Moderate
- Est. fire insurance / yr
- $1,222 – $2,270
Heat risk 7/10 · Major
- Hot days now (above 108°F)
- 7 days/yr
- Hot days in 30 yrs
- 23 days/yr
Wind risk 6/10 · Moderate
- Chance of severe wind over 30 yrs
- 27.0%
Air-quality risk 2/10 · Minimal
- Unhealthy air days now
- 1 days/yr
- Unhealthy air days in 30 yrs
- 2 days/yr
Risk factors via First Street. Map © Google.
Why this score? — see what drove the B+ grade
The composite is a weighted blend of 9 inputs, each scored 0–100. Each bar is that input's sub-score; the figure is the points it added to the 100-point composite (weight × sub-score).
- Cash flow +30.0/30.0
- ARV discount +15.0/15.0
- DSCR +10.0/10.0
- 1% rule +8.2/10.0
- Schools +4.0/10.0
- Rent growth +3.8/5.0
- Livability +3.3/5.0
- Condition / age +2.5/5.0
- Appreciation +0.0/10.0
$149,000
🖨 Deal sheet 📄 Offer letter ✓ Due diligence
Listing remarks MLS
Cute and bright 3 bedroom 2 bath home on almost half an acre in Granbury, on a quiet cul-de sac. Oversized living room, cheerful and roomy eat-in kitchen with laundry area. All bedrooms have walk in closets. Master bath has double sinks, soaking tub and shower. Garage (Workshop) is wired with electricity and have upgraded LED lighting. No showings until Open House on Sunday, May 1st 12-4pm.
Key facts
- Spacious yard
- Private bath
- Canyon creek area
Tags
Neighborhood map
What this means for you Summary
Snapshot
- This is a 3-bed/2.0-bath manufactured listed at $149k.
Deal economics
- At list price, monthly cash flow is $576 ($7k/yr) — positive.
- The deal already cash-flows at list — no discount required.
- Meets the 1% rule at list price ($2k rent vs $149k).
- Cap rate 10.9% vs local median 3.8% in Granbury — top-decile yield for the area; either an underpriced asset or a hidden risk that comps aren't pricing in. Stress-test before assuming the spread holds.
Location & tenants
- Location reads 66/100 on livability (#628 in TX) — a middle-class / working-renter tenant base. Strengths: cost of living A+, housing A+, health & safety A+; Watch: employment C-, crime D+, amenities F.
- Granbury ISD (town): math 46% / reading 46% proficiency, ranked #237 of 826 in TX (top 29%) — families likely to look elsewhere, expect single-tenant / working-renter base with shorter leases.
- Zoned schools: Acton El (math 52% / reading 46%, grade D, #926 of 4,322 statewide, top 22%, 814 students, 48% FRL).
- Market conditions: Rents rising fast (+5.2%/yr); 690 active listings in the ZIP; 15 comparable units currently listed for rent nearby; rentals at typical pace (median 24d on market — plan ~3-4 weeks tenant-placement turnaround); 47% of comp listings sitting > 30 days — soft ceiling on asking rent; solid renter incomes; 125 units permitted in Hood County in 2024 (0 in 5+ unit buildings).
Forward outlook
- Local home prices are declining (-3.0%/yr); year-one equity from $1k of loan paydown is wiped out by about $4k of value loss. Plan a longer hold.
- Hood County population projected at +29% by 2050 — long-run rental-demand tailwind backs the buy-and-hold thesis.
- At projected returns (-3.0% appreciation + 5.2% rent growth), your $42k cash investment doubles in ~7 years — after that, you're playing with house money.
Negotiation context
- Only 7 days on market — expect competitive offers; lowballing is unlikely to land.
- 4 sale attempts since 6y ago with the ask held roughly flat each time — persistent listings suggest the price (not the market) is what's stuck; bring a comps-based counter.
Risks & watch-outs
- Climate carrying-cost: major wind risk, 27% chance of damaging wind over 30y; major wildfire risk; extreme-heat days projected 7→23/yr by 2055 (HVAC capex compounding) — expect insurance premiums to compound above CPI over the hold.
Questions for the listing agent
- Is there a deadline driving the sale (1031 exchange, divorce, estate, relocation)? That informs how much negotiation room exists.
- Schools are D-rated, which usually means shorter tenancies and higher turnover. Who's the typical renter profile here, and what's been the actual vacancy rate?
- Crime grade is D in this area — have there been break-ins, vandalism, or insurance claims at this property in the last 3 years? What carrier currently insures it and at what premium?
- What's the average days-on-market for RENTAL listings here right now (not sales)? A rising rental-DOM trend means longer vacancies and softer asking-rent achievability than the comps imply.
- What's the recent tenant-quality profile in this submarket — average credit score on applications, eviction rate, late-payment / NSF rate, and stable-employment percentage? A property-management company in the area should have these aggregated.
- How much new for-sale + rental construction is in the pipeline within 1–3 miles? Heavy new supply typically softens prices + rents 12–24 months out; constrained supply supports both.
Investment metrics
- 1% rule
- 1.32% ✓
- Cap rate
- 10.93%
- Cash-on-cash
- 16.57%
- DSCR
- 1.74
- GRM
- 6.3
CMA / ARV
- ARV (on-the-fly)
- $269,360
- Comps found
- 2
Show comp detail 2 sales within ~0.75 mi
| Address | Dist | Beds/Ba | Sqft | Sold | Price | $/sf | Match |
|---|---|---|---|---|---|---|---|
| 4416 Kristy Ct | 0.05mi | 3/2.0 | 1,616 (+11%) | 14mo | $179,720 | $111 | 68 |
| 909 Fawn Dr | 0.71mi | 3/2.0 | 1,350 (-7%) | 13mo | $250,000 | $185 | 44 |
Match score weights: distance 35% · size 25% · config 20% · recency 20%. Top-matched comps best support the ARV.
Projected returns pro-forma
-3.0% appreciation · 5.2% rent growth · sell at horizon
- IRR
- 10.1%
- Equity multiple
- 1.41×
- Total profit
- $17,000
- Equity at exit
- $22,216
- IRR
- 20.9%
- Equity multiple
- 2.94×
- Total profit
- $81,139
- Equity at exit
- $12,883
Cash invested: $41,720 (down + closing). Projections, not guarantees.
Landlord ↔ Tenant lean methodology
- Overall (STATE)
- 87 Strongly Landlord-Friendly
- State Texas
- 87 Strongly Landlord-Friendly · R+5
- County
- — inherits STATE
- City
- — inherits STATE
ZIP-level market 76049
- Home prices YoY
- -26.8%
- Rents YoY
- 5.2%
- Active inventory
- 690
- Price-to-rent
- 6.3×
Monthly cashflow live
- Estimated rent
- $1,966 high interval (Pro) →
- Mortgage (P&I)
- −$781
- Tax from tax record
- −$134 /mo · $1,602/yr
- Insurance
- −$62
- HOA
- −$0
- Vacancy / Maint / Mgmt
- −$413
- Net cashflow
- $576
Break-even live
UW: 25.0% down · 7.5% · 30yr · 1.5% tax · 5.0% vac · 8.0% maint · 8.0% mgmt
Financing live
Cash to close
- Down payment
- $37,250
- Closing costs
- $4,470
- Reserves months
- —
- Total cash needed
- —
Loan-product check · same deal, 3 products live
Conventional
25% down · 7.5% · 30yr
- Down + closing
- —
- Monthly P&I
- —
- Monthly cashflow
- —
- DSCR
- —
- Eligible?
- —
Personal DTI + credit; lowest rate.
DSCR
20% down · 8.5% · 30yr
- Down + closing
- —
- Monthly P&I
- —
- Monthly cashflow
- —
- DSCR
- —
- Eligible?
- —
No personal income docs; deal must DSCR.
Hard money
10% down · 12.0% · 12mo
- Down + closing
- —
- Monthly P&I
- —
- Monthly cashflow
- —
- DSCR
- —
- Eligible?
- —
Short-term bridge; refi at stabilization.
Rent comps 15 comps
| Address | Beds | Baths | Sqft | Rent | $/sqft | DOM | Units | Dist |
|---|---|---|---|---|---|---|---|---|
| 4411 Bobbie Ann Dr Granbury, TX | 3.0 | 2.0 | 1645 | $1,650 | $1.00 | 43d | 1 | 0.20mi |
| 208 Bobbie Ann Ct Granbury, TX | 3.0 | 2.0 | 1645 | $1,675 | $1.02 | 43d | 1 | 0.28mi |
| 213 Dean Ct Granbury, TX | 3.0 | 2.0 | 1372 | $1,609 | $1.17 | 2d | 1 | 0.28mi |
| 700 Rolling Terrace Cir Granbury, TX | 3.0 | 2.0 | 1612 | $1,774 | $1.10 | 7d | 1 | 0.28mi |
| 107 Donna Cir Granbury, TX | 3.0 | 2.0 | 1735 | $2,400 | $1.38 | 43d | 1 | 0.41mi |
| 4000 Sapphire Ln Granbury, TX | 3.0 | 2.0 | 1635 | $1,789 | $1.09 | 2d | 1 | 0.46mi |
| 316 Sardius Blvd Granbury, TX | 3.0 | 2.0 | 1686 | $1,950 | $1.16 | 7d | 1 | 0.53mi |
| 4606 Francis Ct Granbury, TX | 3.0 | 2.0 | 1300 | $2,100 | $1.62 | 43d | 1 | 0.62mi |
| 801 Meadowlark Cir Granbury, TX | 3.0 | 1.5 | 1100 | $1,400 | $1.27 | 12d | 1 | 0.67mi |
| 902 Twine St Granbury, TX | 3.0 | 2.0 | 1577 | $1,695 | $1.07 | 43d | 1 | 1.21mi |
| 3009 Meandering Way Granbury, TX | 4.0 | 2.0 | 1750 | $2,200 | $1.26 | 17d | 1 | 1.24mi |
| 3905 Country Meadows Cir Granbury, TX | 3.0 | 2.0 | 1500 | $1,475 | $0.98 | 24d | 1 | 1.31mi |
| 102 Cardinal Woods Ct Granbury, TX | 2.0 | 2.0 | 1620 | $3,650 | $2.25 | 43d | 1 | 1.37mi |
| 106 Cardinal Woods Ct Granbury, TX | 2.0 | 2.0 | 1600 | $3,650 | $2.28 | 43d | 1 | 1.39mi |
| 3002 Promenade Dr Granbury, TX | 3.0 | 2.0 | 1858 | $2,400 | $1.29 | 7d | 1 | 1.42mi |
Listing history 18 events
-
2026-04-28status Pending
-
2026-04-20$149,000 Active
-
2025-12-02price $160,000
-
2025-10-03price $185,000
-
2025-07-04$200,000 Active
-
2022-06-09soldstatus
-
2022-06-08soldstatus Closed 398-char remark
Show marketing remark (398 chars)
Cute and bright 3 bedroom 2 bath home on almost half an acre in Granbury, on a quiet cul-de sac. Oversized living room, cheerful and roomy eat-in kitchen with laundry area. All bedrooms have walk in closets. Master bath has double sinks, soaking tub and shower. Garage (Workshop) is wired with electricity and have upgraded LED lighting. No showings until Open House on Sunday, May 1st 12-4pm.
-
2022-06-07status Pending 398-char remark
Show marketing remark (398 chars)
Cute and bright 3 bedroom 2 bath home on almost half an acre in Granbury, on a quiet cul-de sac. Oversized living room, cheerful and roomy eat-in kitchen with laundry area. All bedrooms have walk in closets. Master bath has double sinks, soaking tub and shower. Garage (Workshop) is wired with electricity and have upgraded LED lighting. No showings until Open House on Sunday, May 1st 12-4pm.
-
2022-05-04historical Active Option Contract 398-char remark
Show marketing remark (398 chars)
Cute and bright 3 bedroom 2 bath home on almost half an acre in Granbury, on a quiet cul-de sac. Oversized living room, cheerful and roomy eat-in kitchen with laundry area. All bedrooms have walk in closets. Master bath has double sinks, soaking tub and shower. Garage (Workshop) is wired with electricity and have upgraded LED lighting. No showings until Open House on Sunday, May 1st 12-4pm.
-
2022-04-27$169,000 Active 398-char remark
Show marketing remark (398 chars)
Cute and bright 3 bedroom 2 bath home on almost half an acre in Granbury, on a quiet cul-de sac. Oversized living room, cheerful and roomy eat-in kitchen with laundry area. All bedrooms have walk in closets. Master bath has double sinks, soaking tub and shower. Garage (Workshop) is wired with electricity and have upgraded LED lighting. No showings until Open House on Sunday, May 1st 12-4pm.
-
2020-11-12soldstatus
-
2020-11-09soldstatus Sold
-
2020-10-19status Pending
-
2020-10-15historical Active Option Contract
-
2020-10-15status Pending
-
2020-10-07historical Active Option Contract
-
2020-09-10$139,900 Active
-
1990-12-04soldstatus
ⓘ Source: listings_history table (triggers on properties + properties_extension) + one-shot
backfill from property_details.listing_events for pre-trigger history.
Tax reassessment forecast TX · Resets to sale price
- Current annual tax
- $1,602 · $134/mo
- Projected year-2 tax
- $2,727 · $227/mo
- Expected delta
- +$1,124/yr (+$94/mo · 70.2%)
ⓘ Screening estimate from a state-policy table — verify with the county assessor before closing.
Climate risk First Street
- Flood 1/10 Low FEMA zone X (unshaded) · 0% chance over 30 yrs
- Wildfire 6/10 Major
- Heat 7/10 Severe 7 d/yr ≥108°F today · 23 d/yr by 30 yrs out
- Wind 6/10 Major 27% chance of damaging wind over 30 yrs
- Air quality 2/10 Low 1 unhealthy d/yr today · 2 by 30 yrs out
Nearby sold comps map
Loading sold comps map…
Walkable amenities ~0.75 mi
Loading nearby amenities…
Taxation est. · year 1
- Rental income
- $23,593
- − Mortgage interest
- −$8,346
- − Property taxes
- −$1,602
- − Insurance
- −$745
- − Repairs & maintenance
- −$1,887
- − Management
- −$1,887
- − Depreciation
- −$4,335
- Taxable income
- $4,790
- Est. tax owed @ 24.0%
- −$1,150
- After-tax cash flow
- $5,765/yr
For passive investors: Depreciation is non-cash, so a rental often shows a tax loss while cash-flowing — sheltering income. Rental losses are passive: they offset passive income freely, and up to $25,000/yr can offset ordinary (W-2) income if you actively participate and your MAGI is under $100k (phasing out to $0 by $150k); unused losses carry forward. On sale, claimed depreciation is recaptured at up to 25%, and gains may owe capital-gains tax (a 1031 exchange can defer both). Figures are a year-1 estimate at your 24.0% rate — not tax advice; consult a CPA.
Schools (NCES district)
- District
- Granbury ISD
- NCES district ID
- 4821390
- Math proficiency
- 46% ▬ 0.00%
- Reading proficiency
- 46% ▲ 4.00%
- Median HH income
- $55,856
- Composite
- 40.04/100
- National rank
- #3820
- State rank
- #237 of 826 in TX
Livability — Granbury
- Score
- 66/100
- State rank
- #628
- US rank
- #11998
Category grades
Schools grade is shown separately in the Schools card above.
Census & demographics
- County
- Hood County · 58,506 people
- City population
- 58,506
- Metro
- Granbury, TX
- Population (ZIP)
- 31,506
- Household income
- $104,967
- Rent vs Own
- Severe rent burden
- 235.0
Population outlook (Hood County) Hauer SSP2
- Today (2025)
- 63,502 people
- By 2030
- 67,459 · +6.2%
- By 2040
- 74,958 · +18.0%
- By 2050
- 81,922 · +29.0%
- By 2075
- 98,872 · +55.7%
- By 2100
- 107,796 · +69.8%
Race, ethnicity, and origin ACS 2023
- Neighborhood character
- Predominantly White (82%)
- Race & ethnicity
- White 82% Hispanic / Latino 14% Two or more races 9%
- Hispanic origin (detail)
- Mexican 11%
- Common ancestry
- Slovak 3% Serbian 2% Italian 2%
- Foreign-born
- 5% · Canada
- Languages at home
- 91% English-only · Spanish 8%
Political lean MEDSL · Hood
- 2024 margin
- Solid R (+66.0) · D 16.6% · R 82.6%
- 2008→2024 swing
- -11.9pp toward R · 2008: -54.0pp · 2024: -66.0pp
- All cycles
- 2024: R+66.0 2020: R+64.1 2016: R+66.5 2012: R+64.7 2008: R+54.0
Not yet ingested
- Civics
- —
Market trends
- HPI YoY
- ▼ -100.09%
- Current HPI
- 273.1293
- Rent YoY
- ▲ 5.20%
- Metro
- Granbury, TX
- State GDP YoY
- ▲ 3.95%
- F500 in state
- 110
Industry mix (Fortune 500 HQ in TX)
| Industry | F500 HQs | Revenue |
|---|---|---|
| Energy | 16 | $1,198B |
|
||
| Technology | 5 | $198B |
|
||
| Engineering / Construction | 4 | $72B |
|
||
| Energy Services | 3 | $60B |
|
||
| Utilities | 3 | $41B |
|
||
| Healthcare | 2 | $330B |
|
||
Price history
+6.5% since first listed18 events — show timeline
- 2026-04-28 Pending — NTREIS
- 2026-04-20 Listed $149,000 NTREIS
- 2025-12-02 Price Changed $160,000 NTREIS
- 2025-10-03 Price Changed $185,000 NTREIS
- 2025-07-04 Listed $200,000 NTREIS
- 2022-06-09 Sold (Public Records) — Public Records
- 2022-06-08 Sold (MLS) — NTREIS
- 2022-06-07 Pending — NTREIS
- 2022-05-04 Contingent — NTREIS
- 2022-04-27 Listed $169,000 NTREIS
- 2020-11-12 Sold (Public Records) — Public Records
- 2020-11-09 Sold (MLS) — NTREIS
- 2020-10-19 Pending — NTREIS
- 2020-10-15 Contingent — NTREIS
- 2020-10-15 Pending — NTREIS
- 2020-10-07 Contingent — NTREIS
- 2020-09-10 Listed $139,900 NTREIS
- 1990-12-04 Sold (Public Records) — Public Records
Property tax history
+12.0%/yrLatest (2025): $1,602 · -0.7% YoY. Source: county tax records.
Cash-flow waterfall
monthlySold comps — $/sqft
last 12 mo · ≤1 miLoading sold comps…