710 Oak St · California, MO
Flood risk 1/10 · Minimal
- FEMA flood zone
- X (unshaded)
- Chance of flooding over 30 yrs
- 0.0%
- Est. flood insurance / yr
- $473 – $860
Fire risk 3/10 · Minor
- Est. fire insurance / yr
- $1,054 – $1,958
Heat risk 4/10 · Minor
- Hot days now (above 108°F)
- 7 days/yr
- Hot days in 30 yrs
- 18 days/yr
Wind risk 2/10 · Minimal
- Chance of severe wind over 30 yrs
- —
Air-quality risk 2/10 · Minimal
- Unhealthy air days now
- 0 days/yr
- Unhealthy air days in 30 yrs
- 1 days/yr
Risk factors via First Street. Map © Google.
Why this score? — see what drove the B- grade
The composite is a weighted blend of 9 inputs, each scored 0–100. Each bar is that input's sub-score; the figure is the points it added to the 100-point composite (weight × sub-score).
- Cash flow +30.0/30.0
- 1% rule +10.0/10.0
- DSCR +10.0/10.0
- ARV discount +7.5/15.0
- Schools +4.2/10.0
- Livability +3.2/5.0
- Rent growth +2.5/5.0
- Condition / age +2.5/5.0
- Appreciation +0.0/10.0
$75,000
🖨 Deal sheet (PDF) 📄 Offer letter ✓ Due diligence
Listing remarks
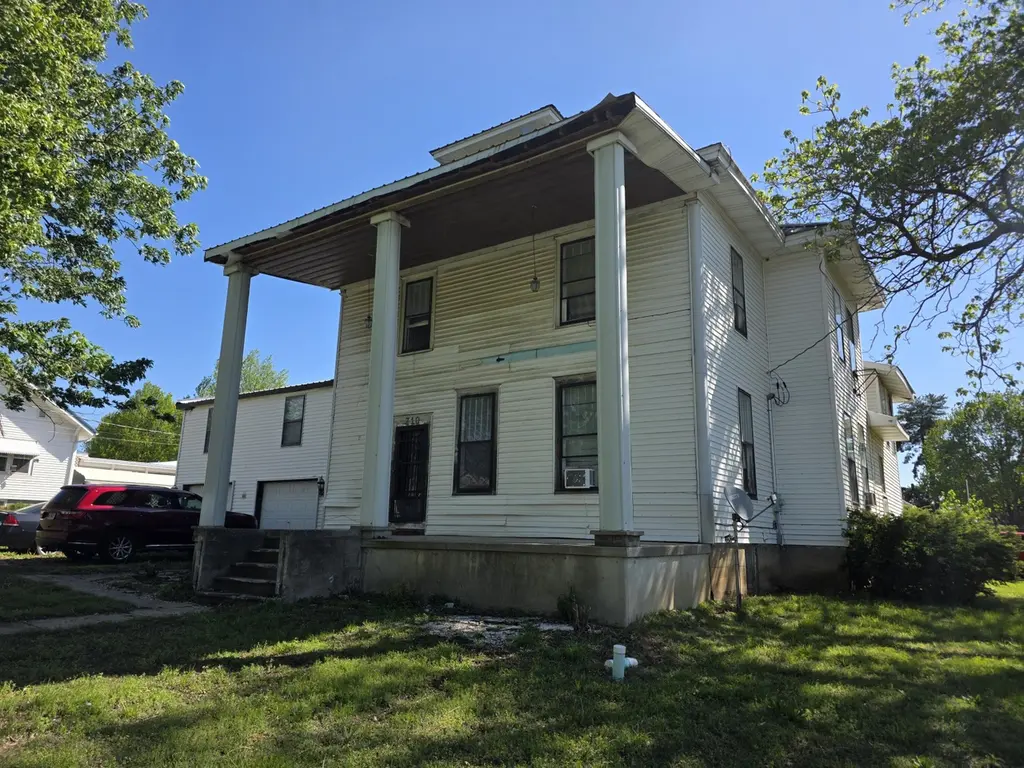
Step back in time with this character-filled 1900s home, ready for your personal touch. This true fixer-upper features 5 bedrooms and 2 bathrooms, offering ample space and flexibility for a growing family, a home office, or multi-generational living. The solid structural foundation and original hardwood floors showcasing the craftsmanship of the era provide a strong starting point for your renovation vision. The classic exterior hints at its historical charm, while the yard presents opportunities for landscaping and outdoor entertaining. Located in a vibrant community close to local amenities, this property is perfect for investors or anyone passionate about historic homes. Don't miss your
Key facts
- Outdoor entertaining
- Classic exterior
- 0.34 acre lot
Tags
Property features AI
Finance
- Other: Directions: Turn North on the HWY 87 exit off 50 HWY. Continue to South Oak St and the house is on the right.
- Financial info: Annual tax amount listed
Exterior
- Parking: Attached 2-car garage
- Home design: Single-family residence; 2 stories
- Exterior features: Lot dimensions approximately 130 x 115; Residential zoning
Interior
- Heating & cooling: Has heating
- Interior features: Total of 11 rooms
Neighborhood map
What this means for you Summary
Snapshot
- This is a 5-bed/2.0-bath other listed at $75k.
Deal economics
- At list price, monthly cash flow is $445 ($5k/yr) — positive.
- The deal already cash-flows at list — no discount required.
- Meets the 1% rule at list price ($1k rent vs $75k).
- Recommended offer: $73k (3.0% below list) — sets the bar for market timing.
Location & tenants
- Location reads 64/100 on livability (#306 in MO) — a middle-class / working-renter tenant base. Strengths: cost of living A+, housing A+; Watch: schools C-, employment D+, amenities F.
- Moniteau County R-I (town): math 44% / reading 55% proficiency, ranked #43 of 324 in MO (top 13%) — families likely to look elsewhere, expect single-tenant / working-renter base with shorter leases.
- Market conditions: 43 active listings in the ZIP; 3 units permitted in Moniteau County in 2024 (0 in 5+ unit buildings).
Forward outlook
- Local home prices are declining (-3.0%/yr); year-one equity from $519 of loan paydown is wiped out by about $2k of value loss. Plan a longer hold.
- At projected returns (-3.0% appreciation + 3.0% rent growth), your $21k cash investment doubles in ~5 years — after that, you're playing with house money.
Negotiation context
- It's been on market 52 days — a 3% lower offer ($73k) is reasonable based on typical stale-listing flexibility.
Risks & watch-outs
- Watch-outs: built in 1900 — expect roof / HVAC / electrical / plumbing capex.
Questions for the listing agent
- It's been on market 52 days. Have you received any prior offers? Is the seller open to a 3% concession, seller financing, or rate buy-down credit?
- Built in 1900 — when were the roof, HVAC, electrical panel, plumbing, and water heater last replaced?
- Is there a deadline driving the sale (1031 exchange, divorce, estate, relocation)? That informs how much negotiation room exists.
- What's the average days-on-market for RENTAL listings here right now (not sales)? A rising rental-DOM trend means longer vacancies and softer asking-rent achievability than the comps imply.
- What's the recent tenant-quality profile in this submarket — average credit score on applications, eviction rate, late-payment / NSF rate, and stable-employment percentage? A property-management company in the area should have these aggregated.
- How much new for-sale + rental construction is in the pipeline within 1–3 miles? Heavy new supply typically softens prices + rents 12–24 months out; constrained supply supports both.
Investment metrics
- 1% rule
- 1.61% ✓
- Cap rate
- 13.41%
- Cash-on-cash
- 25.43%
- DSCR
- 2.13
- GRM
- 5.2
CMA / ARV
- ARV (median comp)
- $374,900
- List price
- $75,000
- Delta
- -79.99%
- Verdict
- UNDERPRICED
- Comps
- 1 within 2.0 mi
Projected returns pro-forma
-3.0% appreciation · 3.0% rent growth · sell at horizon
- IRR
- 19.0%
- Equity multiple
- 1.77×
- Total profit
- $16,197
- Equity at exit
- $11,183
- IRR
- 27.3%
- Equity multiple
- 3.41×
- Total profit
- $50,643
- Equity at exit
- $6,485
Cash invested: $21,000 (down + closing). Projections, not guarantees.
Landlord ↔ Tenant lean methodology
- Overall (STATE)
- 81 Strongly Landlord-Friendly
- State Missouri
- 81 Strongly Landlord-Friendly · R+10
- County
- — inherits STATE
- City
- — inherits STATE
ZIP-level market 65018
- Home prices YoY
- -26.1%
- Active inventory
- 43
- Price-to-rent
- 5.2×
Monthly cashflow live
- Estimated rent
- $1,206 medium interval (Pro) →
- Mortgage (P&I)
- −$393
- Tax from tax record
- −$83 /mo · $1,000/yr
- Insurance
- −$31
- HOA
- −$0
- Vacancy / Maint / Mgmt
- −$253
- Net cashflow
- $445
Break-even live
Sensitivity live
| Price | -10% $487 | -5% $466 | +0% $445 | +5% $424 | +10% $402 |
|---|---|---|---|---|---|
| Rent | -10% $350 | -5% $397 | +0% $445 | +5% $493 | +10% $540 |
| Rate | -1.0pp $483 | -0.5pp $464 | base $445 | +0.5pp $426 | +1.0pp $406 |
UW: 25.0% down · 7.5% · 30yr · 1.5% tax · 5.0% vac · 8.0% maint · 8.0% mgmt
Financing live
Cash to close
- Down payment
- $18,750
- Closing costs
- $2,250
- Reserves months
- —
- Total cash needed
- —
Loan-product check · same deal, 3 products live
Conventional
25% down · 7.5% · 30yr
- Down + closing
- —
- Monthly P&I
- —
- Monthly cashflow
- —
- DSCR
- —
- Eligible?
- —
Personal DTI + credit; lowest rate.
DSCR
20% down · 8.5% · 30yr
- Down + closing
- —
- Monthly P&I
- —
- Monthly cashflow
- —
- DSCR
- —
- Eligible?
- —
No personal income docs; deal must DSCR.
Hard money
10% down · 12.0% · 12mo
- Down + closing
- —
- Monthly P&I
- —
- Monthly cashflow
- —
- DSCR
- —
- Eligible?
- —
Short-term bridge; refi at stabilization.
Listing history 17 events
-
2026-06-21days on market $75,000 Active 52 DOM
-
2026-06-21days on market $75,000 Active 51 DOM
-
2026-06-18days on market $75,000 Active 49 DOM
-
2026-06-17days on market $75,000 Active 48 DOM
-
2026-06-16days on market $75,000 Active 47 DOM
-
2026-06-15days on market $75,000 Active 46 DOM
-
2026-06-13days on market $75,000 Active 44 DOM
-
2026-06-12days on market $75,000 Active 43 DOM
-
2026-06-09days on market $75,000 Active 40 DOM
-
2026-06-08days on market $75,000 Active 39 DOM
-
2026-06-07days on market $75,000 Active 38 DOM
-
2026-06-07days on market $75,000 Active 37 DOM
-
2026-06-04days on market $75,000 Active 34 DOM
-
2026-06-02days on market $75,000 Active 33 DOM
-
2026-06-01days on market $75,000 Active 32 DOM
-
2026-05-31days on market $75,000 Active 31 DOM
-
2026-04-22$75,000 Active 796-char remark
ⓘ Source: listings_history table (triggers on properties + properties_extension) + one-shot
backfill from property_details.listing_events for pre-trigger history.
Tax reassessment forecast MO · Resets to sale price
- Current annual tax
- $1,000 · $83/mo
- Projected year-2 tax
- $1,000 · $83/mo
- Expected delta
- $0/yr ($0/mo · 0.0%)
ⓘ Screening estimate from a state-policy table — verify with the county assessor before closing.
Climate risk First Street
- Flood 1/10 Low FEMA zone X (unshaded) · 0% chance over 30 yrs
- Wildfire 3/10 Moderate
- Heat 4/10 Moderate 7 d/yr ≥108°F today · 18 d/yr by 30 yrs out
- Wind 2/10 Low
- Air quality 2/10 Low 0 unhealthy d/yr today · 1 by 30 yrs out
Nearby sold comps map
Loading sold comps map…
Walkable amenities ~0.75 mi
Loading nearby amenities…
Taxation est. · year 1
- Rental income
- $14,474
- − Mortgage interest
- −$4,201
- − Property taxes
- −$1,000
- − Insurance
- −$375
- − Repairs & maintenance
- −$1,158
- − Management
- −$1,158
- − Depreciation
- −$2,182
- Taxable income
- $4,400
- Est. tax owed @ 24.0%
- −$1,056
- After-tax cash flow
- $4,283/yr
For passive investors: Depreciation is non-cash, so a rental often shows a tax loss while cash-flowing — sheltering income. Rental losses are passive: they offset passive income freely, and up to $25,000/yr can offset ordinary (W-2) income if you actively participate and your MAGI is under $100k (phasing out to $0 by $150k); unused losses carry forward. On sale, claimed depreciation is recaptured at up to 25%, and gains may owe capital-gains tax (a 1031 exchange can defer both). Figures are a year-1 estimate at your 24.0% rate — not tax advice; consult a CPA.
Schools (NCES district)
- District
- Moniteau County R-I
- NCES district ID
- 2906510
- Math proficiency
- 44% ▼ -6.00%
- Reading proficiency
- 55% ▲ 3.00%
- Median HH income
- $47,994
- Composite
- 42.14/100
- National rank
- #3306
- State rank
- #43 of 324 in MO
Livability — California
- Score
- 64/100
- State rank
- #306
- US rank
- #14022
Category grades
Schools grade is shown separately in the Schools card above.
Census & demographics
- Census place
- California, MO
- City population
- 7,811
- Population (ZIP)
- 7,811
Population outlook (Moniteau County) Hauer SSP2
- Today (2025)
- 16,265 people
- By 2030
- 16,309 · +0.3%
- By 2040
- 16,437 · +1.1%
- By 2050
- 16,475 · +1.3%
- By 2075
- 15,956 · -1.9%
- By 2100
- 14,142 · -13.1%
Race, ethnicity, and origin ACS 2023
- Neighborhood character
- Predominantly White (86%)
- Race & ethnicity
- White 86% Hispanic / Latino 10% Two or more races 6%
- Hispanic origin (detail)
- Mexican 9%
- Common ancestry
- Italian 4% Serbian 2% Lithuanian 2%
- Foreign-born
- 4% · Canada, Philippines
- Languages at home
- 90% English-only · Spanish 7% German/W. Germanic 2% Other Asian/Pacific 1%
Political lean MEDSL · Moniteau
- 2024 margin
- Solid R (+62.8) · D 18.1% · R 80.8% · Other 1.1%
- 2008→2024 swing
- -27.0pp toward R · 2008: -35.8pp · 2024: -62.8pp
- All cycles
- 2024: R+62.8 2020: R+62.0 2016: R+60.3 2012: R+48.0 2008: R+35.8
Not yet ingested
- Civics
- —
Market trends
- HPI YoY
- ▼ -75.63%
- Current HPI
- 214.3568
- Rent YoY
- —
- Metro
- —
- State GDP YoY
- ▲ 1.84%
- F500 in state
- 20
Industry mix (Fortune 500 HQ in MO)
| Industry | F500 HQs | Revenue |
|---|---|---|
| Healthcare | 1 | $163B |
|
||
| Insurance | 1 | $21B |
|
||
| Industrial Technology | 1 | $17B |
|
||
| Retail | 1 | $16B |
|
||
| Industrial Distribution | 1 | $10B |
|
||
| Utilities | 1 | $9B |
|
||
Price history
1 event — show timeline
- 2026-04-22 Listed $75,000 CMBR
Property tax history
+2.3%/yrLatest (2025): $1,000 · +1.0% YoY. Source: county tax records.
Cash-flow waterfall
monthlySold comps — $/sqft
last 12 mo · ≤1 miLoading sold comps…