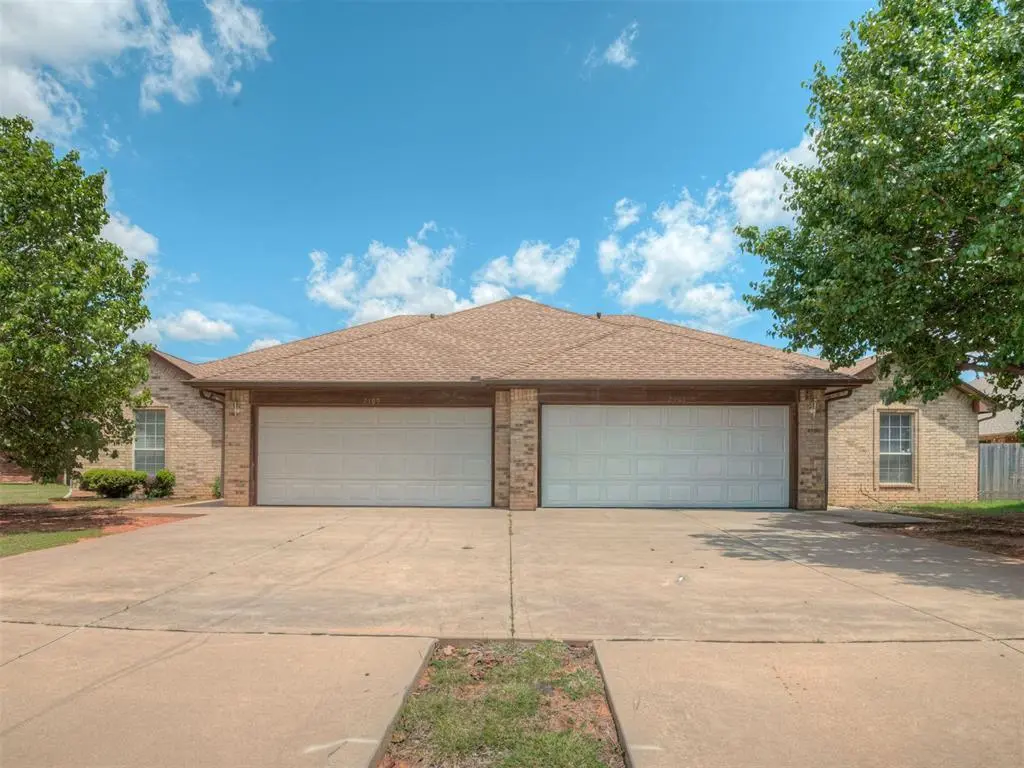
2709 Silvertree Dr · Oklahoma City, OK
Flood risk 1/10 · Minimal
- FEMA flood zone
- X (unshaded)
- Chance of flooding over 30 yrs
- 0.0%
- Est. flood insurance / yr
- $507 – $1,088
Fire risk 1/10 · Minimal
- Est. fire insurance / yr
- $2,463 – $4,575
Heat risk 6/10 · Moderate
- Hot days now (above 107°F)
- 7 days/yr
- Hot days in 30 yrs
- 20 days/yr
Wind risk 2/10 · Minimal
- Chance of severe wind over 30 yrs
- 2.0%
Air-quality risk 2/10 · Minimal
- Unhealthy air days now
- 1 days/yr
- Unhealthy air days in 30 yrs
- 1 days/yr
Risk factors via First Street. Map © Google.
Why this score? — see what drove the F grade
The composite is a weighted blend of 9 inputs, each scored 0–100. Each bar is that input's sub-score; the figure is the points it added to the 100-point composite (weight × sub-score).
- Cash flow +14.2/30.0
- DSCR +4.3/10.0
- Livability +4.0/5.0
- 1% rule +3.6/10.0
- Rent growth +3.0/5.0
- Condition / age +2.5/5.0
- ARV discount +1.6/15.0
- Schools +0.7/10.0
- Appreciation +0.0/10.0
$199,900
🖨 Deal sheet 📄 Offer letter ✓ Due diligence
Listing remarks
Welcome to this perfectly-designed 3-bedroom, 2-bath half duplex offering comfort, convenience, and plenty of space. The inviting living area features a cozy gas fireplace—perfect for relaxing evenings at home. Enjoy cooking and gathering with ease thanks to the functional layout, while the large driveway and attached two-car garage provide ample parking and storage. Step outside to a covered patio ideal for entertaining or unwinding, all overlooking a fully fenced backyard that offers privacy and room to enjoy the outdoors. With its thoughtful layout and desirable features, this home is a fantastic opportunity for homeowners or investors alike! Owner of this property is a licensed r
Key facts
- Gas fireplace
- Covered patio
- 2 garage spots
Tags
Property features AI
Finance
- Other: Vacant and available; Owner is an associate (condition affecting sale)
- Financial info: Financing options include Cash, Conventional, Lease Purchase, Special Funding; Loan qualification possible
- HOA & community: No mandatory association dues
Exterior
- Parking: Concrete parking; 2-car garage
- Utilities: Electricity available; Natural gas available; Cable available; High-speed internet available
- Home design: Residential half-duplex; One level; South-facing; Existing property
- Construction: Brick and frame construction; Composition roof; Vinyl frame windows; Slab foundation
- Exterior features: Covered patio; Rain gutters; Wood fencing; Interior lot
Interior
- Kitchen: Built-in gas range; Built-in gas oven; Dishwasher; Microwave; Refrigerator; Water heater
- Bedrooms: 3 bedrooms
- Flooring: Carpet; Tile
- Bathrooms: 2 full bathrooms
- Heating & cooling: Central cooling; Natural gas available
- Interior features: Ceiling fans; Window treatments; Blown cellulose insulation; Gas log fireplace (1)
- Laundry & utility: Washer/dryer hookups (appliance specifics not listed)
Neighborhood map
What this means for you Summary
Snapshot
- This is a 3-bed/2.0-bath townhouse listed at $200k.
Deal economics
- At list price, monthly cash flow is $33 ($397/yr) — positive.
- The deal already cash-flows at list — no discount required.
- To meet the 1% rule (rent ≥ 1% of price), the offer needs to be $171k (14.3% below list).
- Recommended offer: $171k (14.3% below list) — sets the bar for 1% rule.
- Cap rate 6.5% vs local median 3.7% in Oklahoma City — top-decile yield for the area; either an underpriced asset or a hidden risk that comps aren't pricing in. Stress-test before assuming the spread holds.
Location & tenants
- Location reads 80/100 on livability (#3 in OK, #1,635 nationally) — a professional / high-income tenant draw. Strengths: amenities A+, commute A+, cost of living A+; Watch: crime F.
- Oklahoma City (urban): math 7% / reading 10% proficiency, ranked #254 of 270 in OK (top 94%) — low school quality limits family demand, transient renter base, plan for 1-2y turnover; 82% free/reduced lunch — lower-income household profile, screen leases tightly.
- Zoned schools: Quail Creek Es (math 17% / reading 17%, grade F, #540 of 845 statewide, top 68%, 543 students, 0% FRL); John Marshall Hs (math 2% / reading 8%, grade F, #430 of 447 statewide, top 99%, 829 students, 0% FRL) — zoned schools average 0% FRL vs 82% district-wide (82 pts lower); this property's tenant base skews higher-income than the district average.
- Market conditions: Rents rising (+2.0%/yr); 333 active listings in the ZIP; 40 comparable units currently listed for rent nearby; rentals at typical pace (median 16d on market — plan ~3-4 weeks tenant-placement turnaround); 5,365 units permitted in Oklahoma County in 2024 (569 in 5+ unit buildings).
- This rent runs 32% of the median local income ($65k/yr) — at the standard rent-burdened threshold; future hikes will face affordability resistance.
Forward outlook
- Local home prices are declining (-3.0%/yr); year-one equity from $1k of loan paydown is wiped out by about $6k of value loss. Plan a longer hold.
- Oklahoma County population projected at +41% by 2050 — long-run rental-demand tailwind backs the buy-and-hold thesis.
Negotiation context
- It's been on market 22 days — a 2% lower offer ($197k) is reasonable based on typical stale-listing flexibility.
- 2 sale attempts since 19y ago with the ask held roughly flat each time — persistent listings suggest the price (not the market) is what's stuck; bring a comps-based counter.
Risks & watch-outs
- Climate carrying-cost: extreme-heat days projected 7→20/yr by 2055 (HVAC capex compounding) — expect insurance premiums to compound above CPI over the hold.
Questions for the listing agent
- Is there a deadline driving the sale (1031 exchange, divorce, estate, relocation)? That informs how much negotiation room exists.
- Schools are F-rated, which usually means shorter tenancies and higher turnover. Who's the typical renter profile here, and what's been the actual vacancy rate?
- Crime grade is F in this area — have there been break-ins, vandalism, or insurance claims at this property in the last 3 years? What carrier currently insures it and at what premium?
- The area grade is low — what's the realistic commute time and amenity access for the typical tenant pool here? Any planned neighborhood developments (good or bad) we should know about?
- What's the average days-on-market for RENTAL listings here right now (not sales)? A rising rental-DOM trend means longer vacancies and softer asking-rent achievability than the comps imply.
- What's the recent tenant-quality profile in this submarket — average credit score on applications, eviction rate, late-payment / NSF rate, and stable-employment percentage? A property-management company in the area should have these aggregated.
- How much new for-sale + rental construction is in the pipeline within 1–3 miles? Heavy new supply typically softens prices + rents 12–24 months out; constrained supply supports both.
Investment metrics
- 1% rule
- 0.86% ✗
- Cap rate
- 6.49%
- Cash-on-cash
- 0.71%
- DSCR
- 1.03
- GRM
- 9.7
CMA / ARV
- ARV (on-the-fly)
- $176,834
- Comps found
- 12
Show comp detail 12 sales within ~0.75 mi
| Address | Dist | Beds/Ba | Sqft | Sold | Price | $/sf | Match |
|---|---|---|---|---|---|---|---|
| 2622 N Silvertree St | 0.08mi | 3/2.0 | 1,582 (+6%) | 1mo | $208,000 | $131 | 85 |
| 2634 Featherstone Rd Unit B | 0.38mi | 3/2.0 | 1,420 (-4%) | 1mo | $169,225 | $119 | 74 |
| 2629 Cedar Tree Rd Unit D | 0.34mi | 3/2.0 | 1,419 (-4%) | 3mo | $164,500 | $116 | 74 |
| 2730 Silvertree Dr | 0.11mi | 3/2.0 | 1,560 (+5%) | 15mo | $190,000 | $122 | 74 |
| 12941 Carrie Ct | 0.21mi | 3/2.5 | 1,485 (-0%) | 19mo | $152,500 | $103 | 72 |
| 2630 Featherstone Rd Unit F | 0.37mi | 3/2.0 | 1,488 (+0%) | 16mo | $175,000 | $118 | 69 |
| 2622 Featherstone Rd Unit B | 0.38mi | 3/2.0 | 1,420 (-4%) | 11mo | $183,500 | $129 | 66 |
| 2616 Silvertree Dr | 0.11mi | 3/2.0 | 1,636 (+10%) | 16mo | $185,000 | $113 | 65 |
| 2634 Featherstone Rd Unit C | 0.38mi | 3/2.0 | 1,419 (-4%) | 12mo | $185,000 | $130 | 65 |
| 2633 Cedar Tree Rd Unit E | 0.34mi | 3/2.0 | 1,420 (-4%) | 16mo | $169,000 | $119 | 63 |
| 2622 Featherstone Rd Unit D | 0.38mi | 3/2.0 | 1,419 (-4%) | 18mo | $168,900 | $119 | 60 |
| 2610 Featherstone Rd | 0.39mi | 2/2.0 (-1) | 1,347 (-9%) | 2mo | $166,900 | $124 | 60 |
Match score weights: distance 35% · size 25% · config 20% · recency 20%. Top-matched comps best support the ARV.
Projected returns pro-forma
-3.0% appreciation · 2.05% rent growth · sell at horizon
- IRR
- -16.2%
- Equity multiple
- 0.43×
- Total profit
- $-31,917
- Equity at exit
- $29,806
- IRR
- -9.6%
- Equity multiple
- 0.43×
- Total profit
- $-31,656
- Equity at exit
- $17,284
Cash invested: $55,972 (down + closing). Projections, not guarantees.
Landlord ↔ Tenant lean methodology
- Overall (STATE)
- 83 Strongly Landlord-Friendly
- State Oklahoma
- 83 Strongly Landlord-Friendly · R+20
- County
- — inherits STATE
- City
- — inherits STATE
ZIP-level market 73120
- Rents YoY
- 2.0%
- Active inventory
- 333
- Price-to-rent
- 9.7×
Monthly cashflow live
- Estimated rent
- $1,714 high interval (Pro) →
- Mortgage (P&I)
- −$1,048
- Tax from tax record
- −$189 /mo · $2,268/yr
- Insurance
- −$83
- HOA
- −$0
- Vacancy / Maint / Mgmt
- −$360
- Net cashflow
- $33
Break-even live
UW: 25.0% down · 7.5% · 30yr · 1.5% tax · 5.0% vac · 8.0% maint · 8.0% mgmt
Financing live
Cash to close
- Down payment
- $49,975
- Closing costs
- $5,997
- Reserves months
- —
- Total cash needed
- —
Loan-product check · same deal, 3 products live
Conventional
25% down · 7.5% · 30yr
- Down + closing
- —
- Monthly P&I
- —
- Monthly cashflow
- —
- DSCR
- —
- Eligible?
- —
Personal DTI + credit; lowest rate.
DSCR
20% down · 8.5% · 30yr
- Down + closing
- —
- Monthly P&I
- —
- Monthly cashflow
- —
- DSCR
- —
- Eligible?
- —
No personal income docs; deal must DSCR.
Hard money
10% down · 12.0% · 12mo
- Down + closing
- —
- Monthly P&I
- —
- Monthly cashflow
- —
- DSCR
- —
- Eligible?
- —
Short-term bridge; refi at stabilization.
Rent comps 40 comps
| Address | Beds | Baths | Sqft | Rent | $/sqft | DOM | Units | Dist |
|---|---|---|---|---|---|---|---|---|
| 2611 Silvertree Dr Oklahoma City, OK | 3.0 | 2.0 | 1500 | $1,550 | $1.03 | 43d | 1 | 0.17mi |
| 2608 Crescent Ave Oklahoma City, OK | 3.0 | 2.5 | 1600 | $2,345 | $1.47 | 21d | 1 | 0.19mi |
| 2610 Crescent Ave Oklahoma City, OK | 3.0 | 2.5 | 1387 | $2,125 | $1.53 | 21d | 1 | 0.20mi |
| 2700 Indian Creek Blvd Oklahoma City, OK | 1.0–3.0 | 1.0–2.0 | 1261 | $1,549 | $1.23 | 2d | 5 | 0.24mi |
| 2841 Indian Creek Blvd Oklahoma City, OK | 2.0 | 2.0 | 1129 | $1,100 | $0.97 | 23d | 1 | 0.25mi |
| 2841 Indian Creek Blvd Oklahoma City, OK | 2.0 | 2.0 | 1129 | $1,100 | $0.97 | 16d | 1 | 0.25mi |
| 2501 Patti Pl Oklahoma City, OK | 3.0 | 2.0 | 1377 | $1,600 | $1.16 | 43d | 1 | 0.26mi |
| 2533 NW 129th St Oklahoma City, OK | 3.0 | 2.0 | 1500 | $2,200 | $1.47 | 23d | 1 | 0.28mi |
| 2533 NW 129th St Oklahoma City, OK | 3.0 | 2.5 | 1497 | $2,200 | $1.47 | 4d | 1 | 0.28mi |
| 2638 Cedar Tree Rd Oklahoma City, OK | 3.0 | 2.5 | 1650 | $1,945 | $1.18 | 23d | 1 | 0.29mi |
| 2540 NW 132nd Pl Oklahoma City, OK | 3.0 | 2.5 | 1385 | $2,400 | $1.73 | 23d | 1 | 0.34mi |
| 2523 NW 132nd Pl Oklahoma City, OK | 3.0 | 2.5 | 1328 | $2,450 | $1.84 | 23d | 1 | 0.38mi |
| 12821 Stratford Dr Oklahoma City, OK | 2.0 | 2.0 | 1043 | $1,078 | $1.03 | 2d | 1 | 0.39mi |
| 12831 Stratford Dr Oklahoma City, OK | 1.0–3.0 | 1.0–2.0 | 1122 | $3,736 | $3.33 | 1d | 22 | 0.39mi |
| 2401 NW 122nd St Oklahoma City, OK | 1.0–2.0 | 1.0–2.0 | 844 | $899 | $1.06 | 23d | 1 | 0.42mi |
| 2609 Featherstone Rd Oklahoma City, OK | 1.0–2.0 | 1.0–2.0 | 769 | $1,150 | $1.50 | 2d | 34 | 0.43mi |
| 12323 Cedar Springs Ln Oklahoma City, OK | 3.0 | 2.5 | 1524 | $1,500 | $0.98 | 43d | 1 | 0.45mi |
| 12305 Cedar Springs Ln Oklahoma City, OK | 2.0 | 2.5 | 1472 | $1,250 | $0.85 | 43d | 1 | 0.48mi |
| 12701 N Pennsylvania Ave Oklahoma City, OK | 3.0 | 1.0–2.0 | 912 | $1,595 | $1.75 | 1d | 15 | 0.63mi |
| 2529 NW 116th St Oklahoma City, OK | 3.0 | 2.0 | 1625 | $1,650 | $1.02 | 43d | 1 | 0.77mi |
| 2532 NW 116th St Oklahoma City, OK | 4.0 | 2.0 | 1860 | $2,805 | $1.51 | 23d | 1 | 0.80mi |
| 11417 N May Ave Unit D Oklahoma City, OK | 3.0 | 2.0 | 1275 | $1,345 | $1.05 | 2d | 1 | 0.93mi |
| 2221 NW 117th St Oklahoma City, OK | 3.0 | 2.5 | 1627 | $1,625 | $1.00 | 2d | 1 | 0.95mi |
| 2126 NW 118th St Oklahoma City, OK | 2.0 | 2.5 | 1360 | $1,445 | $1.06 | 23d | 1 | 0.96mi |
| 11407 N May Ave Oklahoma City, OK | 3.0 | 3.0 | 1613 | $1,450 | $0.90 | 43d | 1 | 0.96mi |
| 14200 N May Ave Oklahoma City, OK | 1.0–3.0 | 1.0–2.0 | 1031 | $1,725 | $1.67 | 2d | 17 | 1.03mi |
| 14300 N May Ave Oklahoma City, OK | 1.0–3.0 | 1.0–2.0 | 923 | $1,620 | $1.75 | 3d | 15 | 1.11mi |
| 11004 N May Ave Oklahoma City, OK | 1.0–2.0 | 1.0–2.5 | 1129 | $1,170 | $1.04 | 11d | 1 | 1.15mi |
| 2300 NW 145th St Oklahoma City, OK | 1.0–3.0 | 1.0–2.0 | 1000 | $2,225 | $2.23 | 1d | 12 | 1.20mi |
| 14327 N Pennsylvania Ave Unit 36G Oklahoma City, OK | 2.0 | 1.0 | 950 | $1,100 | $1.16 | 2d | 1 | 1.21mi |
| 14320 Mezzaluna Ave Oklahoma City, OK | 2.0 | 2.0 | 1267 | $1,619 | $1.28 | 14d | 1 | 1.22mi |
| 2600 Watermark Blvd Oklahoma City, OK | 1.0–2.0 | 1.0–2.5 | 1066 | $1,567 | $1.47 | 2d | 10 | 1.23mi |
| 12321 Edison Dr Oklahoma City, OK | 3.0 | 2.0 | 1491 | $1,495 | $1.00 | 43d | 1 | 1.23mi |
| 14425 N Pennsylvania Ave Unit 20B Oklahoma City, OK | 2.0 | 2.0 | 1134 | $1,299 | $1.15 | 23d | 1 | 1.28mi |
| 11007 Greystone Ave Oklahoma City, OK | 2.0 | 2.0 | 1269 | $1,500 | $1.18 | 4d | 1 | 1.29mi |
| 2400 Watermark Blvd Oklahoma City, OK | 2.0 | 2.0 | 1267 | $1,679 | $1.33 | 21d | 1 | 1.30mi |
| 14433 N Pennsylvania Ave Unit 27A Oklahoma City, OK | 3.0 | 2.0 | 1360 | $1,750 | $1.29 | 2d | 1 | 1.32mi |
| 1540 NW 126th St Oklahoma City, OK | 3.0 | 2.0 | 1458 | $1,600 | $1.10 | 10d | 1 | 1.32mi |
| 11239 N Pennsylvania Ave Oklahoma City, OK | 1.0–2.0 | 1.0–2.0 | 850 | $1,155 | $1.36 | 4d | 30 | 1.33mi |
| 14201 N Kentucky Ave Oklahoma City, OK | 1.0–2.0 | 1.0–2.0 | 905 | $2,340 | $2.59 | 2d | 18 | 1.33mi |
Listing history 20 events
-
2026-06-18days on market $199,900 Active 22 DOM
-
2026-06-17days on market $199,900 Active 21 DOM
-
2026-06-16days on market $199,900 Active 20 DOM
-
2026-06-15days on market $199,900 Active 19 DOM
-
2026-06-13days on market $199,900 Active 17 DOM
-
2026-06-09days on market $199,900 Active 13 DOM
-
2026-06-08days on market $199,900 Active 12 DOM
-
2026-06-07days on market $199,900 Active 11 DOM
-
2026-06-05days on market $199,900 Active 8 DOM
-
2026-06-03days on market $199,900 Active 7 DOM
-
2026-06-02days on market $199,900 Active 6 DOM
-
2026-06-01days on market $199,900 Active 5 DOM
-
2026-05-31days on market $199,900 Active 4 DOM
-
2026-05-21$199,900 Active
-
2022-12-03historical
-
2020-02-10soldstatus $1,062,500
-
2008-03-15historical
-
2007-12-12$141,000
-
2002-10-07soldstatus $202,000
-
2002-05-09soldstatus $25,500
ⓘ Source: listings_history table (triggers on properties + properties_extension) + one-shot
backfill from property_details.listing_events for pre-trigger history.
Tax reassessment forecast OK · Resets to sale price
- Current annual tax
- $2,268 · $189/mo
- Projected year-2 tax
- $2,268 · $189/mo
- Expected delta
- $0/yr ($0/mo · 0.0%)
ⓘ Screening estimate from a state-policy table — verify with the county assessor before closing.
Climate risk First Street
- Flood 1/10 Low FEMA zone X (unshaded) · 0% chance over 30 yrs
- Wildfire 1/10 Low
- Heat 6/10 Major 7 d/yr ≥107°F today · 20 d/yr by 30 yrs out
- Wind 2/10 Low 2% chance of damaging wind over 30 yrs
- Air quality 2/10 Low 1 unhealthy d/yr today · 1 by 30 yrs out
Nearby sold comps map
Loading sold comps map…
Walkable amenities ~0.75 mi
Loading nearby amenities…
Taxation est. · year 1
- Rental income
- $20,562
- − Mortgage interest
- −$11,198
- − Property taxes
- −$2,268
- − Insurance
- −$1,000
- − Repairs & maintenance
- −$1,645
- − Management
- −$1,645
- − Depreciation
- −$5,815
- Taxable loss
- −$3,008
- Est. tax savings @ 24.0%
- +$722
- After-tax cash flow
- $1,119/yr
For passive investors: Depreciation is non-cash, so a rental often shows a tax loss while cash-flowing — sheltering income. Rental losses are passive: they offset passive income freely, and up to $25,000/yr can offset ordinary (W-2) income if you actively participate and your MAGI is under $100k (phasing out to $0 by $150k); unused losses carry forward. On sale, claimed depreciation is recaptured at up to 25%, and gains may owe capital-gains tax (a 1031 exchange can defer both). Figures are a year-1 estimate at your 24.0% rate — not tax advice; consult a CPA.
Schools (NCES district)
- District
- Oklahoma City
- NCES district ID
- 4022770
- Math proficiency
- 7% ▼ -5.00%
- Reading proficiency
- 10% ▼ -6.00%
- Median HH income
- $35,606
- Composite
- 7.0/100
- National rank
- #9970
- State rank
- #254 of 270 in OK
Livability — Oklahoma City
- Score
- 80/100
- State rank
- #3
- US rank
- #1635
Category grades
Schools grade is shown separately in the Schools card above.
Census & demographics
- Census place
- Oklahoma City, OK
- County
- Oklahoma County · 771,644 people
- City population
- 498,656
- Metro
- Oklahoma City, OK
- Population (ZIP)
- 35,559
- Household income
- $64,745
- Rent vs Own
- Severe rent burden
- 2029.0
Population outlook (Oklahoma County) Hauer SSP2
- Today (2025)
- 911,875 people
- By 2030
- 982,413 · +7.7%
- By 2040
- 1,130,468 · +24.0%
- By 2050
- 1,288,422 · +41.3%
- By 2075
- 1,711,482 · +87.7%
- By 2100
- 2,088,448 · +129.0%
Race, ethnicity, and origin ACS 2023
- Neighborhood character
- Diverse neighborhood (Simpson 0.62)
- Race & ethnicity
- White 57% Black 21% Two or more races 11% Hispanic / Latino 7% Native American 3% Asian 2%
- Hispanic origin (detail)
- Mexican 4%
- Common ancestry
- Italian 3% Slovak 2% Lithuanian 2%
- Foreign-born
- 7% · Canada, China, Jamaica
- Languages at home
- 92% English-only · Spanish 4% French/Haitian/Cajun 1% Other Asian/Pacific 1%
Political lean MEDSL · Oklahoma
- 2024 margin
- Toss-up / Even · D 48.0% · R 49.7% · Other 2.3%
- 2008→2024 swing
- +15.1pp toward D · 2008: -16.8pp · 2024: -1.7pp
- All cycles
- 2024: R+1.7 2020: R+1.1 2016: R+10.5 2012: R+16.7 2008: R+16.8
Not yet ingested
- Civics
- —
Market trends
- HPI YoY
- ▼ -279.69%
- Current HPI
- 227.2832
- Rent YoY
- ▲ 2.05%
- Metro
- Oklahoma City, OK
- State GDP YoY
- ▲ 1.55%
- F500 in state
- 6
Industry mix (Fortune 500 HQ in OK)
| Industry | F500 HQs | Revenue |
|---|---|---|
| Energy | 3 | $48B |
|
||
Price history
+683.9% since first listed7 events — show timeline
- 2026-05-21 Listed $199,900 MLSOK
- 2022-12-03 Rental Removed — RENT.
- 2020-02-10 Sold (Public Records) $1,062,500 Public Records
- 2008-03-15 Listing Removed — MLSOK
- 2007-12-12 Listed $141,000 MLSOK
- 2002-10-07 Sold (Public Records) $202,000 Public Records
- 2002-05-09 Sold (Public Records) $25,500 Public Records
Property tax history
+4.8%/yrLatest (2025): $2,268 · +4.2% YoY. Source: county tax records.
Cash-flow waterfall
monthlySold comps — $/sqft
last 12 mo · ≤1 miLoading sold comps…