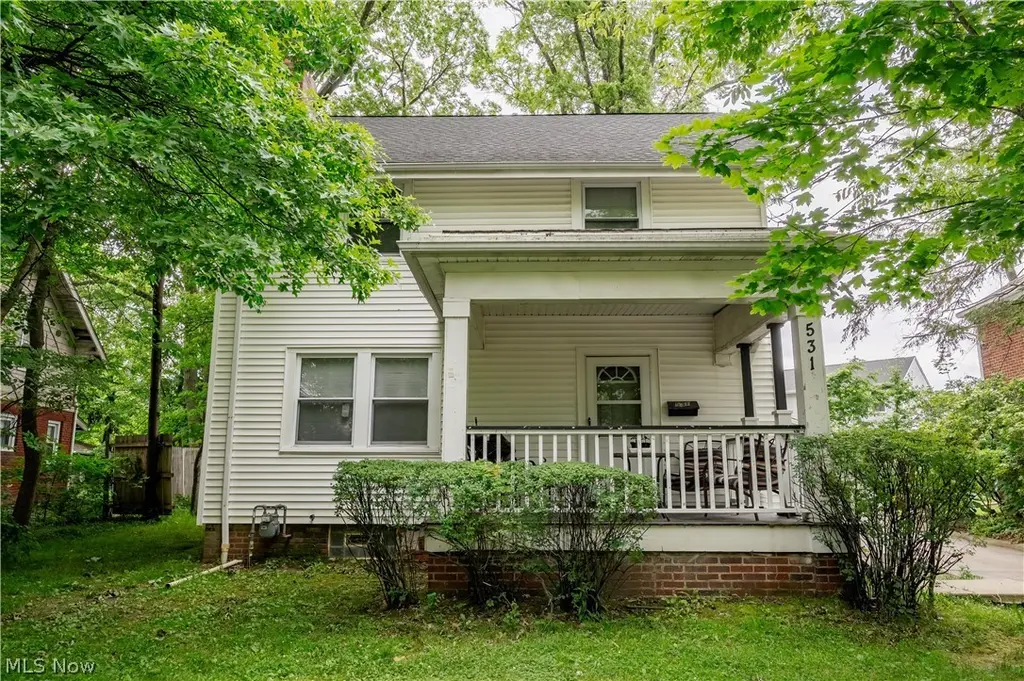
531 Fernwood Dr · Akron, OH
Flood risk 1/10 · Minimal
- FEMA flood zone
- X (unshaded)
- Chance of flooding over 30 yrs
- 0.0%
- Est. flood insurance / yr
- $473 – $860
Fire risk 1/10 · Minimal
- Est. fire insurance / yr
- $713 – $1,323
Heat risk 3/10 · Minor
- Hot days now (above 97°F)
- 7 days/yr
- Hot days in 30 yrs
- 16 days/yr
Wind risk 1/10 · Minimal
- Chance of severe wind over 30 yrs
- —
Air-quality risk 3/10 · Minor
- Unhealthy air days now
- 2 days/yr
- Unhealthy air days in 30 yrs
- 4 days/yr
Risk factors via First Street. Map © Google.
Why this score? — see what drove the C grade
The composite is a weighted blend of 9 inputs, each scored 0–100. Each bar is that input's sub-score; the figure is the points it added to the 100-point composite (weight × sub-score).
- Cash flow +27.9/30.0
- DSCR +9.8/10.0
- 1% rule +6.9/10.0
- Livability +4.0/5.0
- Rent growth +2.9/5.0
- Condition / age +2.5/5.0
- Schools +2.1/10.0
- ARV discount +0.0/15.0
- Appreciation +0.0/10.0
$109,900
🖨 Deal sheet 📄 Offer letter ✓ Due diligence
Listing remarks MLS
Located on Akron‘s historic west side! set your private viewing for 531 Fernwood today! Whether using this as an investment property as it has been for years, first time home or your forever home, this home has tons of upside and is surrounded by nice properties, we feature vinyl siding, glass block windows, newer roof, perfect front porch for fall, spring and summer sitting, a deep backyard, newer entry doors, vinyl windows, formal dining room and priced to sell under 30,000! Call today!!
Key facts
- 6,764 sq ft lot
- Parking
- Built 1920
Property features AI
Finance
- Other: Above-grade finished area approximately 1,288 (source: Realist); Lot size approximately 0.1553 acres
Exterior
- Parking: Driveway
- Utilities: Public water; Public sewer
- Home design: 2-story home; Vinyl siding exterior; Asphalt/fiberglass roof
- Construction: Built per public records; Vinyl siding construction; Asphalt/Fiberglass roof; Full basement foundation
- Exterior features: Front porch; Lot dimensions approximately 55 x 123
Interior
- Bathrooms: 1 full bathroom
- Heating & cooling: Forced air heating; Gas heating
- Interior features: Full basement; One fireplace
- Laundry & utility: Laundry located in bathroom
Neighborhood map
What this means for you Summary
Snapshot
- This is a 3-bed/1.0-bath single-family listed at $110k.
Deal economics
- At list price, monthly cash flow is $337 ($4k/yr) — positive.
- The deal already cash-flows at list — no discount required.
- Meets the 1% rule at list price ($1k rent vs $110k).
- Cap rate 10.0% vs local median 6.6% in Akron — top-decile yield for the area; either an underpriced asset or a hidden risk that comps aren't pricing in. Stress-test before assuming the spread holds.
Location & tenants
- Location reads 81/100 on livability (#104 in OH, #1,591 nationally) — a professional / high-income tenant draw. Strengths: amenities A+, commute A+, cost of living A+; Watch: crime F, employment F.
- Akron City (urban): math 22% / reading 30% proficiency, ranked #602 of 656 in OH (top 92%) — low school quality limits family demand, transient renter base, plan for 1-2y turnover; 66% free/reduced lunch — lower-income household profile, screen leases tightly.
- Market conditions: Rents rising (+1.6%/yr); 102 active listings in the ZIP; 40 comparable units currently listed for rent nearby; rentals lingering (median 44d on market — plan ~5-8 weeks vacancy on turnover, expect pricing pressure); 58% of comp listings sitting > 30 days — soft ceiling on asking rent; lower-income renter base — watch delinquency; 1,114 units permitted in Summit County in 2024 (397 in 5+ unit buildings).
- This rent runs 38% of the median local income ($41k/yr) — at the standard rent-burdened threshold; future hikes will face affordability resistance.
Forward outlook
- Local home prices are declining (-3.0%/yr); year-one equity from $760 of loan paydown is wiped out by about $3k of value loss. Plan a longer hold.
- Summit County population projected to shrink 6% by 2050 — rents likely to lag national; underwrite the cash flow, not the appreciation.
Negotiation context
- Only 5 days on market — expect competitive offers; lowballing is unlikely to land.
- 7 sale attempts since 31y ago with the ask held roughly flat each time — persistent listings suggest the price (not the market) is what's stuck; bring a comps-based counter.
- Current owner paid $22k; list at $110k implies a 389% gain — meaningful room to come down on a strong offer.
Risks & watch-outs
- Watch-outs: built in 1920 — expect roof / HVAC / electrical / plumbing capex.
Questions for the listing agent
- Built in 1920 — when were the roof, HVAC, electrical panel, plumbing, and water heater last replaced?
- Is there a deadline driving the sale (1031 exchange, divorce, estate, relocation)? That informs how much negotiation room exists.
- Crime grade is F in this area — have there been break-ins, vandalism, or insurance claims at this property in the last 3 years? What carrier currently insures it and at what premium?
- What's the average days-on-market for RENTAL listings here right now (not sales)? A rising rental-DOM trend means longer vacancies and softer asking-rent achievability than the comps imply.
- What's the recent tenant-quality profile in this submarket — average credit score on applications, eviction rate, late-payment / NSF rate, and stable-employment percentage? A property-management company in the area should have these aggregated.
- How much new for-sale + rental construction is in the pipeline within 1–3 miles? Heavy new supply typically softens prices + rents 12–24 months out; constrained supply supports both.
Investment metrics
- 1% rule
- 1.19% ✓
- Cap rate
- 9.97%
- Cash-on-cash
- 13.14%
- DSCR
- 1.58
- GRM
- 7.0
CMA / ARV
- ARV (on-the-fly)
- $83,720
- Comps found
- 12
Show comp detail 12 sales within ~0.75 mi
| Address | Dist | Beds/Ba | Sqft | Sold | Price | $/sf | Match |
|---|---|---|---|---|---|---|---|
| 633 Madison Ave | 0.33mi | 3/1.0 | 1,308 (+2%) | 2mo | $44,000 | $34 | 80 |
| 677 Crossings Ln | 0.07mi | 3/2.5 | 1,440 (+12%) | 1mo | $220,000 | $153 | 70 |
| 564 Euclid Ave | 0.55mi | 3/1.5 | 1,300 (+1%) | 3mo | $57,500 | $44 | 69 |
| 322 Madison Ave | 0.50mi | 3/2.0 | 1,328 (+3%) | 1mo | $49,000 | $37 | 67 |
| 379 Noble Ave | 0.51mi | 3/1.0 | 1,224 (-5%) | 2mo | $90,000 | $74 | 66 |
| 404 Noah Ave | 0.58mi | 3/1.0 | 1,192 (-8%) | 1mo | $77,500 | $65 | 60 |
| 1041 Diagonal Rd | 0.65mi | 3/1.5 | 1,332 (+3%) | 3mo | $30,000 | $23 | 59 |
| 123 Gale St | 0.61mi | 3/2.0 | 1,240 (-4%) | 4mo | $96,500 | $78 | 58 |
| 615 Noah Ave | 0.54mi | 3/1.5 | 1,418 (+10%) | 2mo | $158,000 | $111 | 54 |
| 910 Bye St | 0.43mi | 4/1.0 (+1) | 1,457 (+13%) | 1mo | $102,000 | $70 | 52 |
| 978 Delia Ave | 0.68mi | 2/1.5 (-1) | 1,199 (-7%) | 1mo | $42,500 | $35 | 48 |
| 801 Storer Ave | 0.60mi | 4/1.0 (+1) | 1,423 (+10%) | 3mo | $72,500 | $51 | 47 |
Match score weights: distance 35% · size 25% · config 20% · recency 20%. Top-matched comps best support the ARV.
Projected returns pro-forma
-3.0% appreciation · 1.65% rent growth · sell at horizon
- IRR
- 1.6%
- Equity multiple
- 1.06×
- Total profit
- $1,881
- Equity at exit
- $16,386
- IRR
- 9.9%
- Equity multiple
- 1.72×
- Total profit
- $22,198
- Equity at exit
- $9,502
Cash invested: $30,772 (down + closing). Projections, not guarantees.
Landlord ↔ Tenant lean methodology
- Overall (STATE)
- 73 Landlord-Friendly
- State Ohio
- 73 Landlord-Friendly · R+6
- County
- — inherits STATE
- City
- — inherits STATE
ZIP-level market 44320
- Rents YoY
- 1.6%
- Active inventory
- 102
- Price-to-rent
- 7.0×
Monthly cashflow live
- Estimated rent
- $1,307 high interval (Pro) →
- Mortgage (P&I)
- −$576
- Tax from tax record
- −$73 /mo · $880/yr
- Insurance
- −$46
- HOA
- −$0
- Vacancy / Maint / Mgmt
- −$274
- Net cashflow
- $337
Break-even live
UW: 25.0% down · 7.5% · 30yr · 1.5% tax · 5.0% vac · 8.0% maint · 8.0% mgmt
Financing live
Cash to close
- Down payment
- $27,475
- Closing costs
- $3,297
- Reserves months
- —
- Total cash needed
- —
Loan-product check · same deal, 3 products live
Conventional
25% down · 7.5% · 30yr
- Down + closing
- —
- Monthly P&I
- —
- Monthly cashflow
- —
- DSCR
- —
- Eligible?
- —
Personal DTI + credit; lowest rate.
DSCR
20% down · 8.5% · 30yr
- Down + closing
- —
- Monthly P&I
- —
- Monthly cashflow
- —
- DSCR
- —
- Eligible?
- —
No personal income docs; deal must DSCR.
Hard money
10% down · 12.0% · 12mo
- Down + closing
- —
- Monthly P&I
- —
- Monthly cashflow
- —
- DSCR
- —
- Eligible?
- —
Short-term bridge; refi at stabilization.
Rent comps 40 comps
| Address | Beds | Baths | Sqft | Rent | $/sqft | DOM | Units | Dist |
|---|---|---|---|---|---|---|---|---|
| 677 Crossings Ln Akron, OH | 3.0 | 2.5 | 1440 | $1,950 | $1.35 | 23d | 1 | 0.05mi |
| 378 Trigonia Dr Akron, OH | 3.0 | 1.5 | 1090 | $1,200 | $1.10 | 43d | 1 | 0.30mi |
| 378 Wildwood Ave Akron, OH | 4.0 | 1.0 | 1544 | $1,200 | $0.78 | 43d | 1 | 0.36mi |
| 916 Peckham St Akron, OH | 2.0 | 1.0 | 936 | $850 | $0.91 | 43d | 1 | 0.38mi |
| 445 S Maple St Akron, OH | 3.0 | 1.5 | 1041 | $1,240 | $1.19 | 43d | 7 | 0.39mi |
| 844 Lawton St Akron, OH | 4.0 | 2.0 | 1240 | $1,175 | $0.95 | 43d | 1 | 0.41mi |
| 924 Hamlin St Akron, OH | 3.0 | 1.0 | 1106 | $1,300 | $1.18 | 43d | 1 | 0.43mi |
| 575 Noble Ave Akron, OH | 3.0 | 1.0 | 1300 | $1,350 | $1.04 | 14d | 1 | 0.46mi |
| 918 Bye St Akron, OH | 3.0 | 1.0 | 1248 | $1,200 | $0.96 | 43d | 1 | 0.47mi |
| 199 Beck Ave Unit 2 Akron, OH | 2.0 | 1.0 | 926 | $1,300 | $1.40 | 23d | 1 | 0.51mi |
| 321 Grace Ave Akron, OH | 3.0 | 2.0 | 1484 | $1,175 | $0.79 | 14d | 1 | 0.52mi |
| 724 Crosby St Unit 1 Akron, OH | 2.0 | 1.0 | 1582 | $995 | $0.63 | 43d | 1 | 0.55mi |
| 724 Crosby St Akron, OH | 2.0 | 1.0 | 1582 | $995 | $0.63 | 23d | 1 | 0.55mi |
| 202 Westwood Ave Akron, OH | 3.0 | 1.0 | 1344 | $1,250 | $0.93 | 14d | 1 | 0.55mi |
| 405 Noah Ave Akron, OH | 2.0 | 1.0 | 1000 | $1,050 | $1.05 | 21d | 1 | 0.57mi |
| 678 Crosby St Unit 3 Akron, OH | 2.0 | 1.0 | 1000 | $780 | $0.78 | 43d | 1 | 0.57mi |
| 713 Crosby St Unit 1496092P Akron, OH | 3.0 | 2.0 | 1840 | $5,078 | $2.76 | 21d | 1 | 0.58mi |
| 637 Storer Ave Akron, OH | 3.0 | 1.5 | 1322 | $1,250 | $0.95 | 14d | 1 | 0.59mi |
| 961 Lawton St Akron, OH | 3.0 | 1.0 | 1144 | $1,450 | $1.27 | 14d | 1 | 0.60mi |
| 730 Noble Ave Akron, OH | 3.0 | 1.0 | 1092 | $1,200 | $1.10 | 23d | 1 | 0.61mi |
| 152 S Balch St Akron, OH | 3.0 | 1.5 | 1000 | $1,195 | $1.20 | 43d | 1 | 0.63mi |
| 502 Evelyn Ct Akron, OH | 2.0 | 1.0 | 900 | $950 | $1.06 | 43d | 1 | 0.63mi |
| 295 Noble Ave Akron, OH | 3.0 | 2.5 | 1488 | $1,600 | $1.08 | 43d | 1 | 0.64mi |
| 627 Crosby St Unit B Akron, OH | 4.0 | 1.0 | 1200 | $875 | $0.73 | 43d | 1 | 0.64mi |
| 91 Westwood Ave Akron, OH | 3.0 | 1.0 | 1631 | $1,450 | $0.89 | 14d | 1 | 0.70mi |
| 80 Byers Ave Unit A Akron, OH | 2.0 | 1.0 | 900 | $995 | $1.11 | 43d | 1 | 0.73mi |
| 53 S Balch St Unit 55 Akron, OH | 2.0 | 1.0 | 1500 | $850 | $0.57 | 14d | 1 | 0.78mi |
| 55 S Balch St Unit A Akron, OH | 2.0 | 1.0 | 1500 | $800 | $0.53 | 23d | 1 | 0.79mi |
| 45 Oakdale Ave Unit A Akron, OH | 2.0 | 1.0 | 1000 | $875 | $0.88 | 23d | 1 | 0.82mi |
| 45 Oakdale Ave Akron, OH | 2.0 | 1.0 | 1000 | $900 | $0.90 | 14d | 1 | 0.82mi |
| 311 Crestwood Ave Akron, OH | 4.0 | 2.0 | 1800 | $1,395 | $0.78 | 43d | 1 | 0.89mi |
| 384 W Bartges St Akron, OH | 2.0 | 1.0 | 1024 | $1,100 | $1.07 | 43d | 1 | 0.91mi |
| 1092 Peerless Ave Akron, OH | 3.0 | 1.0 | 998 | $1,200 | $1.20 | 43d | 1 | 0.93mi |
| 601 Glendora Ave Akron, OH | 3.0 | 1.0 | 1310 | $1,200 | $0.92 | 43d | 1 | 0.95mi |
| 39 N Balch St Akron, OH | 4.0 | 1.0 | 1000 | $995 | $0.99 | 43d | 1 | 0.97mi |
| 991 Diana Ave Akron, OH | 3.0 | 2.0 | 1264 | $1,325 | $1.05 | 43d | 1 | 0.97mi |
| 900 W Market St Akron, OH | 2.0–3.0 | 1.5–2.0 | 1880 | $2,340 | $1.24 | 23d | 6 | 0.98mi |
| 783 Leonard St Akron, OH | 3.0 | 1.0 | 1040 | $1,250 | $1.20 | 43d | 1 | 1.05mi |
| 1142 Jefferson Ave Unit 2 Akron, OH | 3.0 | 1.0 | 1200 | $1,150 | $0.96 | 43d | 1 | 1.05mi |
| 207 Crosby St Akron, OH | 4.0 | 1.0 | 1200 | $1,395 | $1.16 | 43d | 1 | 1.08mi |
Listing history 6 events
-
2026-06-18days on market $109,900 Active 5 DOM
-
2026-06-17days on market $109,900 Active 4 DOM
-
2026-06-16days on market $109,900 Active 3 DOM
-
2026-06-15days on market $109,900 Active 2 DOM
-
2026-06-14remarks 693-char remark
-
2026-06-14$109,900 Active 1 DOM
ⓘ Source: listings_history table (triggers on properties + properties_extension) + one-shot
backfill from property_details.listing_events for pre-trigger history.
Tax reassessment forecast OH · Partial reset (capped growth)
- Current annual tax
- $880 · $73/mo
- Projected year-2 tax
- $1,297 · $108/mo
- Expected delta
- +$417/yr (+$35/mo · 47.4%)
ⓘ Screening estimate from a state-policy table — verify with the county assessor before closing.
Climate risk First Street
- Flood 1/10 Low FEMA zone X (unshaded) · 0% chance over 30 yrs
- Wildfire 1/10 Low
- Heat 3/10 Moderate 7 d/yr ≥97°F today · 16 d/yr by 30 yrs out
- Wind 1/10 Low
- Air quality 3/10 Moderate 2 unhealthy d/yr today · 4 by 30 yrs out
Nearby sold comps map
Loading sold comps map…
Walkable amenities ~0.75 mi
Loading nearby amenities…
Taxation est. · year 1
- Rental income
- $15,682
- − Mortgage interest
- −$6,156
- − Property taxes
- −$880
- − Insurance
- −$550
- − Repairs & maintenance
- −$1,255
- − Management
- −$1,255
- − Depreciation
- −$3,197
- Taxable income
- $2,390
- Est. tax owed @ 24.0%
- −$574
- After-tax cash flow
- $3,470/yr
For passive investors: Depreciation is non-cash, so a rental often shows a tax loss while cash-flowing — sheltering income. Rental losses are passive: they offset passive income freely, and up to $25,000/yr can offset ordinary (W-2) income if you actively participate and your MAGI is under $100k (phasing out to $0 by $150k); unused losses carry forward. On sale, claimed depreciation is recaptured at up to 25%, and gains may owe capital-gains tax (a 1031 exchange can defer both). Figures are a year-1 estimate at your 24.0% rate — not tax advice; consult a CPA.
Schools (NCES district)
- District
- Akron City
- NCES district ID
- 3904348
- Math proficiency
- 22% ▼ -17.00%
- Reading proficiency
- 30% ▼ -12.00%
- Median HH income
- $33,811
- Composite
- 21.31/100
- National rank
- #8383
- State rank
- #602 of 656 in OH
Livability — Akron
- Score
- 81/100
- State rank
- #104
- US rank
- #1591
Category grades
Schools grade is shown separately in the Schools card above.
Census & demographics
- Census place
- Akron, OH
- County
- Summit County · 440,783 people
- City population
- 174,375
- Metro
- Akron, OH
- Population (ZIP)
- 17,690
- Household income
- $41,241
- Rent vs Own
- Severe rent burden
- 1316.0
Population outlook (Summit County) Hauer SSP2
- Today (2025)
- 546,583 people
- By 2030
- 544,028 · -0.5%
- By 2040
- 531,363 · -2.8%
- By 2050
- 514,923 · -5.8%
- By 2075
- 481,765 · -11.9%
- By 2100
- 432,265 · -20.9%
Race, ethnicity, and origin ACS 2023
- Neighborhood character
- Majority Black (63%)
- Race & ethnicity
- Black 63% White 27% Two or more races 7% Hispanic / Latino 4%
- Common ancestry
- Romanian 2% Italian 1% Scotch-Irish 1%
- Foreign-born
- 2% · Canada
- Languages at home
- 97% English-only · Spanish 1% Other Indo-European 1%
Political lean MEDSL · Summit
- 2024 margin
- Lean D (+7.0) · D 53.0% · R 46.0%
- 2008→2024 swing
- -9.6pp toward R · 2008: 16.6pp · 2024: 7.0pp
- All cycles
- 2024: D+7.0 2020: D+9.6 2016: D+8.2 2012: D+14.8 2008: D+16.6
Not yet ingested
- Civics
- —
Market trends
- HPI YoY
- ▼ -117.69%
- Current HPI
- 122.9888
- Rent YoY
- ▲ 1.65%
- Metro
- Akron, OH
- State GDP YoY
- ▲ 1.98%
- F500 in state
- 48
Industry mix (Fortune 500 HQ in OH)
| Industry | F500 HQs | Revenue |
|---|---|---|
| Insurance | 3 | $145B |
|
||
| Industrial Machinery | 3 | $49B |
|
||
| Financial Services | 3 | $24B |
|
||
| Consumer Goods | 2 | $93B |
|
||
| Aerospace / Defense | 2 | $47B |
|
||
| Utilities | 2 | $33B |
|
||
Price history
+461.3% since first listed15 events — show timeline
- 2026-06-13 Listed $109,900 MLSNOW
- 2018-12-10 Sold (MLS) $22,470 MLSNOW
- 2018-11-02 Pending — MLSNOW
- 2018-09-27 Listed $29,900 MLSNOW
- 2014-09-13 Listing Removed — MLSNOW
- 2014-03-13 Listed $24,900 MLSNOW
- 2014-01-15 Listing Removed — MLSNOW
- 2013-01-15 Listed $34,900 MLSNOW
- 2012-11-07 Listing Removed — MLSNOW
- 2012-05-07 Listed $49,900 MLSNOW
- 1999-11-05 Listing Removed — MLSNOW
- 1999-08-03 Listed $54,900 MLSNOW
- 1995-07-28 Sold (Public Records) $12,500 Public Records
- 1995-06-28 Listed $21,000 MLSNOW
- 1992-10-14 Sold (Public Records) $19,580 Public Records
Property tax history
-1.4%/yrLatest (2025): $880 · +0.1% YoY. Source: county tax records.
Cash-flow waterfall
monthlySold comps — $/sqft
last 12 mo · ≤1 miLoading sold comps…