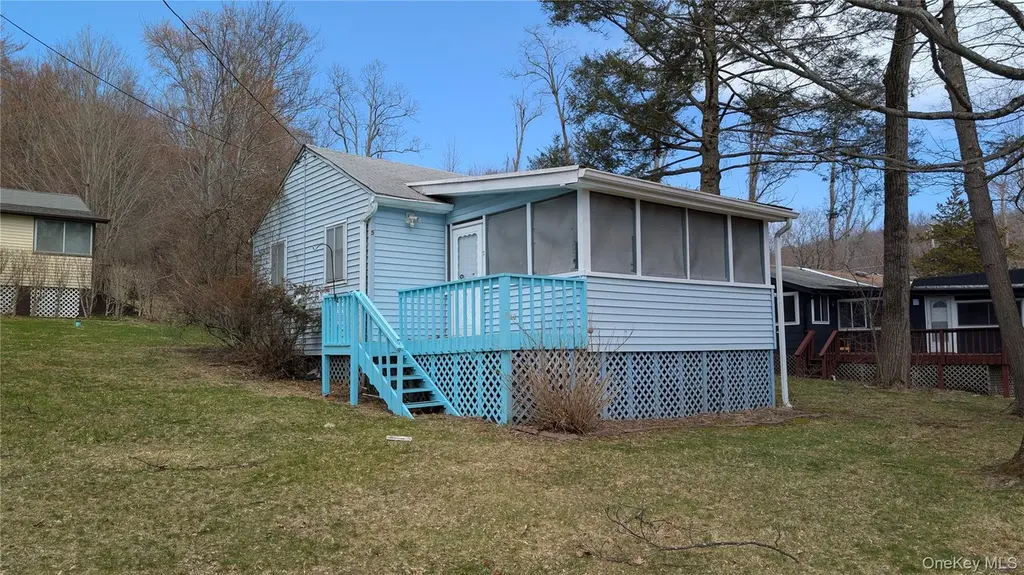
191 Sylvan Lake Rd #5 · Chelsea Cove, NY
Flood risk 1/10 · Minimal
- FEMA flood zone
- X (unshaded)
- Chance of flooding over 30 yrs
- 0.0%
- Est. flood insurance / yr
- $507 – $1,088
Fire risk 5/10 · Moderate
- Est. fire insurance / yr
- $691 – $1,283
Heat risk 4/10 · Minor
- Hot days now (above 98°F)
- 7 days/yr
- Hot days in 30 yrs
- 15 days/yr
Wind risk 4/10 · Minor
- Chance of severe wind over 30 yrs
- 14.0%
Air-quality risk 3/10 · Minor
- Unhealthy air days now
- 2 days/yr
- Unhealthy air days in 30 yrs
- 3 days/yr
Risk factors via First Street. Map © Google.
Why this score? — see what drove the B- grade
The composite is a weighted blend of 9 inputs, each scored 0–100. Each bar is that input's sub-score; the figure is the points it added to the 100-point composite (weight × sub-score).
- Cash flow +30.0/30.0
- 1% rule +10.0/10.0
- DSCR +10.0/10.0
- Schools +6.3/10.0
- ARV discount +3.5/15.0
- Rent growth +2.5/5.0
- Livability +2.5/5.0
- Condition / age +2.2/5.0
- Appreciation +0.0/10.0
$70,000
🖨 Deal sheet 📄 Offer letter ✓ Due diligence
Listing remarks MLS
Find your getaway! Jump on the rare opportunity to own a detached home at View Hill. This 2 bed, 1 bath cabin, in a private seasonal community (Occupancy April 15-October 15) is move in ready and can come furnished as seen at buyer’s request. Enter onto a freshly painted deck and proceed through a large and inviting screened porch in front of the home. Continue into the Dine-in kitchen located in the center of the home. A new living room with sliding glass door to the backyard and a pass-through from the kitchen provides an easy flow throughout the home. 2 well-sized bedrooms and a newly renovated bathroom with heated lamp completes the living space. A full-span attic is available for storage, if needed. The View Hill community offers beautiful grounds, a pool, volleyball area, clubhouse with a pool table, playground, on site laundry, both assigned and Guest parking and 11 acres of serene landscape. Sylvan Lake boating site, tennis, golf are all nearby. Only 1.15 hours from NYC as per Google Maps. Find your weekend/summer escape and make an offer!
Key facts
- New living room
- Freshly painted deck
- Dine-in kitchen
Tags
Neighborhood map
What this means for you Summary
Snapshot
- This is a 2-bed/1.0-bath condo listed at $70k. Condition is rated fair.
Deal economics
- At list price, monthly cash flow is $1k ($13k/yr) — positive.
- The deal already cash-flows at list — no discount required.
- Meets the 1% rule at list price ($2k rent vs $70k).
- Recommended offer: $66k (6.0% below list) — sets the bar for market timing.
- Cap rate 25.3% vs local median 2.5% in Chelsea Cove — top-decile yield for the area; either an underpriced asset or a hidden risk that comps aren't pricing in. Stress-test before assuming the spread holds.
Location & tenants
- Location reads: area grade B — affects rentability + tenant quality, not the cash-flow math above.
- Arlington Central School District (suburban): math 77% / reading 65% proficiency, ranked #106 of 590 in NY (top 18%) — strong family-tenant draw, lease renewals of 3-5y typical; only 16% free/reduced lunch — higher-income household profile.
- Market conditions: 202 active listings in the ZIP; 1 comparable units currently listed for rent nearby; high-income renter base; 620 units permitted in Dutchess County in 2024 (242 in 5+ unit buildings).
- This rent is only 17% of the median local income ($142k/yr) — well below the 30% rent-burden line; pricing power to push rent on renewal without tenant pushback.
Forward outlook
- Local home prices are declining (-3.0%/yr); year-one equity from $484 of loan paydown is wiped out by about $2k of value loss. Plan a longer hold.
- Dutchess County population projected at -11% by 2050 — secular population decline; favor cash flow + early exit over multi-decade hold.
- At projected returns (-3.0% appreciation + 3.0% rent growth), your $20k cash investment doubles in ~2 years — after that, you're playing with house money.
Negotiation context
- It's been on market 70 days — a 6% lower offer ($66k) is reasonable based on typical stale-listing flexibility.
- 2 sale attempts with the ask held roughly flat each time — persistent listings suggest the price (not the market) is what's stuck; bring a comps-based counter.
Risks & watch-outs
- Watch-outs: built in 1940 — expect roof / HVAC / electrical / plumbing capex.
- Climate carrying-cost: moderate wildfire risk — expect insurance premiums to compound above CPI over the hold.
Questions for the listing agent
- It's been on market 70 days. Have you received any prior offers? Is the seller open to a 6% concession, seller financing, or rate buy-down credit?
- Have any recent inspections been done? Can we get a copy of the seller's disclosures and any deferred-maintenance estimates?
- Built in 1940 — when were the roof, HVAC, electrical panel, plumbing, and water heater last replaced?
- Any open or pending special assessments — roof, HVAC, plumbing, elevator, façade? What's the per-unit balance and payoff schedule, and is the seller paying it off at close or rolling it to the buyer?
- Why hasn't it sold? Are there any deal-killer items the seller is aware of (foundation, flood, title, zoning, code violations)?
- Is there a deadline driving the sale (1031 exchange, divorce, estate, relocation)? That informs how much negotiation room exists.
- What's the average days-on-market for RENTAL listings here right now (not sales)? A rising rental-DOM trend means longer vacancies and softer asking-rent achievability than the comps imply.
- What's the recent tenant-quality profile in this submarket — average credit score on applications, eviction rate, late-payment / NSF rate, and stable-employment percentage? A property-management company in the area should have these aggregated.
- How much new apartment / multifamily construction is in the pipeline within 1–3 miles? Heavy new supply (>2% of stock underway) typically softens rents 12–24 months out; light construction supports rent growth.
Investment metrics
- 1% rule
- 2.88% ✓
- Cap rate
- 25.29%
- Cash-on-cash
- 67.84%
- DSCR
- 4.02
- GRM
- 2.9
CMA / ARV
- ARV (median comp)
- $64,292
- List price
- $70,000
- Delta
- 8.88%
- Verdict
- FAIR
- Comps
- 20 within 1.0 mi
Projected returns pro-forma
-3.0% appreciation · 3.0% rent growth · sell at horizon
- IRR
- 67.2%
- Equity multiple
- 4.02×
- Total profit
- $59,262
- Equity at exit
- $10,437
- IRR
- 71.4%
- Equity multiple
- 8.28×
- Total profit
- $142,603
- Equity at exit
- $6,052
Cash invested: $19,600 (down + closing). Projections, not guarantees.
Landlord ↔ Tenant lean methodology
- Overall (STATE)
- 15 Strongly Tenant-Friendly
- State New York
- 15 Strongly Tenant-Friendly · D+10
- County
- — inherits STATE
- City
- — inherits STATE
ZIP-level market 12533
- Active inventory
- 202
- Price-to-rent
- 2.9×
Monthly cashflow live
- Estimated rent
- $2,015 medium interval (Pro) →
- Mortgage (P&I)
- −$367
- Tax est. 1.5%
- −$88 /mo · $1,050/yr
- Insurance
- −$29
- HOA
- −$0
- Vacancy / Maint / Mgmt
- −$423
- Net cashflow
- $1,108
Break-even live
UW: 25.0% down · 7.5% · 30yr · 1.5% tax · 5.0% vac · 8.0% maint · 8.0% mgmt
Financing live
Cash to close
- Down payment
- $17,500
- Closing costs
- $2,100
- Reserves months
- —
- Total cash needed
- —
Loan-product check · same deal, 3 products live
Conventional
25% down · 7.5% · 30yr
- Down + closing
- —
- Monthly P&I
- —
- Monthly cashflow
- —
- DSCR
- —
- Eligible?
- —
Personal DTI + credit; lowest rate.
DSCR
20% down · 8.5% · 30yr
- Down + closing
- —
- Monthly P&I
- —
- Monthly cashflow
- —
- DSCR
- —
- Eligible?
- —
No personal income docs; deal must DSCR.
Hard money
10% down · 12.0% · 12mo
- Down + closing
- —
- Monthly P&I
- —
- Monthly cashflow
- —
- DSCR
- —
- Eligible?
- —
Short-term bridge; refi at stabilization.
Rent comps 1 comps
| Address | Beds | Baths | Sqft | Rent | $/sqft | DOM | Units | Dist |
|---|---|---|---|---|---|---|---|---|
| 71 Miller Rd Hopewell Junction, NY | 2.0–4.0 | 1.0–2.0 | 750 | $1,900 | $2.53 | 43d | 3 | 0.48mi |
HOA detail condo
- Monthly dues
- $0 · $0/yr
- Likely covers
- landscapingpool
- Assessments
- None detected in remarks — confirm with the listing agent.
Listing history 20 events
-
2026-06-18days on market $70,000 Active 70 DOM
-
2026-06-17days on market $70,000 Active 69 DOM
-
2026-06-16days on market $70,000 Active 68 DOM
-
2026-06-15days on market $70,000 Active 67 DOM
-
2026-06-14days on market $70,000 Active 65 DOM
-
2026-06-10days on market $70,000 Active 62 DOM
-
2026-06-09days on market $70,000 Active 61 DOM
-
2026-06-08days on market $70,000 Active 60 DOM
-
2026-06-07days on market $70,000 Active 59 DOM
-
2026-06-03days on market $70,000 Active 55 DOM
-
2026-06-02days on market $70,000 Active 54 DOM
-
2026-06-01days on market $70,000 Active 53 DOM
-
2026-05-31days on market $70,000 Active 52 DOM
-
2026-05-30days on market $70,000 Active 51 DOM
-
2026-04-09$70,000 Active 1077-char remark
Show marketing remark (1077 chars)
Find your getaway! Jump on the rare opportunity to own a detached home at View Hill. This 2 bed, 1 bath cabin, in a private seasonal community (Occupancy April 15-October 15) is move in ready and can come furnished as seen at buyer’s request. Enter onto a freshly painted deck and proceed through a large and inviting screened porch in front of the home. Continue into the Dine-in kitchen located in the center of the home. A new living room with sliding glass door to the backyard and a pass-through from the kitchen provides an easy flow throughout the home. 2 well-sized bedrooms and a newly renovated bathroom with heated lamp completes the living space. A full-span attic is available for storage, if needed. The View Hill community offers beautiful grounds, a pool, volleyball area, clubhouse with a pool table, playground, on site laundry, both assigned and Guest parking and 11 acres of serene landscape. Sylvan Lake boating site, tennis, golf are all nearby. Only 1.15 hours from NYC as per Google Maps. Find your weekend/summer escape and make an offer!
-
2025-11-02historical
-
2025-10-01price $65,000
-
2025-07-29price $75,000
-
2025-06-16price $80,000
-
2025-05-27$90,000 Active
ⓘ Source: listings_history table (triggers on properties + properties_extension) + one-shot
backfill from property_details.listing_events for pre-trigger history.
Climate risk First Street
- Flood 1/10 Low FEMA zone X (unshaded) · 0% chance over 30 yrs
- Wildfire 5/10 Major
- Heat 4/10 Moderate 7 d/yr ≥98°F today · 15 d/yr by 30 yrs out
- Wind 4/10 Moderate 14% chance of damaging wind over 30 yrs
- Air quality 3/10 Moderate 2 unhealthy d/yr today · 3 by 30 yrs out
Nearby sold comps map
Loading sold comps map…
Walkable amenities ~0.75 mi
Loading nearby amenities…
Taxation est. · year 1
- Rental income
- $24,180
- − Mortgage interest
- −$3,921
- − Property taxes
- −$1,050
- − Insurance
- −$350
- − Repairs & maintenance
- −$1,934
- − Management
- −$1,934
- − Depreciation
- −$2,036
- Taxable income
- $12,954
- Est. tax owed @ 24.0%
- −$3,109
- After-tax cash flow
- $10,188/yr
For passive investors: Depreciation is non-cash, so a rental often shows a tax loss while cash-flowing — sheltering income. Rental losses are passive: they offset passive income freely, and up to $25,000/yr can offset ordinary (W-2) income if you actively participate and your MAGI is under $100k (phasing out to $0 by $150k); unused losses carry forward. On sale, claimed depreciation is recaptured at up to 25%, and gains may owe capital-gains tax (a 1031 exchange can defer both). Figures are a year-1 estimate at your 24.0% rate — not tax advice; consult a CPA.
Condition & rehab AI · 12 photos
This home requires moderate renovations to improve its condition and increase its value. Key areas for improvement include the kitchen, bathroom, exterior, and HVAC system.
Repairs flagged
- Moderate kitchen cabinets — dated and in need of replacement
- Moderate bathroom fixtures — outdated and in need of replacement
- Moderate exterior siding — visible wear and tear
- Moderate interior walls — wallpaper and paint in need of freshening
- Moderate HVAC system — visible wear and potential inefficiency
Value-add opportunities
- Resale paint exterior — fresh paint can significantly improve curb appeal
- Resale replace kitchen cabinets — new cabinets can enhance the kitchen's functionality and aesthetics
- Resale replace bathroom fixtures — new fixtures can improve the bathroom's functionality and aesthetics
- Resale repair roof — a repaired roof can improve the home's overall condition and value
- Resale repair foundation — a repaired foundation can improve the home's structural integrity and value
- Both landscape yard — a well-maintained yard can improve curb appeal and increase property value
Renovation cost estimate screening
| Repair item | Severity | Est. cost |
|---|---|---|
| kitchen cabinets · dated and in need of replacement | Moderate | $3,000–15,000 |
| bathroom fixtures · outdated and in need of replacement | Moderate | $3,000–15,000 |
| exterior siding · visible wear and tear | Moderate | $3,000–15,000 |
| interior walls · wallpaper and paint in need of freshening | Moderate | $3,000–15,000 |
| HVAC system · visible wear and potential inefficiency | Moderate | $3,000–15,000 |
| Total estimated repair cost · 5 items | $15,000–75,000 |
Value-add ROI direction
- Resale paint exterior — fresh paint can significantly improve curb appeal ↑
- Resale replace kitchen cabinets — new cabinets can enhance the kitchen's functionality and aesthetics ↑
- Resale replace bathroom fixtures — new fixtures can improve the bathroom's functionality and aesthetics ↑
- Resale repair roof — a repaired roof can improve the home's overall condition and value ↑
- Resale repair foundation — a repaired foundation can improve the home's structural integrity and value ↑
- Both landscape yard — a well-maintained yard can improve curb appeal and increase property value ↑
ⓘ Cost ranges are severity-bucket heuristics (US national rule-of-thumb). Get contractor quotes + a written scope before underwriting a rehab budget.
Schools (NCES district)
- District
- Arlington Central School District
- NCES district ID
- 3603270
- Math proficiency
- 77% ▲ 19.00%
- Reading proficiency
- 65% ▲ 12.00%
- Median HH income
- $83,597
- Composite
- 63.47/100
- National rank
- #613
- State rank
- #106 of 590 in NY
Livability — Chelsea Cove
No livability data for this city. (Only ~50 U.S. cities are tracked.)
Census & demographics
- County
- Dutchess County · 188,048 people
- Metro
- Poughkeepsie-Newburgh-Middletown, NY
- Population (ZIP)
- 27,325
- Household income
- $141,585
- Rent vs Own
- Severe rent burden
- 190.0
Population outlook (Dutchess County) Hauer SSP2
- Today (2025)
- 291,768 people
- By 2030
- 287,131 · -1.6%
- By 2040
- 274,881 · -5.8%
- By 2050
- 259,971 · -10.9%
- By 2075
- 235,366 · -19.3%
- By 2100
- 208,786 · -28.4%
Race, ethnicity, and origin ACS 2023
- Neighborhood character
- Predominantly White (67%)
- Race & ethnicity
- White 67% Hispanic / Latino 16% Two or more races 13% Asian 6% Black 5%
- Hispanic origin (detail)
- Mexican 1% Puerto Rican 5% Dominican 3%
- Common ancestry
- Romanian 3% Italian 2% Lithuanian 2%
- Foreign-born
- 12% · Canada, South Korea, China
- Languages at home
- 83% English-only · Spanish 9% Other Indo-European 3% Arabic 2%
Political lean MEDSL · Dutchess
- 2024 margin
- Lean D (+5.4) · D 52.7% · R 47.3%
- 2008→2024 swing
- -3.2pp toward R · 2008: 8.6pp · 2024: 5.4pp
- All cycles
- 2024: D+5.4 2020: D+9.6 2016: R+1.1 2012: D+6.6 2008: D+8.6
Not yet ingested
- Civics
- —
Market trends
- HPI YoY
- ▼ -140.32%
- Current HPI
- 232.2351
- Rent YoY
- —
- Metro
- Poughkeepsie-Newburgh-Middletown, NY
- State GDP YoY
- ▲ 2.60%
- F500 in state
- 92
Industry mix (Fortune 500 HQ in NY)
| Industry | F500 HQs | Revenue |
|---|---|---|
| Financial Services | 10 | $950B |
|
||
| Consumer Goods | 9 | $162B |
|
||
| Insurance | 4 | $225B |
|
||
| Telecommunications | 2 | $144B |
|
||
| Pharmaceuticals | 2 | $112B |
|
||
| Media / Entertainment | 2 | $69B |
|
||
Price history
-22.2% since first listed6 events — show timeline
- 2026-04-09 Listed $70,000 OneKey® MLS as Distributed by MLS Grid
- 2025-11-02 Listing Removed — OneKey® MLS as Distributed by MLS Grid
- 2025-10-01 Price Changed $65,000 OneKey® MLS as Distributed by MLS Grid
- 2025-07-29 Price Changed $75,000 OneKey® MLS as Distributed by MLS Grid
- 2025-06-16 Price Changed $80,000 OneKey® MLS as Distributed by MLS Grid
- 2025-05-27 Listed $90,000 OneKey® MLS as Distributed by MLS Grid
Cash-flow waterfall
monthlySold comps — $/sqft
last 12 mo · ≤1 miLoading sold comps…