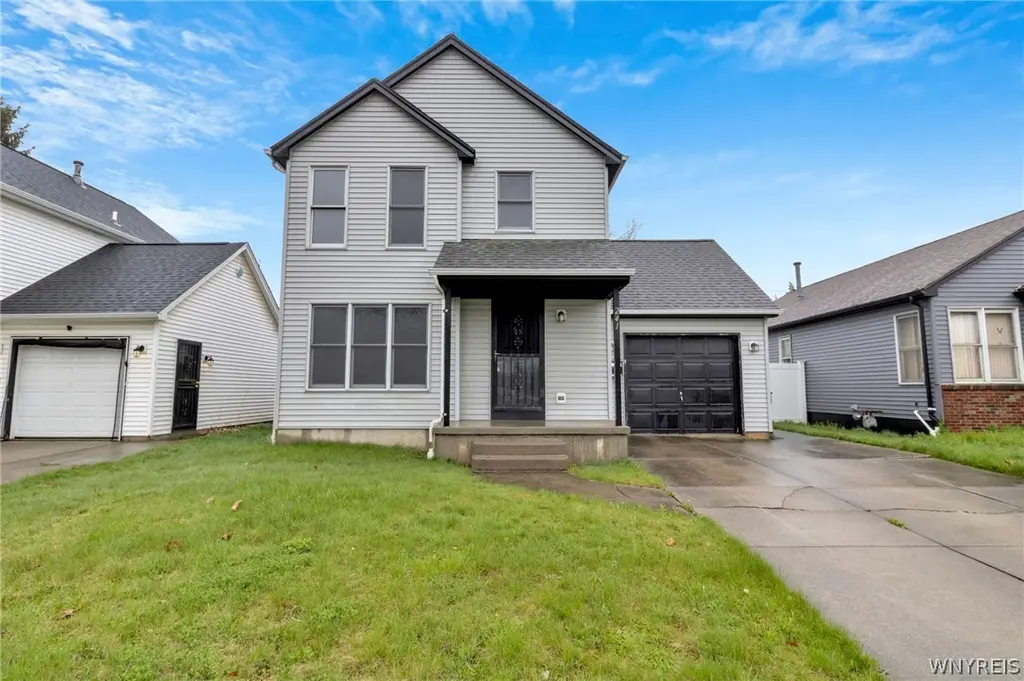
241 S Division St · Buffalo, NY
Flood risk 1/10 · Minimal
- FEMA flood zone
- X (unshaded)
- Chance of flooding over 30 yrs
- 0.0%
- Est. flood insurance / yr
- $473 – $860
Fire risk 1/10 · Minimal
- Est. fire insurance / yr
- $691 – $1,283
Heat risk 3/10 · Minor
- Hot days now (above 91°F)
- 7 days/yr
- Hot days in 30 yrs
- 15 days/yr
Wind risk 1/10 · Minimal
- Chance of severe wind over 30 yrs
- —
Air-quality risk 4/10 · Minor
- Unhealthy air days now
- 4 days/yr
- Unhealthy air days in 30 yrs
- 9 days/yr
Risk factors via First Street. Map © Google.
Why this score? — see what drove the B- grade
The composite is a weighted blend of 9 inputs, each scored 0–100. Each bar is that input's sub-score; the figure is the points it added to the 100-point composite (weight × sub-score).
- Cash flow +22.0/30.0
- ARV discount +15.0/15.0
- DSCR +7.0/10.0
- 1% rule +5.8/10.0
- Rent growth +3.9/5.0
- Livability +3.9/5.0
- Appreciation +3.3/10.0
- Schools +3.3/10.0
- Condition / age +2.5/5.0
$214,900
🖨 Deal sheet 📄 Offer letter ✓ Due diligence
Listing remarks
Welcome to 241 South Division. This spacious, newer construction Colonial is ready for its new owner. Conveniently situated in the vibrant Willert Park neighborhood of Buffalo, this move-in ready home is close to all of the amenities and experiences downtown and the waterfront have to offer. A maintenance-free vinyl exterior and inviting covered porch welcome you into this special property. As you enter, brand new carpeting and bright white baseboard trim seamlessly flows throughout the main level floor plan featuring a large living room, formal dining room and expansive family room. The freshly painted and applianced kitchen boasts solid wood cabinetry and provides easy access to a conveni
Key facts
- Covered porch
- Solid wood cabinetry
- Brand new carpeting
Tags
Property features AI
Finance
- Other: Resale property
Exterior
- Parking: Attached garage with 1 garage space; Garage door opener; On-site storage
- Utilities: Electric connected (circuit breakers); Public water connected; Sewer connected; Cable available; High-speed internet available; Photovoltaic power production (solar); Gas water heater
- Home design: 2-story residence; Existing condition; City street frontage; Rectangular residential lot (approx. 43 x 120)
- Construction: Vinyl siding; Copper plumbing; Poured foundation; Asphalt architectural shingle roof
- Exterior features: Concrete driveway; Fully fenced yard; Private yard; Covered porch; See remarks
Interior
- Kitchen: Gas oven; Gas range; Dishwasher; Refrigerator
- Bedrooms: Total rooms include living, family, bonus, recreation, sunroom/Florida room, entry foyer and storage (bedroom count not explicitly provided)
- Flooring: Carpet; Laminate; Varies
- Bathrooms: 1 full bathroom; 1 half bathroom; 1 main-level bathroom
- Heating & cooling: Gas forced-air heating
- Interior features: Ceiling fans; Separate/formal dining room; Entrance foyer; Separate/formal living room; Pantry; Storage; Natural woodwork; Thermal windows
- Laundry & utility: Washer and dryer; Laundry located in basement
Neighborhood map
What this means for you Summary
Snapshot
- This is a 3-bed/1.5-bath single-family listed at $215k.
Deal economics
- At list price, monthly cash flow is $341 ($4k/yr) — positive.
- The deal already cash-flows at list — no discount required.
- Meets the 1% rule at list price ($2k rent vs $215k).
Location & tenants
- Location reads 77/100 on livability (#195 in NY, #3,011 nationally) — a middle-class / working-renter tenant base. Strengths: commute A+, housing A+, health & safety A+; Watch: crime F, employment D-.
- Buffalo City School District (urban): math 41% / reading 40% proficiency, ranked #535 of 590 in NY (top 91%) — families likely to look elsewhere, expect single-tenant / working-renter base with shorter leases; 75% free/reduced lunch — lower-income household profile, screen leases tightly.
- Market conditions: Rents rising fast (+5.5%/yr); 33 active listings in the ZIP; 28 comparable units currently listed for rent nearby; rentals at typical pace (median 24d on market — plan ~3-4 weeks tenant-placement turnaround); lower-income renter base — watch delinquency; 1,244 units permitted in Erie County in 2024 (563 in 5+ unit buildings).
- At $2,311/mo this rent would consume 98% of the median local household income ($28k/yr) (locally 945% of renters already pay >50% of income on rent) — very limited rent-growth headroom before tenants either downsize or default.
Forward outlook
- Local home prices are declining (-3.0%/yr); year-one equity from $1k of loan paydown is wiped out by about $6k of value loss. Plan a longer hold.
- At projected returns (-3.0% appreciation + 5.5% rent growth), your $60k cash investment doubles in ~10 years — after that, you're playing with house money.
Negotiation context
- Only 5 days on market — expect competitive offers; lowballing is unlikely to land.
- 2 sale attempts since 2y ago with the ask held roughly flat each time — persistent listings suggest the price (not the market) is what's stuck; bring a comps-based counter.
Questions for the listing agent
- Is there a deadline driving the sale (1031 exchange, divorce, estate, relocation)? That informs how much negotiation room exists.
- Crime grade is F in this area — have there been break-ins, vandalism, or insurance claims at this property in the last 3 years? What carrier currently insures it and at what premium?
- What's the average days-on-market for RENTAL listings here right now (not sales)? A rising rental-DOM trend means longer vacancies and softer asking-rent achievability than the comps imply.
- What's the recent tenant-quality profile in this submarket — average credit score on applications, eviction rate, late-payment / NSF rate, and stable-employment percentage? A property-management company in the area should have these aggregated.
- How much new for-sale + rental construction is in the pipeline within 1–3 miles? Heavy new supply typically softens prices + rents 12–24 months out; constrained supply supports both.
Investment metrics
- 1% rule
- 1.08% ✓
- Cap rate
- 8.19%
- Cash-on-cash
- 6.79%
- DSCR
- 1.30
- GRM
- 7.7
CMA / ARV
- ARV (median comp)
- $284,680
- List price
- $214,900
- Delta
- -24.51%
- Verdict
- UNDERPRICED
- Comps
- 20 within 1.0 mi
Show comp detail 11 sales within ~0.75 mi
| Address | Dist | Beds/Ba | Sqft | Sold | Price | $/sf | Match |
|---|---|---|---|---|---|---|---|
| 404 Seneca St | 0.30mi | 3/1.5 | 1,461 (+3%) | 17mo | $245,000 | $168 | 67 |
| 228 Pine St | 0.37mi | 3/1.5 | 1,360 (-4%) | 11mo | $272,500 | $200 | 66 |
| 234 Walnut St | 0.56mi | 2/1.5 (-1) | 1,380 (-3%) | 5mo | $240,000 | $174 | 60 |
| 228 Sycamore St | 0.72mi | 3/1.5 | 1,442 (+1%) | 9mo | $260,900 | $181 | 56 |
| 231 Pine St | 0.39mi | 2/1.5 (-1) | 1,540 (+8%) | 12mo | $200,000 | $130 | 53 |
| 168 Pine St | 0.28mi | 3/1.5 | 1,564 (+10%) | 21mo | $205,897 | $132 | 53 |
| 219 Jefferson Ave | 0.64mi | 2/2.0 (-1) | 1,360 (-4%) | 5mo | $154,000 | $113 | 52 |
| 541 Perry St | 0.74mi | 3/1.0 | 1,367 (-4%) | 15mo | $72,500 | $53 | 44 |
| 323 Jefferson Ave | 0.67mi | 3/2.0 | 1,220 (-14%) | 5mo | $195,000 | $160 | 39 |
| 595 S Division St | 0.66mi | 3/2.0 | 1,508 (+6%) | 22mo | $235,000 | $156 | 38 |
| 295 Pratt St | 0.71mi | 3/1.5 | 1,324 (-7%) | 22mo | $235,000 | $177 | 37 |
Match score weights: distance 35% · size 25% · config 20% · recency 20%. Top-matched comps best support the ARV.
Projected returns pro-forma
-3.0% appreciation · 5.48% rent growth · sell at horizon
- IRR
- -3.1%
- Equity multiple
- 0.88×
- Total profit
- $-7,189
- Equity at exit
- $32,042
- IRR
- 9.2%
- Equity multiple
- 1.79×
- Total profit
- $47,323
- Equity at exit
- $18,581
Cash invested: $60,172 (down + closing). Projections, not guarantees.
Landlord ↔ Tenant lean methodology
- Overall (STATE)
- 15 Strongly Tenant-Friendly
- State New York
- 15 Strongly Tenant-Friendly · D+10
- County
- — inherits STATE
- City
- — inherits STATE
ZIP-level market 14204
- Home prices YoY
- -1.1%
- Rents YoY
- 5.5%
- Active inventory
- 33
- Price-to-rent
- 7.7×
Monthly cashflow live
- Estimated rent
- $2,311 high interval (Pro) →
- Mortgage (P&I)
- −$1,127
- Tax est. 1.5%
- −$269 /mo · $3,224/yr
- Insurance
- −$90
- HOA
- −$0
- Vacancy / Maint / Mgmt
- −$485
- Net cashflow
- $341
Break-even live
UW: 25.0% down · 7.5% · 30yr · 1.5% tax · 5.0% vac · 8.0% maint · 8.0% mgmt
Financing live
Cash to close
- Down payment
- $53,725
- Closing costs
- $6,447
- Reserves months
- —
- Total cash needed
- —
Loan-product check · same deal, 3 products live
Conventional
25% down · 7.5% · 30yr
- Down + closing
- —
- Monthly P&I
- —
- Monthly cashflow
- —
- DSCR
- —
- Eligible?
- —
Personal DTI + credit; lowest rate.
DSCR
20% down · 8.5% · 30yr
- Down + closing
- —
- Monthly P&I
- —
- Monthly cashflow
- —
- DSCR
- —
- Eligible?
- —
No personal income docs; deal must DSCR.
Hard money
10% down · 12.0% · 12mo
- Down + closing
- —
- Monthly P&I
- —
- Monthly cashflow
- —
- DSCR
- —
- Eligible?
- —
Short-term bridge; refi at stabilization.
Rent comps 28 comps
| Address | Beds | Baths | Sqft | Rent | $/sqft | DOM | Units | Dist |
|---|---|---|---|---|---|---|---|---|
| 149 Swan St #404 Buffalo, NY | 2.0 | 2.0 | 1237 | $2,100 | $1.70 | 23d | 1 | 0.21mi |
| 149 Swan St #404 Buffalo, NY | 2.0 | 2.0 | 1237 | $2,050 | $1.66 | 11d | 1 | 0.21mi |
| 230 Scott St Buffalo, NY | 1.0–2.0 | 1.0–2.0 | 1285 | $2,325 | $1.81 | 1d | 4 | 0.42mi |
| 237 Main St Buffalo, NY | 1.0–3.0 | 1.5–2.5 | 1608 | $4,035 | $2.51 | 1d | 9 | 0.49mi |
| 298 Main St Buffalo, NY | 2.0 | 2.0 | 1768 | $3,400 | $1.92 | 2d | 1 | 0.50mi |
| 465 Washington St Buffalo, NY | 1.0–2.0 | 1.0–2.0 | 1388 | $2,285 | $1.65 | 1d | 5 | 0.51mi |
| 130 Pearl St #304 Buffalo, NY | 2.0 | 1.0 | 1010 | $2,475 | $2.45 | 23d | 1 | 0.56mi |
| 489 Ellicott St Unit 36 Buffalo, NY | 2.0 | 2.0 | 1000 | $1,550 | $1.55 | 2d | 1 | 0.75mi |
| 100 S Elmwood Ave Buffalo, NY | 2.0 | 2.0 | 1254 | $2,232 | $1.78 | 23d | 1 | 0.85mi |
| 100 S Elmwood Ave Buffalo, NY | 2.0 | 2.0 | 1213 | $2,260 | $1.86 | 2d | 2 | 0.85mi |
| 225 Louisiana St Buffalo, NY | 1.0–3.0 | 1.0–2.0 | 1164 | $2,653 | $2.28 | 1d | 7 | 0.90mi |
| 140 Seymour St Buffalo, NY | 2.0 | 1.0 | 1300 | $1,800 | $1.38 | 23d | 1 | 1.01mi |
| 140 Seymour St Unit First Floor Buffalo, NY | 2.0 | 1.0 | 1300 | $1,800 | $1.38 | 3d | 1 | 1.01mi |
| 628 Ellicott St Buffalo, NY | 1.0–2.0 | 1.0–2.0 | 1059 | $2,812 | $2.65 | 2d | 5 | 1.02mi |
| 17 N Pearl St Buffalo, NY | 2.0 | 2.0 | 1077 | $2,700 | $2.51 | 23d | 1 | 1.15mi |
| 17 N Pearl St Unit 3 Buffalo, NY | 3.0 | 2.0 | 1197 | $3,100 | $2.59 | 23d | 1 | 1.15mi |
| 217 W Tupper St Unit 2 Buffalo, NY | 3.0 | 1.0 | 1150 | $1,350 | $1.17 | 43d | 1 | 1.21mi |
| 44 N Pearl St #5 Buffalo, NY | 3.0 | 1.0 | 1200 | $2,400 | $2.00 | 43d | 1 | 1.21mi |
| 506 Delaware Ave Buffalo, NY | 1.0–2.0 | 1.0–1.5 | 1190 | $2,995 | $2.52 | 10d | 6 | 1.25mi |
| 370 Virginia St Unit 3 Buffalo, NY | 2.0 | 1.0 | 1050 | $1,300 | $1.24 | 43d | 1 | 1.26mi |
| 983 Michigan Ave Buffalo, NY | 2.0 | 1.0–2.0 | 804 | $3,202 | $3.98 | 1d | 58 | 1.28mi |
| 21 College St Buffalo, NY | 3.0 | 1.0 | 1104 | $1,850 | $1.68 | 23d | 1 | 1.31mi |
| 190 Whitney Pl Buffalo, NY | 3.0 | 1.0 | 1180 | $1,550 | $1.31 | 43d | 1 | 1.35mi |
| 901 S Park Ave Unit Lower Buffalo, NY | 4.0 | 1.0 | 1729 | $1,600 | $0.93 | 23d | 1 | 1.35mi |
| 126 Cottage St Unit 4 Buffalo, NY | 2.0 | 2.5 | 1500 | $2,000 | $1.33 | 14d | 1 | 1.45mi |
| 40 North St Unit 306 Buffalo, NY | 2.0 | 1.5 | 1125 | $1,950 | $1.73 | 43d | 1 | 1.47mi |
| 74 Days Park Unit 8 Buffalo, NY | 2.0 | 1.0 | 1350 | $1,695 | $1.26 | 43d | 1 | 1.47mi |
| 19 North St Buffalo, NY | 2.0 | 1.0–2.0 | 1306 | $2,910 | $2.23 | 10d | 7 | 1.50mi |
Listing history 4 events
-
2026-05-06status Pending 1424-char remark
-
2026-05-01$214,900 Active 1424-char remark
-
2024-09-18status Pending
-
2024-09-17$169,000 Active
ⓘ Source: listings_history table (triggers on properties + properties_extension) + one-shot
backfill from property_details.listing_events for pre-trigger history.
Climate risk First Street
- Flood 1/10 Low FEMA zone X (unshaded) · 0% chance over 30 yrs
- Wildfire 1/10 Low
- Heat 3/10 Moderate 7 d/yr ≥91°F today · 15 d/yr by 30 yrs out
- Wind 1/10 Low
- Air quality 4/10 Moderate 4 unhealthy d/yr today · 9 by 30 yrs out
Nearby sold comps map
Loading sold comps map…
Walkable amenities ~0.75 mi
Loading nearby amenities…
Taxation est. · year 1
- Rental income
- $27,732
- − Mortgage interest
- −$12,038
- − Property taxes
- −$3,224
- − Insurance
- −$1,074
- − Repairs & maintenance
- −$2,219
- − Management
- −$2,219
- − Depreciation
- −$6,252
- Taxable income
- $707
- Est. tax owed @ 24.0%
- −$170
- After-tax cash flow
- $3,917/yr
For passive investors: Depreciation is non-cash, so a rental often shows a tax loss while cash-flowing — sheltering income. Rental losses are passive: they offset passive income freely, and up to $25,000/yr can offset ordinary (W-2) income if you actively participate and your MAGI is under $100k (phasing out to $0 by $150k); unused losses carry forward. On sale, claimed depreciation is recaptured at up to 25%, and gains may owe capital-gains tax (a 1031 exchange can defer both). Figures are a year-1 estimate at your 24.0% rate — not tax advice; consult a CPA.
Schools (NCES district)
- District
- Buffalo City School District
- NCES district ID
- 3605850
- Math proficiency
- 41% ▲ 11.00%
- Reading proficiency
- 40% ▲ 7.00%
- Median HH income
- $31,665
- Composite
- 33.17/100
- National rank
- #5544
- State rank
- #535 of 590 in NY
Livability — Buffalo
- Score
- 77/100
- State rank
- #195
- US rank
- #3011
Category grades
Schools grade is shown separately in the Schools card above.
Census & demographics
- Census place
- Buffalo, NY
- County
- Erie County · 714,559 people
- City population
- 440,021
- Metro
- Buffalo-Cheektowaga, NY
- Population (ZIP)
- 7,932
- Household income
- $28,182
- Rent vs Own
- Severe rent burden
- 945.0
Population outlook (Erie County) Hauer SSP2
- Today (2025)
- 933,037 people
- By 2030
- 935,181 · +0.2%
- By 2040
- 928,531 · -0.5%
- By 2050
- 905,725 · -2.9%
- By 2075
- 834,037 · -10.6%
- By 2100
- 708,033 · -24.1%
Race, ethnicity, and origin ACS 2023
- Neighborhood character
- Diverse neighborhood (Simpson 0.60)
- Race & ethnicity
- Black 58% White 19% Hispanic / Latino 18% Two or more races 4%
- Hispanic origin (detail)
- Puerto Rican 14% Dominican 1%
- Common ancestry
- Romanian 2% Subsaharan African 1%
- Foreign-born
- 6% · Canada
- Languages at home
- 81% English-only · Spanish 14% French/Haitian/Cajun 2% Russian/Polish/Slavic 1%
Political lean MEDSL · Erie
- 2024 margin
- Lean D (+9.7) · D 54.8% · R 45.2%
- 2008→2024 swing
- -7.9pp toward R · 2008: 17.5pp · 2024: 9.7pp
- All cycles
- 2024: D+9.7 2020: D+14.7 2016: D+4.8 2012: D+15.6 2008: D+17.5
Not yet ingested
- Civics
- —
Market trends
- HPI YoY
- ▼ -3.36%
- Current HPI
- 312.6232
- Rent YoY
- ▲ 5.48%
- Metro
- Buffalo-Cheektowaga, NY
- State GDP YoY
- ▲ 2.60%
- F500 in state
- 92
Industry mix (Fortune 500 HQ in NY)
| Industry | F500 HQs | Revenue |
|---|---|---|
| Financial Services | 10 | $950B |
|
||
| Consumer Goods | 9 | $162B |
|
||
| Insurance | 4 | $225B |
|
||
| Telecommunications | 2 | $144B |
|
||
| Pharmaceuticals | 2 | $112B |
|
||
| Media / Entertainment | 2 | $69B |
|
||
Price history
+27.2% since first listed4 events — show timeline
- 2026-05-06 Pending — WNYREIS
- 2026-05-01 Listed $214,900 WNYREIS
- 2024-09-18 Pending — WNYREIS
- 2024-09-17 Listed $169,000 WNYREIS
Property tax history
-1.4%/yrLatest (2025): $373 · +1.7% YoY. Source: county tax records.
Cash-flow waterfall
monthlySold comps — $/sqft
last 12 mo · ≤1 miLoading sold comps…