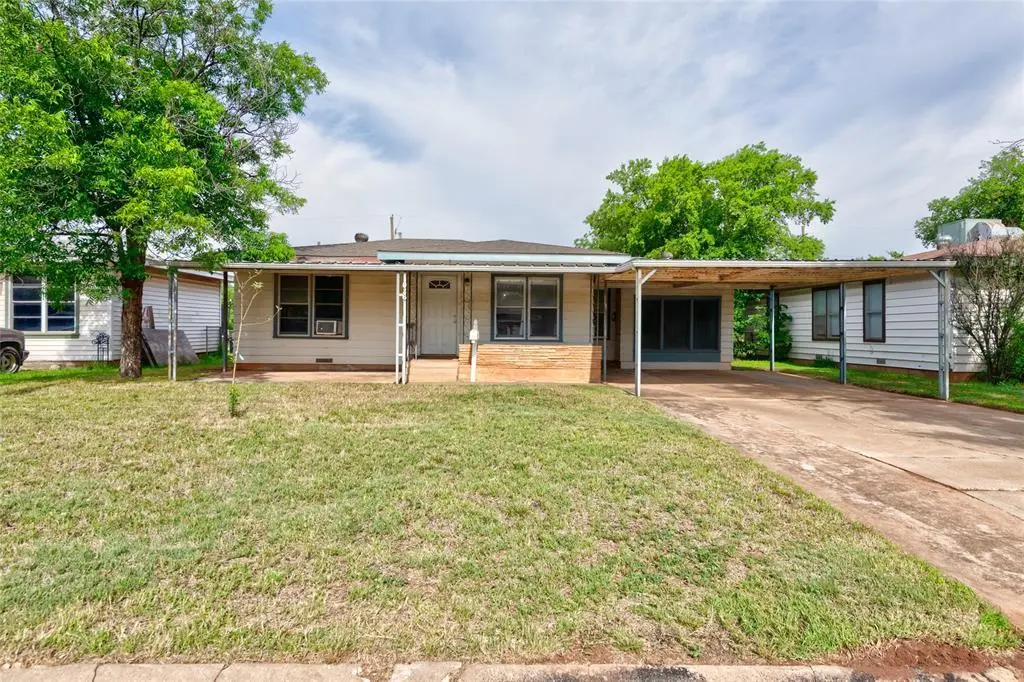
1026 S Crockett · Abilene, TX
Flood risk No data
- FEMA flood zone
- —
- Chance of flooding over 30 yrs
- —
- Est. flood insurance / yr
- —
Fire risk No data
- Est. fire insurance / yr
- —
Heat risk No data
- Hot days now (above threshold)
- —
- Hot days in 30 yrs
- —
Wind risk No data
- Chance of severe wind over 30 yrs
- —
Air-quality risk No data
- Unhealthy air days now
- —
- Unhealthy air days in 30 yrs
- —
Risk factors via First Street. Map © Google.
Why this score? — see what drove the B grade
The composite is a weighted blend of 9 inputs, each scored 0–100. Each bar is that input's sub-score; the figure is the points it added to the 100-point composite (weight × sub-score).
- Cash flow +25.9/30.0
- ARV discount +14.7/15.0
- DSCR +8.7/10.0
- 1% rule +6.9/10.0
- Rent growth +5.0/5.0
- Condition / age +4.0/5.0
- Livability +3.8/5.0
- Schools +2.8/10.0
- Appreciation +0.0/10.0
$175,000
🖨 Deal sheet 📄 Offer letter ✓ Due diligence
Listing remarks
Looking for an affordable home with extra space? This 2-bedroom, 1-bath home offers more than meets the eye, featuring two living areas, with one providing the flexibility to serve as a third bedroom, home office, playroom, or hobby space. A separate dining area adds to the home's functional layout. The property has seen updates in recent years, making it move-in ready while still leaving room for your personal touches. Outside, you'll find a large backyard with plenty of space for kids, pets, gardening, or entertaining, plus a storage shed for your tools and equipment. Whether you're a first-time buyer, looking to downsize, or searching for an investment property, this home offers great va
Key facts
- Large backyard
- Two living areas
- Storage shed
Tags
Property features AI
Finance
- Other: Deed restrictions apply
- Financial info: Listing accepts Cash, Conventional, FHA, and VA financing
- HOA & community: No homeowners association
Exterior
- Parking: Covered carport with space for 2 vehicles
- Utilities: City water; City sewer; Not in a municipal utility district
- Home design: Single-family residence (attached); Built in 1953; Preowned
- Construction: Siding exterior; Composition roof; Pillar/post/pier foundation
- Exterior features: Wood fencing; Lot under 0.5 acre (approx. 0.159 acres); Located in Elmwood West subdivision
Interior
- Kitchen: Built-in cabinets; Granite countertop; Dishwasher; Gas range; Microwave
- Bedrooms: 2 bedrooms (both on the main level); Primary bedroom on main level
- Flooring: Carpet; Luxury vinyl plank
- Bathrooms: 1 full bathroom
- Heating & cooling: Central heating (natural gas); Central electric air conditioning
- Interior features: Granite counters; High-speed internet available; 5 total rooms; One-level home
- Laundry & utility: Full-size washer/dryer area
Neighborhood map
What this means for you Summary
Snapshot
- This is a 2-bed/1.0-bath single-family listed at $175k. Condition is rated good.
Deal economics
- At list price, monthly cash flow is $430 ($5k/yr) — positive.
- The deal already cash-flows at list — no discount required.
- Meets the 1% rule at list price ($2k rent vs $175k).
- Recommended offer: $172k (1.5% below list) — sets the bar for market timing.
- Cap rate 9.2% vs local median 6.7% in Abilene — top-decile yield for the area; either an underpriced asset or a hidden risk that comps aren't pricing in. Stress-test before assuming the spread holds.
Location & tenants
- Location reads 75/100 on livability (#142 in TX, #4,037 nationally) — a middle-class / working-renter tenant base. Strengths: cost of living A+, housing A+, health & safety A+; Watch: crime D, commute F.
- Abilene ISD (urban): math 32% / reading 34% proficiency, ranked #575 of 826 in TX (top 70%) — families likely to look elsewhere, expect single-tenant / working-renter base with shorter leases.
- Zoned schools: Bonham El (math 29% / reading 28%, grade F, #2,706 of 4,322 statewide, top 63%, 482 students, 79% FRL) — zoned schools average 79% FRL vs 57% district-wide (21 pts higher); higher-poverty schools than district average — tighter screening recommended.
- Market conditions: Rents rising fast (+32.1%/yr); 109 active listings in the ZIP; 7 comparable units currently listed for rent nearby; rentals at typical pace (median 21d on market — plan ~3-4 weeks tenant-placement turnaround); 508 units permitted in Taylor County in 2024 (0 in 5+ unit buildings).
- This rent runs 40% of the median local income ($63k/yr) — at the standard rent-burdened threshold; future hikes will face affordability resistance.
Forward outlook
- Local home prices are declining (-3.0%/yr); year-one equity from $1k of loan paydown is wiped out by about $5k of value loss. Plan a longer hold.
- Taylor County population projected at +16% by 2050 — long-run rental-demand tailwind backs the buy-and-hold thesis.
- At projected returns (-3.0% appreciation + 8.0% rent growth), your $49k cash investment doubles in ~7 years — after that, you're playing with house money.
Negotiation context
- It's been on market 19 days — a 2% lower offer ($172k) is reasonable based on typical stale-listing flexibility.
Risks & watch-outs
- Watch-outs: built in 1953 — expect roof / HVAC / electrical / plumbing capex.
Questions for the listing agent
- Built in 1953 — when were the roof, HVAC, electrical panel, plumbing, and water heater last replaced?
- Is there a deadline driving the sale (1031 exchange, divorce, estate, relocation)? That informs how much negotiation room exists.
- Schools are D-rated, which usually means shorter tenancies and higher turnover. Who's the typical renter profile here, and what's been the actual vacancy rate?
- Crime grade is D in this area — have there been break-ins, vandalism, or insurance claims at this property in the last 3 years? What carrier currently insures it and at what premium?
- What's the average days-on-market for RENTAL listings here right now (not sales)? A rising rental-DOM trend means longer vacancies and softer asking-rent achievability than the comps imply.
- What's the recent tenant-quality profile in this submarket — average credit score on applications, eviction rate, late-payment / NSF rate, and stable-employment percentage? A property-management company in the area should have these aggregated.
- How much new for-sale + rental construction is in the pipeline within 1–3 miles? Heavy new supply typically softens prices + rents 12–24 months out; constrained supply supports both.
Investment metrics
- 1% rule
- 1.19% ✓
- Cap rate
- 9.24%
- Cash-on-cash
- 10.53%
- DSCR
- 1.47
- GRM
- 7.0
CMA / ARV
- ARV (on-the-fly)
- $208,180
- Comps found
- 12
Show comp detail 12 sales within ~0.75 mi
| Address | Dist | Beds/Ba | Sqft | Sold | Price | $/sf | Match |
|---|---|---|---|---|---|---|---|
| 918 S San Jose Dr | 0.15mi | 3/1.5 (+1) | 1,400 (-6%) | 2mo | $212,000 | $151 | 75 |
| 1266 Buccaneer Dr | 0.44mi | 3/1.0 (+1) | 1,502 (+1%) | 3mo | $130,000 | $87 | 70 |
| 734 S Jefferson Dr | 0.34mi | 3/2.0 (+1) | 1,546 (+4%) | 1mo | $215,500 | $139 | 67 |
| 1058 Westridge Dr | 0.46mi | 3/2.0 (+1) | 1,468 (-1%) | 4mo | $210,000 | $143 | 64 |
| 826 S La Salle Dr | 0.23mi | 3/1.0 (+1) | 1,309 (-12%) | 1mo | $152,500 | $117 | 63 |
| 1325 S San Jose Dr | 0.35mi | 3/1.5 (+1) | 1,396 (-6%) | 5mo | $175,000 | $125 | 62 |
| 7631 Hudson Way | 0.40mi | 3/2.0 (+1) | 1,573 (+6%) | 3mo | $315,000 | $200 | 60 |
| 5310 Fairmont St | 0.46mi | 3/2.0 (+1) | 1,389 (-7%) | 4mo | $195,000 | $140 | 55 |
| 1026 S Pioneer Dr | 0.32mi | 3/2.0 (+1) | 1,344 (-10%) | 7mo | $175,000 | $130 | 54 |
| 918 Buccaneer Dr | 0.40mi | 3/2.0 (+1) | 1,332 (-10%) | 1mo | $210,000 | $158 | 54 |
| 1353 S San Jose Dr | 0.44mi | 3/2.0 (+1) | 1,293 (-13%) | 5mo | $190,000 | $147 | 44 |
| 4225 S 6th St | 0.60mi | 3/2.0 (+1) | 1,322 (-11%) | 1mo | $169,900 | $129 | 44 |
Match score weights: distance 35% · size 25% · config 20% · recency 20%. Top-matched comps best support the ARV.
Projected returns pro-forma
-3.0% appreciation · 8.0% rent growth · sell at horizon
- IRR
- 5.0%
- Equity multiple
- 1.20×
- Total profit
- $10,030
- Equity at exit
- $26,093
- IRR
- 18.6%
- Equity multiple
- 2.92×
- Total profit
- $94,044
- Equity at exit
- $15,131
Cash invested: $49,000 (down + closing). Projections, not guarantees.
Landlord ↔ Tenant lean methodology
- Overall (STATE)
- 87 Strongly Landlord-Friendly
- State Texas
- 87 Strongly Landlord-Friendly · R+5
- County
- — inherits STATE
- City
- — inherits STATE
ZIP-level market 79605
- Rents YoY
- 32.1%
- Active inventory
- 109
- Price-to-rent
- 7.0×
Monthly cashflow live
- Estimated rent
- $2,075 high interval (Pro) →
- Mortgage (P&I)
- −$918
- Tax est. 1.5%
- −$219 /mo · $2,625/yr
- Insurance
- −$73
- HOA
- −$0
- Vacancy / Maint / Mgmt
- −$436
- Net cashflow
- $430
Break-even live
UW: 25.0% down · 7.5% · 30yr · 1.5% tax · 5.0% vac · 8.0% maint · 8.0% mgmt
Financing live
Cash to close
- Down payment
- $43,750
- Closing costs
- $5,250
- Reserves months
- —
- Total cash needed
- —
Loan-product check · same deal, 3 products live
Conventional
25% down · 7.5% · 30yr
- Down + closing
- —
- Monthly P&I
- —
- Monthly cashflow
- —
- DSCR
- —
- Eligible?
- —
Personal DTI + credit; lowest rate.
DSCR
20% down · 8.5% · 30yr
- Down + closing
- —
- Monthly P&I
- —
- Monthly cashflow
- —
- DSCR
- —
- Eligible?
- —
No personal income docs; deal must DSCR.
Hard money
10% down · 12.0% · 12mo
- Down + closing
- —
- Monthly P&I
- —
- Monthly cashflow
- —
- DSCR
- —
- Eligible?
- —
Short-term bridge; refi at stabilization.
Rent comps 7 comps
| Address | Beds | Baths | Sqft | Rent | $/sqft | DOM | Units | Dist |
|---|---|---|---|---|---|---|---|---|
| 841 S San Jose Dr Abilene, TX | 2.0 | 1.0 | 1122 | $3,000 | $2.67 | 21d | 1 | 0.22mi |
| 5348 Benbrook St Abilene, TX | 3.0 | 2.0 | 1164 | $2,100 | $1.80 | 44d | 1 | 0.48mi |
| 5850 Hartford St Lot 123 Abilene, TX | 3.0 | 2.0 | 1280 | $1,495 | $1.17 | 13d | 1 | 0.89mi |
| 728 Redbird Ln Abilene, TX | 2.0 | 1.5 | 994 | $1,695 | $1.71 | 13d | 1 | 0.98mi |
| 2301 Post Oak Rd Unit B Abilene, TX | 1.0 | 1.0 | 945 | $1,995 | $2.11 | 21d | 1 | 1.33mi |
| 234 Clyde St Abilene, TX | 3.0 | 1.0 | 998 | $1,995 | $2.00 | 13d | 1 | 1.35mi |
| 3250 College St Abilene, TX | 2.0 | 1.0 | 1148 | $1,595 | $1.39 | 21d | 1 | 1.41mi |
Listing history 15 events
-
2026-06-19days on market $175,000 Active 19 DOM
-
2026-06-18days on market $175,000 Active 18 DOM
-
2026-06-17days on market $175,000 Active 17 DOM
-
2026-06-16days on market $175,000 Active 16 DOM
-
2026-06-15statusdays on market $175,000 Active 15 DOM
-
2026-06-14days on market $175,000 Active Option Contract 13 DOM
-
2026-06-13days on market $175,000 Active Option Contract 12 DOM
-
2026-06-10days on market $175,000 Active Option Contract 10 DOM
-
2026-06-09days on market $175,000 Active Option Contract 9 DOM
-
2026-06-08days on market $175,000 Active Option Contract 8 DOM
-
2026-06-07days on market $175,000 Active Option Contract 7 DOM
-
2026-06-03statusdays on market $175,000 Active Option Contract 3 DOM
-
2026-06-02days on market $175,000 Active 2 DOM
-
2026-06-01remarks 699-char remark
-
2026-06-01$175,000 Active 1 DOM
ⓘ Source: listings_history table (triggers on properties + properties_extension) + one-shot
backfill from property_details.listing_events for pre-trigger history.
Nearby sold comps map
Loading sold comps map…
Walkable amenities ~0.75 mi
Loading nearby amenities…
Taxation est. · year 1
- Rental income
- $24,903
- − Mortgage interest
- −$9,803
- − Property taxes
- −$2,625
- − Insurance
- −$875
- − Repairs & maintenance
- −$1,992
- − Management
- −$1,992
- − Depreciation
- −$5,091
- Taxable income
- $2,524
- Est. tax owed @ 24.0%
- −$606
- After-tax cash flow
- $4,554/yr
For passive investors: Depreciation is non-cash, so a rental often shows a tax loss while cash-flowing — sheltering income. Rental losses are passive: they offset passive income freely, and up to $25,000/yr can offset ordinary (W-2) income if you actively participate and your MAGI is under $100k (phasing out to $0 by $150k); unused losses carry forward. On sale, claimed depreciation is recaptured at up to 25%, and gains may owe capital-gains tax (a 1031 exchange can defer both). Figures are a year-1 estimate at your 24.0% rate — not tax advice; consult a CPA.
Condition & rehab AI · 12 photos
This move-in ready home offers a good condition with recent updates, making it an attractive option for buyers or investors.
Value-add opportunities
- Resale paint exterior — enhances curb appeal
- Both replace ceiling fan — improves energy efficiency and aesthetics
Renovation cost estimate screening
Value-add ROI direction
- Resale paint exterior — enhances curb appeal ↑
- Both replace ceiling fan — improves energy efficiency and aesthetics ↑
ⓘ Cost ranges are severity-bucket heuristics (US national rule-of-thumb). Get contractor quotes + a written scope before underwriting a rehab budget.
Schools (NCES district)
- District
- Abilene ISD
- NCES district ID
- 4807440
- Math proficiency
- 32% ▼ -11.00%
- Reading proficiency
- 34% ▼ -5.00%
- Median HH income
- $39,782
- Composite
- 27.71/100
- National rank
- #6909
- State rank
- #575 of 826 in TX
Livability — Abilene
- Score
- 75/100
- State rank
- #142
- US rank
- #4037
Category grades
Schools grade is shown separately in the Schools card above.
Census & demographics
- Census place
- Abilene, TX
- County
- Taylor County · 136,672 people
- City population
- 136,672
- Metro
- Abilene, TX
- Population (ZIP)
- 28,467
- Household income
- $62,929
- Rent vs Own
- Severe rent burden
- 1096.0
Population outlook (Taylor County) Hauer SSP2
- Today (2025)
- 145,270 people
- By 2030
- 150,050 · +3.3%
- By 2040
- 159,417 · +9.7%
- By 2050
- 168,883 · +16.3%
- By 2075
- 194,436 · +33.8%
- By 2100
- 203,163 · +39.9%
Race, ethnicity, and origin ACS 2023
- Neighborhood character
- Majority White (63%)
- Race & ethnicity
- White 63% Hispanic / Latino 22% Two or more races 12% Black 8% Asian 2%
- Hispanic origin (detail)
- Mexican 19%
- Common ancestry
- Slovak 2% Lithuanian 1% Serbian 1%
- Foreign-born
- 6% · Canada
- Languages at home
- 84% English-only · Spanish 14% German/W. Germanic 1% Other Asian/Pacific 0%
Political lean MEDSL · Taylor
- 2024 margin
- Solid R (+49.8) · D 24.6% · R 74.4% · Other 1.0%
- 2008→2024 swing
- -4.2pp toward R · 2008: -45.6pp · 2024: -49.8pp
- All cycles
- 2024: R+49.8 2020: R+45.3 2016: R+51.1 2012: R+53.6 2008: R+45.6
Not yet ingested
- Civics
- —
Market trends
- HPI YoY
- ▼ -181.75%
- Current HPI
- 201.2341
- Rent YoY
- ▲ 32.08%
- Metro
- Abilene, TX
- State GDP YoY
- ▲ 3.95%
- F500 in state
- 110
Industry mix (Fortune 500 HQ in TX)
| Industry | F500 HQs | Revenue |
|---|---|---|
| Energy | 16 | $1,198B |
|
||
| Technology | 5 | $198B |
|
||
| Engineering / Construction | 4 | $72B |
|
||
| Energy Services | 3 | $60B |
|
||
| Utilities | 3 | $41B |
|
||
| Healthcare | 2 | $330B |
|
||
Price history
1 event — show timeline
- 2026-05-31 Listed $175,000 NTREIS
Cash-flow waterfall
monthlySold comps — $/sqft
last 12 mo · ≤1 miLoading sold comps…