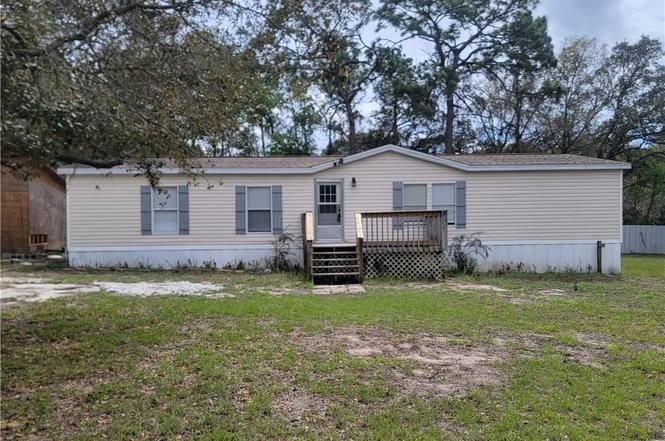
6894 W Vanaman Ct · Homosassa Springs, FL
Flood risk 9/10 · Severe
- FEMA flood zone
- X (shaded)
- Chance of flooding over 30 yrs
- 0.99%
- Est. flood insurance / yr
- $507 – $1,088
Fire risk 5/10 · Moderate
- Est. fire insurance / yr
- $947 – $1,759
Heat risk 9/10 · Severe
- Hot days now (above 108°F)
- 7 days/yr
- Hot days in 30 yrs
- 24 days/yr
Wind risk 9/10 · Severe
- Chance of severe wind over 30 yrs
- 99.0%
Air-quality risk 1/10 · Minimal
- Unhealthy air days now
- 0 days/yr
- Unhealthy air days in 30 yrs
- 0 days/yr
Risk factors via First Street. Map © Google.
Why this score? — see what drove the C- grade
The composite is a weighted blend of 9 inputs, each scored 0–100. Each bar is that input's sub-score; the figure is the points it added to the 100-point composite (weight × sub-score).
- Cash flow +24.3/30.0
- DSCR +7.8/10.0
- 1% rule +5.1/10.0
- Schools +4.1/10.0
- Livability +3.6/5.0
- ARV discount +3.3/15.0
- Rent growth +2.5/5.0
- Condition / age +2.5/5.0
- Appreciation +0.0/10.0
$215,000
🖨 Deal sheet 📄 Offer letter ✓ Due diligence
Listing remarks MLS
CASH ONLY! "AS IS" 3/2 Mobile on . 50 acres No power at the moment, well stlll works. Well was ran just a few weeks earlier with a generator. Enter at our ouwn risk! Floors have some soft spots and holes Home is in need of several repairs inside and out
Key facts
- Remodeled
- Extra storage
- Full privacy fencing
Tags
Property features AI
Finance
- Other: Lot on a cul-de-sac; Landscaped and wooded lot; Lot dimensions approximately 147 x 163 feet; Approximately 0.5 acre; Zoning: MDRMH; Outdoor pool (or none) indicated
- Financial info: Tax information not included per instructions
- HOA & community: HOA information not provided
Exterior
- Parking: Paved driveway; Unpaved parking
- Security: Security information not provided
- Utilities: Private well water; Septic tank
- Home design: Manufactured home (double wide); Residential property
- Construction: Vinyl siding; Asphalt/shingle roof; Built year not provided; Foundation information not provided
- Exterior features: Deck; Fenced yard; Shed
Interior
- Kitchen: Dishwasher; Electric oven; Electric range; Refrigerator
- Bedrooms: Bedrooms information not provided
- Flooring: Flooring information not provided
- Bathrooms: 2 full bathrooms
- Heating & cooling: Central heating (electric); Central air conditioning (electric)
- Interior features: Cathedral ceilings; Laminate countertops; Open floor plan; Walk-in closets; Skylights
- Laundry & utility: Laundry information not provided
Neighborhood map
What this means for you Summary
Snapshot
- This is a 3-bed/2.0-bath manufactured listed at $215k.
Deal economics
- At list price, monthly cash flow is $366 ($4k/yr) — positive.
- The deal already cash-flows at list — no discount required.
- Meets the 1% rule at list price ($2k rent vs $215k).
- Recommended offer: $189k (12.0% below list) — sets the bar for market timing.
- Cap rate 8.7% vs local median 5.9% in Homosassa Springs — top-decile yield for the area; either an underpriced asset or a hidden risk that comps aren't pricing in. Stress-test before assuming the spread holds.
Location & tenants
- Location reads 71/100 on livability (#391 in FL) — a middle-class / working-renter tenant base. Strengths: cost of living A+, housing A+, health & safety A+; Watch: crime C-, amenities F, commute F.
- Citrus (rural): math 49% / reading 50% proficiency, ranked #44 of 73 in FL (top 60%) — families likely to look elsewhere, expect single-tenant / working-renter base with shorter leases.
- Zoned schools: Rock Crusher Elementary School (math 70% / reading 56%, grade B, #582 of 2,144 statewide, top 28%, 665 students, 68% FRL); Crystal River Middle School (math 49% / reading 47%, grade C-, #286 of 571 statewide, top 50%, 900 students, 64% FRL); Crystal River High School (math 31% / reading 44%, grade F, #336 of 667 statewide, top 51%, 1,249 students, 56% FRL).
- Market conditions: 325 active listings in the ZIP; 3 comparable units currently listed for rent nearby; rentals at typical pace (median 21d on market — plan ~3-4 weeks tenant-placement turnaround); 2,443 units permitted in Citrus County in 2024 (0 in 5+ unit buildings).
Forward outlook
- Local home prices are declining (-3.0%/yr); year-one equity from $1k of loan paydown is wiped out by about $6k of value loss. Plan a longer hold.
- Citrus County population projected to shrink 10% by 2050 — rents likely to lag national; underwrite the cash flow, not the appreciation.
Negotiation context
- It's been on market 247 days — a 12% lower offer ($189k) is reasonable based on typical stale-listing flexibility.
- 2 sale attempts since 20y ago; this cycle's ask has dropped $54k (20%) from the opening price — seller is motivated, your offer sets the floor, not the list.
- Current owner paid $45k; list at $215k implies a 378% gain — meaningful room to come down on a strong offer.
Risks & watch-outs
- Watch-outs: flood insurance adds $66/mo.
- Climate carrying-cost: severe flood risk; severe wind risk, 99% chance of damaging wind over 30y; moderate wildfire risk; extreme-heat days projected 7→24/yr by 2055 (HVAC capex compounding) — expect insurance premiums to compound above CPI over the hold.
Questions for the listing agent
- It's been on market 247 days. Have you received any prior offers? Is the seller open to a 12% concession, seller financing, or rate buy-down credit?
- What's the actual annual flood-insurance premium (NFIP or private), and is the property in a SFHA with mandatory coverage?
- Why hasn't it sold? Are there any deal-killer items the seller is aware of (foundation, flood, title, zoning, code violations)?
- Is there a deadline driving the sale (1031 exchange, divorce, estate, relocation)? That informs how much negotiation room exists.
- Schools are F-rated, which usually means shorter tenancies and higher turnover. Who's the typical renter profile here, and what's been the actual vacancy rate?
- What's the average days-on-market for RENTAL listings here right now (not sales)? A rising rental-DOM trend means longer vacancies and softer asking-rent achievability than the comps imply.
- What's the recent tenant-quality profile in this submarket — average credit score on applications, eviction rate, late-payment / NSF rate, and stable-employment percentage? A property-management company in the area should have these aggregated.
- How much new for-sale + rental construction is in the pipeline within 1–3 miles? Heavy new supply typically softens prices + rents 12–24 months out; constrained supply supports both.
Investment metrics
- 1% rule
- 1.01% ✓
- Cap rate
- 8.71%
- Cash-on-cash
- 8.62%
- DSCR
- 1.38
- GRM
- 8.3
CMA / ARV
- ARV (on-the-fly)
- $196,560
- Comps found
- 3
Show comp detail 3 sales within ~0.75 mi
| Address | Dist | Beds/Ba | Sqft | Sold | Price | $/sf | Match |
|---|---|---|---|---|---|---|---|
| 791 N Griffith Ave | 0.27mi | 3/2.0 | 1,512 (0%) | 8mo | $115,000 | $76 | 80 |
| 697 N Gulf Ave | 0.52mi | 3/2.0 | 1,620 (+7%) | 15mo | $209,900 | $130 | 52 |
| 6385 W Moss Ln | 0.50mi | 3/2.0 | 1,344 (-11%) | 22mo | $214,900 | $160 | 40 |
Match score weights: distance 35% · size 25% · config 20% · recency 20%. Top-matched comps best support the ARV.
Projected returns pro-forma
-3.0% appreciation · 3.0% rent growth · sell at horizon
- IRR
- -5.2%
- Equity multiple
- 0.81×
- Total profit
- $-11,577
- Equity at exit
- $32,057
- IRR
- 4.5%
- Equity multiple
- 1.33×
- Total profit
- $19,718
- Equity at exit
- $18,589
Cash invested: $60,200 (down + closing). Projections, not guarantees.
Landlord ↔ Tenant lean methodology
- Overall (STATE)
- 87 Strongly Landlord-Friendly
- State Florida
- 87 Strongly Landlord-Friendly · R+3
- County
- — inherits STATE
- City
- — inherits STATE
ZIP-level market 34429
- Home prices YoY
- -17.8%
- Active inventory
- 325
- Price-to-rent
- 8.3×
Monthly cashflow live
- Estimated rent
- $2,163 medium interval (Pro) →
- Mortgage (P&I)
- −$1,127
- Tax from tax record
- −$59 /mo · $706/yr
- Insurance
- −$90
- Flood insurance flood zone
- −$66 /mo · $798/yr
- HOA
- −$0
- Vacancy / Maint / Mgmt
- −$454
- Net cashflow
- $366
Break-even live
UW: 25.0% down · 7.5% · 30yr · 1.5% tax · 5.0% vac · 8.0% maint · 8.0% mgmt
Financing live
Cash to close
- Down payment
- $53,750
- Closing costs
- $6,450
- Reserves months
- —
- Total cash needed
- —
Loan-product check · same deal, 3 products live
Conventional
25% down · 7.5% · 30yr
- Down + closing
- —
- Monthly P&I
- —
- Monthly cashflow
- —
- DSCR
- —
- Eligible?
- —
Personal DTI + credit; lowest rate.
DSCR
20% down · 8.5% · 30yr
- Down + closing
- —
- Monthly P&I
- —
- Monthly cashflow
- —
- DSCR
- —
- Eligible?
- —
No personal income docs; deal must DSCR.
Hard money
10% down · 12.0% · 12mo
- Down + closing
- —
- Monthly P&I
- —
- Monthly cashflow
- —
- DSCR
- —
- Eligible?
- —
Short-term bridge; refi at stabilization.
Rent comps 3 comps
| Address | Beds | Baths | Sqft | Rent | $/sqft | DOM | Units | Dist |
|---|---|---|---|---|---|---|---|---|
| 6384 W Flanders Ln Crystal River, FL | 3.0 | 2.0 | 1800 | $2,250 | $1.25 | 20d | 1 | 0.50mi |
| 6084 W Fairhaven Ct Crystal River, FL | 2.0 | 2.0 | 1545 | $2,200 | $1.42 | 20d | 1 | 1.14mi |
| 5926 W Poplar Springs Cir Unit 2101 Crystal River, FL | 3.0 | 2.0 | 1200 | $1,895 | $1.58 | 20d | 1 | 1.18mi |
Listing history 28 events
-
2026-06-19days on market $215,000 Active 247 DOM
-
2026-06-18days on market $215,000 Active 246 DOM
-
2026-06-17days on market $215,000 Active 245 DOM
-
2026-06-16days on market $215,000 Active 244 DOM
-
2026-06-15days on market $215,000 Active 243 DOM
-
2026-06-14remarks 579-char remark
-
2026-06-14pricedays on market $215,000 Active 241 DOM
-
2026-06-13days on market $225,000 Active 240 DOM
-
2026-06-09days on market $225,000 Active 237 DOM
-
2026-06-08days on market $225,000 Active 236 DOM
-
2026-06-03days on market $225,000 Active 231 DOM
-
2026-06-02days on market $225,000 Active 230 DOM
-
2026-06-01pricedays on market $225,000 Active 229 DOM
-
2026-05-31days on market $249,000 Active 228 DOM
-
2026-05-30days on market $249,000 Active 227 DOM
-
2026-05-11price $249,000
-
2026-03-13price $258,500
-
2026-02-02price $259,000
-
2025-11-04price $269,000
-
2025-10-16price $279,000
-
2025-10-15$269,000 Active
-
2025-08-05soldstatus $45,000
-
2025-07-31soldstatus $45,000 Closed 266-char remark
Show marketing remark (266 chars)
CASH ONLY! "AS IS" 3/2 Mobile on . 50 acres No power at the moment, well stlll works. Well was ran just a few weeks earlier with a generator. Enter at our ouwn risk! Floors have some soft spots and holes Home is in need of several repairs inside and out
-
2019-08-07soldstatus $69,000
-
2006-08-08soldstatus $74,900
-
2006-08-03soldstatus $74,900 229-char remark
Show marketing remark (229 chars)
Come to see this 3 or 4 Bedrm home, currently being used as 3 bedrms and den. It has 2 baths, dining room, large kitchen with skylight and inside laundry. The lot is half acre in Crystal River. Can see the sign from Arter Street.
-
2006-05-18$74,900 229-char remark
Show marketing remark (229 chars)
Come to see this 3 or 4 Bedrm home, currently being used as 3 bedrms and den. It has 2 baths, dining room, large kitchen with skylight and inside laundry. The lot is half acre in Crystal River. Can see the sign from Arter Street.
-
1993-06-01soldstatus $25,000
ⓘ Source: listings_history table (triggers on properties + properties_extension) + one-shot
backfill from property_details.listing_events for pre-trigger history.
Tax reassessment forecast FL · Resets to sale price
- Current annual tax
- $706 · $59/mo
- Projected year-2 tax
- $1,784 · $149/mo
- Expected delta
- +$1,079/yr (+$90/mo · 152.8%)
ⓘ Screening estimate from a state-policy table — verify with the county assessor before closing.
Climate risk First Street
- Flood 9/10 Extreme FEMA zone X (shaded) · 99% chance over 30 yrs
- Wildfire 5/10 Major
- Heat 9/10 Extreme 7 d/yr ≥108°F today · 24 d/yr by 30 yrs out
- Wind 9/10 Extreme 99% chance of damaging wind over 30 yrs
- Air quality 1/10 Low 0 unhealthy d/yr today · 0 by 30 yrs out
Nearby sold comps map
Loading sold comps map…
Walkable amenities ~0.75 mi
Loading nearby amenities…
Taxation est. · year 1
- Rental income
- $25,951
- − Mortgage interest
- −$12,043
- − Property taxes
- −$706
- − Insurance
- −$1,872
- − Repairs & maintenance
- −$2,076
- − Management
- −$2,076
- − Depreciation
- −$6,255
- Taxable income
- $923
- Est. tax owed @ 24.0%
- −$221
- After-tax cash flow
- $4,172/yr
For passive investors: Depreciation is non-cash, so a rental often shows a tax loss while cash-flowing — sheltering income. Rental losses are passive: they offset passive income freely, and up to $25,000/yr can offset ordinary (W-2) income if you actively participate and your MAGI is under $100k (phasing out to $0 by $150k); unused losses carry forward. On sale, claimed depreciation is recaptured at up to 25%, and gains may owe capital-gains tax (a 1031 exchange can defer both). Figures are a year-1 estimate at your 24.0% rate — not tax advice; consult a CPA.
Schools (NCES district)
- District
- Citrus
- NCES district ID
- 1200270
- Math proficiency
- 49% ▼ -10.00%
- Reading proficiency
- 50% ▼ -6.00%
- Median HH income
- $38,618
- Composite
- 41.28/100
- National rank
- #3519
- State rank
- #44 of 73 in FL
Livability — Homosassa Springs
- Score
- 71/100
- State rank
- #391
- US rank
- #6877
Category grades
Schools grade is shown separately in the Schools card above.
Census & demographics
- Population (ZIP)
- 9,494
Population outlook (Citrus County) Hauer SSP2
- Today (2025)
- 138,622 people
- By 2030
- 136,886 · -1.3%
- By 2040
- 132,009 · -4.8%
- By 2050
- 125,196 · -9.7%
- By 2075
- 108,570 · -21.7%
- By 2100
- 84,454 · -39.1%
Race, ethnicity, and origin ACS 2023
- Neighborhood character
- Predominantly White (88%)
- Race & ethnicity
- White 88% Black 5% Hispanic / Latino 4% Two or more races 3%
- Common ancestry
- Italian 7% Slovak 2% Lithuanian 2%
- Foreign-born
- 4% · Canada
- Languages at home
- 97% English-only · Spanish 1% Tagalog/Filipino 1%
Political lean MEDSL · Citrus
- 2024 margin
- Solid R (+45.9) · D 26.8% · R 72.6%
- 2008→2024 swing
- -29.8pp toward R · 2008: -16.1pp · 2024: -45.9pp
- All cycles
- 2024: R+45.9 2020: R+41.0 2016: R+39.7 2012: R+21.9 2008: R+16.1
Not yet ingested
- Civics
- —
Market trends
- HPI YoY
- ▼ -58.92%
- Current HPI
- 271.3171
- Rent YoY
- —
- Metro
- —
- State GDP YoY
- ▲ 3.28%
- F500 in state
- 36
Industry mix (Fortune 500 HQ in FL)
| Industry | F500 HQs | Revenue |
|---|---|---|
| Industrial Technology | 2 | $29B |
|
||
| Insurance | 2 | $17B |
|
||
| Retail | 1 | $60B |
|
||
| Technology Distribution | 1 | $58B |
|
||
| Homebuilding | 1 | $35B |
|
||
| Technology Manufacturing | 1 | $35B |
|
||
Price history
+896.0% since first listed13 events — show timeline
- 2026-05-11 Price Changed $249,000 RACC
- 2026-03-13 Price Changed $258,500 RACC
- 2026-02-02 Price Changed $259,000 RACC
- 2025-11-04 Price Changed $269,000 RACC
- 2025-10-16 Price Changed $279,000 RACC
- 2025-10-15 Listed $269,000 RACC
- 2025-08-05 Sold (Public Records) $45,000 Public Records
- 2025-07-31 Sold (MLS) $45,000 RACC
- 2019-08-07 Sold (Public Records) $69,000 Public Records
- 2006-08-08 Sold (Public Records) $74,900 Public Records
- 2006-08-03 Sold (MLS) $74,900 RACC
- 2006-05-18 Listed $74,900 RACC
- 1993-06-01 Sold (Public Records) $25,000 Public Records
Property tax history
-0.9%/yrLatest (2025): $706 · +8.8% YoY. Source: county tax records.
Cash-flow waterfall
monthlySold comps — $/sqft
last 12 mo · ≤1 miLoading sold comps…