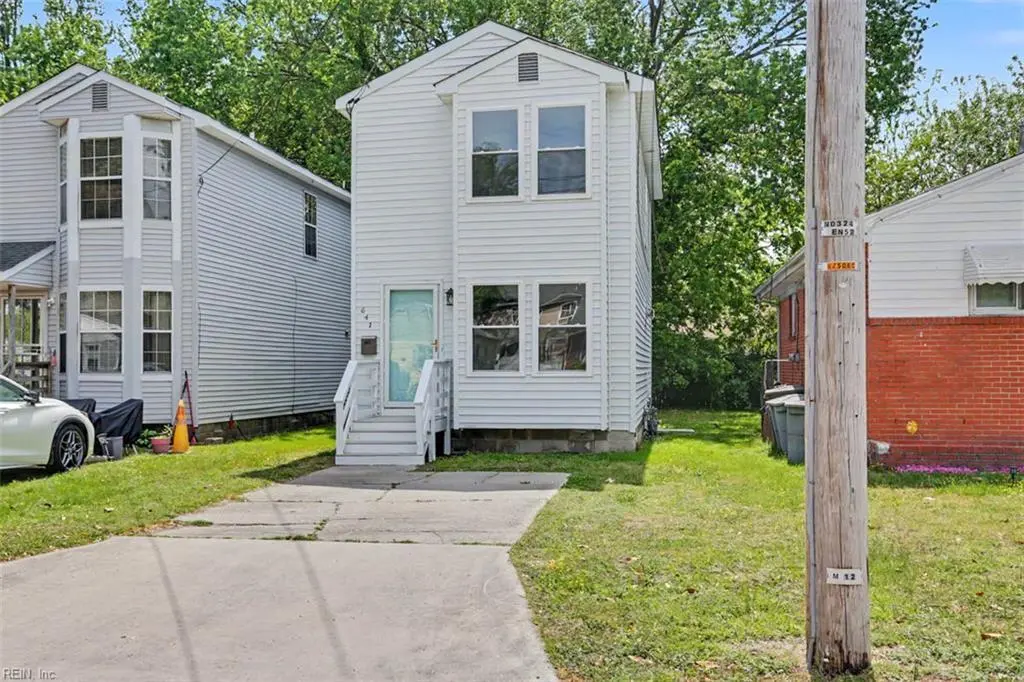
641 Ridgeway Ave · Hampton, VA
Flood risk 3/10 · Minor
- FEMA flood zone
- X (unshaded)
- Chance of flooding over 30 yrs
- 0.1%
- Est. flood insurance / yr
- $473 – $860
Fire risk 1/10 · Minimal
- Est. fire insurance / yr
- $666 – $1,236
Heat risk 9/10 · Severe
- Hot days now (above 105°F)
- 7 days/yr
- Hot days in 30 yrs
- 16 days/yr
Wind risk 8/10 · Major
- Chance of severe wind over 30 yrs
- 80.0%
Air-quality risk 2/10 · Minimal
- Unhealthy air days now
- 1 days/yr
- Unhealthy air days in 30 yrs
- 1 days/yr
Risk factors via First Street. Map © Google.
Why this score? — see what drove the D grade
The composite is a weighted blend of 9 inputs, each scored 0–100. Each bar is that input's sub-score; the figure is the points it added to the 100-point composite (weight × sub-score).
- Cash flow +10.2/30.0
- ARV discount +9.0/15.0
- Schools +5.5/10.0
- Rent growth +5.0/5.0
- Livability +3.8/5.0
- DSCR +2.9/10.0
- Condition / age +2.5/5.0
- 1% rule +2.4/10.0
- Appreciation +0.0/10.0
$239,900
🖨 Deal sheet 📄 Offer letter ✓ Due diligence
Listing remarks MLS
Outstanding move-in ready 2 story single family home! All HGTV up! Granite countertops, stainless steel appliances, new custom kitchen, 3 bedrooms, 1.5 updated baths, new flooring, new lights and fans, new paint, replacement windows! $244,900 single family home. New energy efficient Apollo HVAC system will provide years of comfort and savings!
Key facts
- Custom kitchen
- New flooring
- New lights
Tags
Property features AI
Finance
- HOA & community: No HOA (fees listed as 0)
Exterior
- Parking: Off-street parking; Driveway spaces; Street parking
- Utilities: City/County water; City/County sewer; Gas water heater; Natural gas available
- Home design: Detached single-family home; Traditional style; 2 stories; 2 living levels; Crawl foundation; Facing direction not specified
- Construction: Vinyl siding; Asphalt shingle roof
- Exterior features: Deck; Porch; Wooded view
Interior
- Kitchen: Electric range; Microwave; Dishwasher; Refrigerator; 220 V electric outlet
- Bedrooms: No bedroom with full bathroom on first floor; 7 total rooms (includes attic, breakfast area, foyer, porch, utility room)
- Flooring: Carpet; Laminate
- Bathrooms: 1 full bathroom; 1 half bathroom
- Heating & cooling: Central air; Forced hot air; Natural gas heating
- Interior features: Ceiling fan; Scuttle access
- Laundry & utility: Washer hookup; Dryer hookup; Main floor laundry; Utility room
Neighborhood map
What this means for you Summary
Snapshot
- This is a 3-bed/1.5-bath single-family listed at $240k.
Deal economics
- At list price, monthly cash flow is $-137 ($-2k/yr) — negative.
- To cash-flow at today's rent, offer at most $216k (10.1% below list).
- To meet the 1% rule (rent ≥ 1% of price), the offer needs to be $178k (25.8% below list).
- Recommended offer: $178k (25.8% below list) — sets the bar for 1% rule.
- Cap rate 5.6% vs local median 4.5% in Hampton — meaningfully above typical; check what's discounted (condition, days-on-market, listing class) to confirm the premium yield is real.
Location & tenants
- Location reads 75/100 on livability (#133 in VA, #4,302 nationally) — a middle-class / working-renter tenant base. Strengths: housing A+, health & safety A+, cost of living A; Watch: crime C-, amenities D+, commute F.
- Hampton City Public School District (urban): math 60% / reading 70% proficiency, ranked #40 of 131 in VA (top 30%) — acceptable for families but not a draw, mixed tenant base, ~2y average lease.
- Zoned schools: A.W.E. Bassette Elementary (math 32% / reading 47%, grade F, #900 of 1,108 statewide, top 83%, 494 students, 87% FRL); Hampton High (math 60% / reading 75%, grade B, #183 of 319 statewide, top 58%, 1,359 students, 86% FRL) — zoned schools average 86% FRL vs 49% district-wide (37 pts higher); higher-poverty schools than district average — tighter screening recommended.
- Market conditions: Rents rising fast (+21.4%/yr); 123 active listings in the ZIP; 26 comparable units currently listed for rent nearby; rentals at typical pace (median 24d on market — plan ~3-4 weeks tenant-placement turnaround); 46% of comp listings sitting > 30 days — soft ceiling on asking rent; 68 units permitted in Hampton city in 2024 (0 in 5+ unit buildings).
- This rent runs 33% of the median local income ($65k/yr) — at the standard rent-burdened threshold; future hikes will face affordability resistance.
Forward outlook
- Local home prices are declining (-3.0%/yr); year-one equity from $2k of loan paydown is wiped out by about $7k of value loss. Plan a longer hold.
- Hampton County population projected at -13% by 2050 — secular population decline; favor cash flow + early exit over multi-decade hold.
Negotiation context
- It's been on market 44 days — a 3% lower offer ($233k) is reasonable based on typical stale-listing flexibility.
- 3 sale attempts with the ask held roughly flat each time — persistent listings suggest the price (not the market) is what's stuck; bring a comps-based counter.
- Current owner paid $115k; list at $240k implies a 109% gain — meaningful room to come down on a strong offer.
Risks & watch-outs
- Climate carrying-cost: severe wind risk, 80% chance of damaging wind over 30y; extreme-heat days projected 7→16/yr by 2055 (HVAC capex compounding) — expect insurance premiums to compound above CPI over the hold.
Questions for the listing agent
- What do current leases actually rent for vs. the listed asking? Can we see a recent rent roll and the last 12 months of T-12 income?
- It's been on market 44 days. Have you received any prior offers? Is the seller open to a 26% concession, seller financing, or rate buy-down credit?
- Is there a deadline driving the sale (1031 exchange, divorce, estate, relocation)? That informs how much negotiation room exists.
- Schools are B-rated — typically a magnet for longer-tenancy family renters. What's the average tenant stay here, and is there a school-zone premium baked into asking?
- The area grade is low — what's the realistic commute time and amenity access for the typical tenant pool here? Any planned neighborhood developments (good or bad) we should know about?
- What's the average days-on-market for RENTAL listings here right now (not sales)? A rising rental-DOM trend means longer vacancies and softer asking-rent achievability than the comps imply.
- What's the recent tenant-quality profile in this submarket — average credit score on applications, eviction rate, late-payment / NSF rate, and stable-employment percentage? A property-management company in the area should have these aggregated.
- How much new for-sale + rental construction is in the pipeline within 1–3 miles? Heavy new supply typically softens prices + rents 12–24 months out; constrained supply supports both.
Investment metrics
- 1% rule
- 0.74% ✗
- Cap rate
- 5.61%
- Cash-on-cash
- -2.45%
- DSCR
- 0.89
- GRM
- 11.2
CMA / ARV
- ARV (median comp)
- $248,099
- List price
- $239,900
- Delta
- -3.30%
- Verdict
- FAIR
- Comps
- 20 within 1.0 mi
Show comp detail 12 sales within ~0.75 mi
| Address | Dist | Beds/Ba | Sqft | Sold | Price | $/sf | Match |
|---|---|---|---|---|---|---|---|
| 814 Downing St | 0.24mi | 3/1.5 | 1,116 (-3%) | 3mo | $210,000 | $188 | 82 |
| 428 Colonial Ave | 0.29mi | 3/1.0 | 1,151 (+0%) | 3mo | $232,000 | $202 | 82 |
| 647 Bell St | 0.39mi | 3/1.5 | 1,148 (-0%) | 1mo | $148,000 | $129 | 81 |
| 812 Ridgeway Ave | 0.17mi | 3/1.5 | 1,240 (+8%) | 3mo | $250,000 | $202 | 76 |
| 633 Bell St | 0.37mi | 3/2.0 | 1,200 (+4%) | 3mo | $245,000 | $204 | 71 |
| 625 Bell St | 0.36mi | 3/1.0 | 1,212 (+6%) | 1mo | $146,000 | $120 | 71 |
| 438 Highland Ave | 0.19mi | 3/2.0 | 1,024 (-11%) | 2mo | $253,000 | $247 | 69 |
| 460 England Ave | 0.47mi | 3/2.5 | 1,107 (-4%) | 1mo | $230,000 | $208 | 67 |
| 402 Melville Rd | 0.57mi | 3/1.0 | 1,180 (+3%) | 2mo | $215,000 | $182 | 66 |
| 622 Chapel St | 0.55mi | 3/1.5 | 1,221 (+6%) | 1mo | $193,000 | $158 | 64 |
| 624 Celey St | 0.74mi | 3/2.0 | 1,053 (-8%) | 1mo | $235,000 | $223 | 49 |
| 44 Henry St | 0.64mi | 3/2.0 | 1,284 (+12%) | 0mo | $299,900 | $234 | 48 |
Match score weights: distance 35% · size 25% · config 20% · recency 20%. Top-matched comps best support the ARV.
Projected returns pro-forma
-3.0% appreciation · 8.0% rent growth · sell at horizon
- IRR
- -15.3%
- Equity multiple
- 0.43×
- Total profit
- $-38,246
- Equity at exit
- $35,770
- IRR
- -0.3%
- Equity multiple
- 0.97×
- Total profit
- $-1,932
- Equity at exit
- $20,742
Cash invested: $67,172 (down + closing). Projections, not guarantees.
Landlord ↔ Tenant lean methodology
- Overall (STATE)
- 55 Moderately Landlord-Leaning
- State Virginia
- 55 Moderately Landlord-Leaning · D+2
- County
- — inherits STATE
- City
- — inherits STATE
ZIP-level market 23661
- Home prices YoY
- -16.7%
- Rents YoY
- 21.4%
- Active inventory
- 123
- Price-to-rent
- 11.2×
Monthly cashflow live
- Estimated rent
- $1,779 high interval (Pro) →
- Mortgage (P&I)
- −$1,258
- Tax from tax record
- −$184 /mo · $2,214/yr
- Insurance
- −$100
- HOA
- −$0
- Vacancy / Maint / Mgmt
- −$374
- Net cashflow
- $-137
Break-even live
UW: 25.0% down · 7.5% · 30yr · 1.5% tax · 5.0% vac · 8.0% maint · 8.0% mgmt
Financing live
Cash to close
- Down payment
- $59,975
- Closing costs
- $7,197
- Reserves months
- —
- Total cash needed
- —
Loan-product check · same deal, 3 products live
Conventional
25% down · 7.5% · 30yr
- Down + closing
- —
- Monthly P&I
- —
- Monthly cashflow
- —
- DSCR
- —
- Eligible?
- —
Personal DTI + credit; lowest rate.
DSCR
20% down · 8.5% · 30yr
- Down + closing
- —
- Monthly P&I
- —
- Monthly cashflow
- —
- DSCR
- —
- Eligible?
- —
No personal income docs; deal must DSCR.
Hard money
10% down · 12.0% · 12mo
- Down + closing
- —
- Monthly P&I
- —
- Monthly cashflow
- —
- DSCR
- —
- Eligible?
- —
Short-term bridge; refi at stabilization.
Rent comps 26 comps
| Address | Beds | Baths | Sqft | Rent | $/sqft | DOM | Units | Dist |
|---|---|---|---|---|---|---|---|---|
| 708 Westwood Ave Hampton, VA | 3.0 | 2.5 | 1300 | $2,300 | $1.77 | 14d | 1 | 0.07mi |
| 507 Highland Ave Hampton, VA | 2.0 | 1.0 | 925 | $1,500 | $1.62 | 14d | 1 | 0.12mi |
| 640 Homestead Ave Hampton, VA | 3.0 | 1.0 | 852 | $1,750 | $2.05 | 43d | 1 | 0.13mi |
| 603 La Salle Ave Hampton, VA | 2.0 | 1.0 | 759 | $1,000 | $1.32 | 43d | 1 | 0.21mi |
| 702 Rutherford St Hampton, VA | 3.0 | 2.0 | 1445 | $1,795 | $1.24 | 23d | 1 | 0.23mi |
| 607 Lee St Hampton, VA | 3.0 | 1.5 | 1404 | $2,150 | $1.53 | 43d | 1 | 0.52mi |
| 626 Chapel St Hampton, VA | 4.0 | 2.0 | 1470 | $1,900 | $1.29 | 12d | 1 | 0.54mi |
| 708 Norwood Cir Hampton, VA | 2.0 | 1.0 | 720 | $1,050 | $1.46 | 23d | 1 | 0.58mi |
| 901 W Queen St Hampton, VA | 2.0–3.0 | 1.5–2.5 | 1096 | $1,600 | $1.46 | 43d | 1 | 0.63mi |
| 1625 W Pembroke Ave Hampton, VA | 2.0 | 1.5 | 950 | $1,250 | $1.32 | 23d | 1 | 0.68mi |
| 1625 W Pembroke Ave Unit 7 Hampton, VA | 2.0 | 1.5 | 950 | $1,250 | $1.32 | 43d | 1 | 0.69mi |
| 448 Chapel St Hampton, VA | 3.0 | 2.0 | 1425 | $1,850 | $1.30 | 2d | 1 | 0.74mi |
| 3605 Kecoughtan Rd Hampton, VA | 2.0 | 1.0 | 800 | $1,200 | $1.50 | 43d | 1 | 0.74mi |
| 3785 Kecoughtan Rd Hampton, VA | 1.0–2.0 | 1.0 | 650 | $1,425 | $2.19 | 43d | 5 | 0.83mi |
| 3750 Kecoughtan Rd Hampton, VA | 2.0 | 1.5 | 1300 | $1,600 | $1.23 | 43d | 1 | 0.85mi |
| 63 Algonquin Rd Hampton, VA | 2.0 | 1.0 | 1100 | $1,495 | $1.36 | 43d | 1 | 1.01mi |
| 640 Rolfe St Hampton, VA | 3.0 | 2.0 | 1100 | $2,000 | $1.82 | 43d | 1 | 1.07mi |
| 236 Pocahontas Pl Hampton, VA | 2.0 | 1.0 | 1262 | $1,795 | $1.42 | 1d | 1 | 1.12mi |
| 130 Pocahontas Pl Hampton, VA | 3.0 | 1.0 | 1415 | $1,695 | $1.20 | 43d | 1 | 1.21mi |
| 2113 Victoria Blvd Hampton, VA | 3.0 | 1.0 | 1005 | $1,595 | $1.59 | 43d | 1 | 1.29mi |
| 600 Freeman Dr Hampton, VA | 1.0–2.0 | 1.0–2.0 | 892 | $2,008 | $2.25 | 1d | 8 | 1.32mi |
| 613 Delaware Ave Hampton, VA | 3.0 | 2.0 | 1082 | $1,900 | $1.76 | 2d | 1 | 1.40mi |
| 624 Pennsylvania Ave Hampton, VA | 3.0 | 1.0 | 912 | $1,600 | $1.75 | 23d | 1 | 1.40mi |
| 1943 Kecoughtan Rd Hampton, VA | 2.0 | 1.0 | 900 | $1,150 | $1.28 | 3d | 1 | 1.42mi |
| 1943 Kecoughtan Rd Unit G Hampton, VA | 2.0 | 1.0 | 900 | $1,150 | $1.28 | 11d | 1 | 1.42mi |
| 2 Abbott Dr Hampton, VA | 1.0–3.0 | 1.0–3.5 | 1187 | $2,891 | $2.43 | 1d | 18 | 1.45mi |
Listing history 14 events
-
2026-06-07statusdays on market $239,900 Under Contract 44 DOM
-
2026-06-03days on market $239,900 Active Under Contract 41 DOM
-
2026-06-02days on market $239,900 Active Under Contract 40 DOM
-
2026-06-01days on market $239,900 Active Under Contract 39 DOM
-
2026-05-31days on market $239,900 Active Under Contract 38 DOM
-
2026-05-15price $239,900 344-char remark
Show marketing remark (344 chars)
Outstanding move-in ready 2 story single family home! All HGTV up! Granite countertops, stainless steel appliances, new custom kitchen, 3 bedrooms, 1.5 updated baths, new flooring, new lights and fans, new paint, replacement windows! $244,900 single family home. New energy efficient Apollo HVAC sytem will provide years of comfort and savings!
-
2026-05-15price $239,900 345-char remark
Show marketing remark (344 chars)
Outstanding move-in ready 2 story single family home! All HGTV up! Granite countertops, stainless steel appliances, new custom kitchen, 3 bedrooms, 1.5 updated baths, new flooring, new lights and fans, new paint, replacement windows! $244,900 single family home. New energy efficient Apollo HVAC sytem will provide years of comfort and savings!
-
2026-05-15price $239,900
Show marketing remark (344 chars)
Outstanding move-in ready 2 story single family home! All HGTV up! Granite countertops, stainless steel appliances, new custom kitchen, 3 bedrooms, 1.5 updated baths, new flooring, new lights and fans, new paint, replacement windows! $244,900 single family home. New energy efficient Apollo HVAC sytem will provide years of comfort and savings!
-
2026-04-23$244,900 Active 344-char remark
Show marketing remark (344 chars)
Outstanding move-in ready 2 story single family home! All HGTV up! Granite countertops, stainless steel appliances, new custom kitchen, 3 bedrooms, 1.5 updated baths, new flooring, new lights and fans, new paint, replacement windows! $244,900 single family home. New energy efficient Apollo HVAC sytem will provide years of comfort and savings!
-
2026-04-23$244,900 Active 345-char remark
Show marketing remark (344 chars)
Outstanding move-in ready 2 story single family home! All HGTV up! Granite countertops, stainless steel appliances, new custom kitchen, 3 bedrooms, 1.5 updated baths, new flooring, new lights and fans, new paint, replacement windows! $244,900 single family home. New energy efficient Apollo HVAC sytem will provide years of comfort and savings!
-
2026-04-23$244,900 Active
Show marketing remark (344 chars)
Outstanding move-in ready 2 story single family home! All HGTV up! Granite countertops, stainless steel appliances, new custom kitchen, 3 bedrooms, 1.5 updated baths, new flooring, new lights and fans, new paint, replacement windows! $244,900 single family home. New energy efficient Apollo HVAC sytem will provide years of comfort and savings!
-
2026-02-02soldstatus $115,000
-
2005-09-12soldstatus $84,900
-
1989-02-01soldstatus $7,000
ⓘ Source: listings_history table (triggers on properties + properties_extension) + one-shot
backfill from property_details.listing_events for pre-trigger history.
Tax reassessment forecast VA · Resets to sale price
- Current annual tax
- $2,214 · $184/mo
- Projected year-2 tax
- $2,214 · $184/mo
- Expected delta
- $0/yr ($0/mo · 0.0%)
ⓘ Screening estimate from a state-policy table — verify with the county assessor before closing.
Climate risk First Street
- Flood 3/10 Moderate FEMA zone X (unshaded) · 10% chance over 30 yrs
- Wildfire 1/10 Low
- Heat 9/10 Extreme 7 d/yr ≥105°F today · 16 d/yr by 30 yrs out
- Wind 8/10 Severe 80% chance of damaging wind over 30 yrs
- Air quality 2/10 Low 1 unhealthy d/yr today · 1 by 30 yrs out
Nearby sold comps map
Loading sold comps map…
Walkable amenities ~0.75 mi
Loading nearby amenities…
Taxation est. · year 1
- Rental income
- $21,349
- − Mortgage interest
- −$13,438
- − Property taxes
- −$2,214
- − Insurance
- −$1,200
- − Repairs & maintenance
- −$1,708
- − Management
- −$1,708
- − Depreciation
- −$6,979
- Taxable loss
- −$5,898
- Est. tax savings @ 24.0%
- +$1,415
- After-tax cash flow
- $-229/yr
For passive investors: Depreciation is non-cash, so a rental often shows a tax loss while cash-flowing — sheltering income. Rental losses are passive: they offset passive income freely, and up to $25,000/yr can offset ordinary (W-2) income if you actively participate and your MAGI is under $100k (phasing out to $0 by $150k); unused losses carry forward. On sale, claimed depreciation is recaptured at up to 25%, and gains may owe capital-gains tax (a 1031 exchange can defer both). Figures are a year-1 estimate at your 24.0% rate — not tax advice; consult a CPA.
Schools (NCES district)
- District
- Hampton City Public School District
- NCES district ID
- 5101800
- Math proficiency
- 60% ▼ -21.00%
- Reading proficiency
- 70% ▼ -4.00%
- Median HH income
- $50,089
- Composite
- 55.19/100
- National rank
- #1272
- State rank
- #40 of 131 in VA
Livability — Hampton
- Score
- 75/100
- State rank
- #133
- US rank
- #4302
Category grades
Schools grade is shown separately in the Schools card above.
Census & demographics
- Census place
- Hampton, VA
- County
- Hampton City · 132,421 people
- City population
- 132,421
- Metro
- Virginia Beach-Norfolk-Newport News, VA-NC
- Population (ZIP)
- 14,005
- Household income
- $65,446
- Rent vs Own
- Severe rent burden
- 704.0
Population outlook (Hampton County) Hauer SSP2
- Today (2025)
- 134,055 people
- By 2030
- 131,753 · -1.7%
- By 2040
- 125,017 · -6.7%
- By 2050
- 116,825 · -12.9%
- By 2075
- 97,033 · -27.6%
- By 2100
- 76,188 · -43.2%
Race, ethnicity, and origin ACS 2023
- Neighborhood character
- Diverse neighborhood (Simpson 0.56)
- Race & ethnicity
- Black 59% White 31% Two or more races 6% Hispanic / Latino 4%
- Common ancestry
- Serbian 2% Italian 2% Romanian 1%
- Foreign-born
- 3% · Canada
- Languages at home
- 95% English-only · Spanish 2% French/Haitian/Cajun 1% Arabic 1%
Political lean MEDSL · Hampton
- 2024 margin
- Solid D (+39.9) · D 69.2% · R 29.4% · Other 1.4%
- 2008→2024 swing
- +1.0pp no change · 2008: 38.9pp · 2024: 39.9pp
- All cycles
- 2024: D+39.9 2020: D+42.2 2016: D+37.8 2012: D+45.4 2008: D+38.9
Not yet ingested
- Civics
- —
Market trends
- HPI YoY
- ▼ -54.95%
- Current HPI
- 274.2769
- Rent YoY
- ▲ 21.35%
- Metro
- Virginia Beach-Norfolk-Newport News, VA-NC
- State GDP YoY
- ▲ 2.40%
- F500 in state
- 50
Industry mix (Fortune 500 HQ in VA)
| Industry | F500 HQs | Revenue |
|---|---|---|
| Aerospace / Defense | 4 | $236B |
|
||
| Technology / Defense | 3 | $32B |
|
||
| Financial Services | 2 | $176B |
|
||
| Utilities | 2 | $27B |
|
||
| Insurance | 2 | $25B |
|
||
| Technology | 2 | $15B |
|
||
Price history
+3327.1% since first listed13 events — show timeline
- 2026-06-07 Pending — REINMLS
- 2026-05-27 Contingent — REINMLS
- 2026-05-27 Pending — CBRAR
- 2026-05-27 Pending — WMLS
- 2026-05-15 Price Changed $239,900 REINMLS
- 2026-05-15 Price Changed $239,900 CBRAR
- 2026-05-15 Price Changed $239,900 WMLS
- 2026-04-23 Listed $244,900 WMLS
- 2026-04-23 Listed $244,900 CBRAR
- 2026-04-23 Listed $244,900 REINMLS
- 2026-02-02 Sold (Public Records) $115,000 Public Records
- 2005-09-12 Sold (Public Records) $84,900 Public Records
- 1989-02-01 Sold (Public Records) $7,000 Public Records
Property tax history
+12.2%/yrLatest (2025): $2,214 · +12.6% YoY. Source: county tax records.
Cash-flow waterfall
monthlySold comps — $/sqft
last 12 mo · ≤1 miLoading sold comps…