 🏷️ Likely Rental
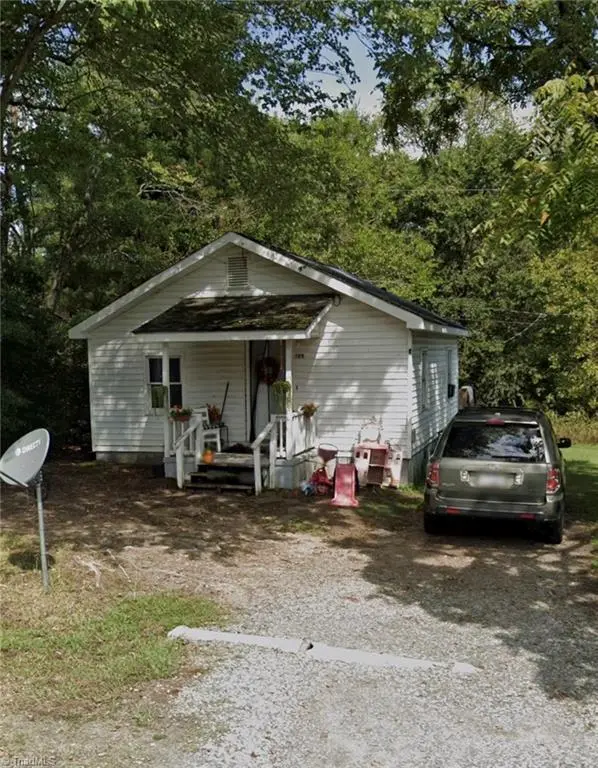
355 Foster St · Burlington, NC
Flood risk 1/10 · Minimal
- FEMA flood zone
- X (unshaded)
- Chance of flooding over 30 yrs
- 0.0%
- Est. flood insurance / yr
- $507 – $1,088
Fire risk 1/10 · Minimal
- Est. fire insurance / yr
- $906 – $1,684
Heat risk 5/10 · Moderate
- Hot days now (above 104°F)
- 7 days/yr
- Hot days in 30 yrs
- 18 days/yr
Wind risk 4/10 · Minor
- Chance of severe wind over 30 yrs
- 19.0%
Air-quality risk 2/10 · Minimal
- Unhealthy air days now
- 2 days/yr
- Unhealthy air days in 30 yrs
- 2 days/yr
Risk factors via First Street. Map © Google.
Why this score? — see what drove the C+ grade
The composite is a weighted blend of 9 inputs, each scored 0–100. Each bar is that input's sub-score; the figure is the points it added to the 100-point composite (weight × sub-score).
- Cash flow +22.0/30.0
- ARV discount +15.0/15.0
- DSCR +7.0/10.0
- 1% rule +4.6/10.0
- Livability +3.5/5.0
- Schools +3.0/10.0
- Rent growth +2.8/5.0
- Condition / age +2.5/5.0
- Appreciation +0.0/10.0
$124,900
🖨 Deal sheet (PDF) 📄 Offer letter ✓ Due diligence
Listing remarks
Home is currently rented for $950/month (Lease expires 3/31/2027) so Buyers will need a LOI/POF to schedule a showing and plenty of advance notice.
Key facts
- 8,886 sq ft lot
- Built 1940
- Listed 15 days
Property features AI
Finance
- Financial info: Annual tax amount listed
- HOA & community: No homeowners association
Exterior
- Parking: Driveway
- Utilities: Public water; Public sewer; Water heater: Unknown; Roads maintained by public authority
- Home design: Residential stick/site built house; One story; Built in 1940; Existing structure
- Construction: Vinyl siding; No fireplaces
- Exterior features: City lot; Lot dimensions approximately 52 x 72 x 51 x 171
Interior
- Kitchen: Kitchen on main level
- Bedrooms: Primary on main
- Bathrooms: 1 full bathroom
- Heating & cooling: Cooling: Other; Heating: See remarks
- Interior features: Primary bedroom located on the main level; Crawl space basement
- Laundry & utility: Laundry room on main level
Neighborhood map
What this means for you Summary
Snapshot
- This is a 2-bed/1.0-bath single-family listed at $125k.
Deal economics
- At list price, monthly cash flow is $199 ($2k/yr) — positive.
- The deal already cash-flows at list — no discount required.
- To meet the 1% rule (rent ≥ 1% of price), the offer needs to be $120k (3.6% below list).
- Recommended offer: $120k (3.6% below list) — sets the bar for 1% rule.
- Cap rate 8.2% vs local median 3.6% in Burlington — top-decile yield for the area; either an underpriced asset or a hidden risk that comps aren't pricing in. Stress-test before assuming the spread holds.
Location & tenants
- Location reads 70/100 on livability (#123 in NC) — a middle-class / working-renter tenant base. Strengths: cost of living A+, housing A+, health & safety A+; Watch: commute D+, schools F, crime F.
- Alamance-Burlington Schools (rural): math 30% / reading 40% proficiency, ranked #133 of 178 in NC (top 75%) — families likely to look elsewhere, expect single-tenant / working-renter base with shorter leases.
- Market conditions: Rents rising (+1.1%/yr); 273 active listings in the ZIP; 4 comparable units currently listed for rent nearby; rentals at typical pace (median 14d on market — plan ~3-4 weeks tenant-placement turnaround); 2,466 units permitted in Alamance County in 2024 (403 in 5+ unit buildings).
Forward outlook
- Local home prices are declining (-3.0%/yr); year-one equity from $864 of loan paydown is wiped out by about $4k of value loss. Plan a longer hold.
- Alamance County population projected at +19% by 2050 — long-run rental-demand tailwind backs the buy-and-hold thesis.
Negotiation context
- It's been on market 16 days — a 2% lower offer ($123k) is reasonable based on typical stale-listing flexibility.
- 2 sale attempts since 21y ago with the ask held roughly flat each time — persistent listings suggest the price (not the market) is what's stuck; bring a comps-based counter.
Risks & watch-outs
- Watch-outs: built in 1940 — expect roof / HVAC / electrical / plumbing capex.
- Climate carrying-cost: extreme-heat days projected 7→18/yr by 2055 (HVAC capex compounding) — expect insurance premiums to compound above CPI over the hold.
Questions for the listing agent
- Built in 1940 — when were the roof, HVAC, electrical panel, plumbing, and water heater last replaced?
- Is there a deadline driving the sale (1031 exchange, divorce, estate, relocation)? That informs how much negotiation room exists.
- Schools are F-rated, which usually means shorter tenancies and higher turnover. Who's the typical renter profile here, and what's been the actual vacancy rate?
- Crime grade is F in this area — have there been break-ins, vandalism, or insurance claims at this property in the last 3 years? What carrier currently insures it and at what premium?
- What's the average days-on-market for RENTAL listings here right now (not sales)? A rising rental-DOM trend means longer vacancies and softer asking-rent achievability than the comps imply.
- What's the recent tenant-quality profile in this submarket — average credit score on applications, eviction rate, late-payment / NSF rate, and stable-employment percentage? A property-management company in the area should have these aggregated.
- How much new for-sale + rental construction is in the pipeline within 1–3 miles? Heavy new supply typically softens prices + rents 12–24 months out; constrained supply supports both.
Investment metrics
- 1% rule
- 0.96% ✗
- Cap rate
- 8.20%
- Cash-on-cash
- 6.82%
- DSCR
- 1.30
- GRM
- 8.6
CMA / ARV
- ARV (on-the-fly)
- $173,664
- Comps found
- 2
Show comp detail 2 sales within ~0.75 mi
| Address | Dist | Beds/Ba | Sqft | Sold | Price | $/sf | Match |
|---|---|---|---|---|---|---|---|
| 1204 Avondale Dr | 0.48mi | 1/1.0 (-1) | 580 (-10%) | 8mo | $80,000 | $138 | 49 |
| 1210 Shaw St | 0.63mi | 2/1.0 | 727 (+12%) | 13mo | $195,000 | $268 | 39 |
Match score weights: distance 35% · size 25% · config 20% · recency 20%. Top-matched comps best support the ARV.
Projected returns pro-forma
-3.0% appreciation · 1.06% rent growth · sell at horizon
- IRR
- -7.8%
- Equity multiple
- 0.72×
- Total profit
- $-9,932
- Equity at exit
- $18,623
- IRR
- -0.7%
- Equity multiple
- 0.95×
- Total profit
- $-1,649
- Equity at exit
- $10,799
Cash invested: $34,972 (down + closing). Projections, not guarantees.
Landlord ↔ Tenant lean methodology
- Overall (STATE)
- 85 Strongly Landlord-Friendly
- State North Carolina
- 85 Strongly Landlord-Friendly · R+3
- County
- — inherits STATE
- City
- — inherits STATE
ZIP-level market 27217
- Home prices YoY
- -22.3%
- Rents YoY
- 1.1%
- Active inventory
- 273
- Price-to-rent
- 8.6×
Monthly cashflow live
- Estimated rent
- $1,205 medium interval (Pro) →
- Mortgage (P&I)
- −$655
- Tax from tax record
- −$46 /mo · $549/yr
- Insurance
- −$52
- HOA
- −$0
- Vacancy / Maint / Mgmt
- −$253
- Net cashflow
- $199
Break-even live
Sensitivity live
| Price | -10% $270 | -5% $234 | +0% $199 | +5% $163 | +10% $128 |
|---|---|---|---|---|---|
| Rent | -10% $104 | -5% $151 | +0% $199 | +5% $246 | +10% $294 |
| Rate | -1.0pp $262 | -0.5pp $231 | base $199 | +0.5pp $166 | +1.0pp $134 |
UW: 25.0% down · 7.5% · 30yr · 1.5% tax · 5.0% vac · 8.0% maint · 8.0% mgmt
Financing live
Cash to close
- Down payment
- $31,225
- Closing costs
- $3,747
- Reserves months
- —
- Total cash needed
- —
Loan-product check · same deal, 3 products live
Conventional
25% down · 7.5% · 30yr
- Down + closing
- —
- Monthly P&I
- —
- Monthly cashflow
- —
- DSCR
- —
- Eligible?
- —
Personal DTI + credit; lowest rate.
DSCR
20% down · 8.5% · 30yr
- Down + closing
- —
- Monthly P&I
- —
- Monthly cashflow
- —
- DSCR
- —
- Eligible?
- —
No personal income docs; deal must DSCR.
Hard money
10% down · 12.0% · 12mo
- Down + closing
- —
- Monthly P&I
- —
- Monthly cashflow
- —
- DSCR
- —
- Eligible?
- —
Short-term bridge; refi at stabilization.
Rent comps 4 comps
| Address | Beds | Baths | Sqft | Rent | $/sqft | DOM | Units | Dist |
|---|---|---|---|---|---|---|---|---|
| 1000 Camden St Burlington, NC | 2.0 | 1.0 | 600 | $1,095 | $1.82 | 14d | 1 | 0.59mi |
| 824 Chandler Ave Burlington, NC | 2.0 | 1.0 | 750 | $1,275 | $1.70 | 14d | 1 | 0.81mi |
| 317 Caswell St Unit 2 Burlington, NC | 1.0 | 1.0 | 650 | $750 | $1.15 | 21d | 1 | 1.24mi |
| 1055 Baldwin Ridge Rd Burlington, NC | 1.0–3.0 | 1.0–2.0 | 1025 | $1,512 | $1.48 | 14d | 19 | 1.47mi |
Listing history 13 events
-
2026-06-19days on market $124,900 Active 16 DOM
-
2026-06-18days on market $124,900 Active 15 DOM
-
2026-06-17days on market $124,900 Active 14 DOM
-
2026-06-16days on market $124,900 Active 13 DOM
-
2026-06-15days on market $124,900 Active 12 DOM
-
2026-06-14days on market $124,900 Active 10 DOM
-
2026-06-13days on market $124,900 Active 9 DOM
-
2026-06-10days on market $124,900 Active 7 DOM
-
2026-06-09days on market $124,900 Active 6 DOM
-
2026-06-08days on market $124,900 Active 5 DOM
-
2026-06-07days on market $124,900 Active 4 DOM
-
2026-06-05remarks 147-char remark
-
2026-06-05$124,900 Active 1 DOM
ⓘ Source: listings_history table (triggers on properties + properties_extension) + one-shot
backfill from property_details.listing_events for pre-trigger history.
Tax reassessment forecast NC · Resets to sale price
- Current annual tax
- $549 · $46/mo
- Projected year-2 tax
- $1,024 · $85/mo
- Expected delta
- +$475/yr (+$40/mo · 86.6%)
ⓘ Screening estimate from a state-policy table — verify with the county assessor before closing.
Climate risk First Street
- Flood 1/10 Low FEMA zone X (unshaded) · 0% chance over 30 yrs
- Wildfire 1/10 Low
- Heat 5/10 Major 7 d/yr ≥104°F today · 18 d/yr by 30 yrs out
- Wind 4/10 Moderate 19% chance of damaging wind over 30 yrs
- Air quality 2/10 Low 2 unhealthy d/yr today · 2 by 30 yrs out
Nearby sold comps map
Loading sold comps map…
Walkable amenities ~0.75 mi
Loading nearby amenities…
Taxation est. · year 1
- Rental income
- $14,455
- − Mortgage interest
- −$6,996
- − Property taxes
- −$549
- − Insurance
- −$624
- − Repairs & maintenance
- −$1,156
- − Management
- −$1,156
- − Depreciation
- −$3,633
- Taxable income
- $339
- Est. tax owed @ 24.0%
- −$81
- After-tax cash flow
- $2,305/yr
For passive investors: Depreciation is non-cash, so a rental often shows a tax loss while cash-flowing — sheltering income. Rental losses are passive: they offset passive income freely, and up to $25,000/yr can offset ordinary (W-2) income if you actively participate and your MAGI is under $100k (phasing out to $0 by $150k); unused losses carry forward. On sale, claimed depreciation is recaptured at up to 25%, and gains may owe capital-gains tax (a 1031 exchange can defer both). Figures are a year-1 estimate at your 24.0% rate — not tax advice; consult a CPA.
Schools (NCES district)
- District
- Alamance-Burlington Schools
- NCES district ID
- 3700030
- Math proficiency
- 30% ▼ -6.00%
- Reading proficiency
- 40% ▲ 2.00%
- Median HH income
- $43,359
- Composite
- 29.68/100
- National rank
- #6460
- State rank
- #133 of 178 in NC
Livability — Burlington
- Score
- 70/100
- State rank
- #123
- US rank
- #7396
Category grades
Schools grade is shown separately in the Schools card above.
Census & demographics
- Census place
- Burlington, NC
- County
- Alamance County · 173,369 people
- City population
- 88,508
- Metro
- Burlington, NC
- Population (ZIP)
- 41,406
- Household income
- $51,950
- Rent vs Own
- Severe rent burden
- 1040.0
Population outlook (Alamance County) Hauer SSP2
- Today (2025)
- 173,381 people
- By 2030
- 180,609 · +4.2%
- By 2040
- 194,327 · +12.1%
- By 2050
- 206,158 · +18.9%
- By 2075
- 235,665 · +35.9%
- By 2100
- 258,626 · +49.2%
Race, ethnicity, and origin ACS 2023
- Neighborhood character
- Diverse neighborhood (Simpson 0.69)
- Race & ethnicity
- White 38% Black 29% Hispanic / Latino 29% Two or more races 7% Native American 1%
- Hispanic origin (detail)
- Mexican 19% Puerto Rican 1%
- Common ancestry
- Serbian 2% Italian 1% Slovak 1%
- Foreign-born
- 13% · Canada
- Languages at home
- 75% English-only · Spanish 24%
Political lean MEDSL · Alamance
- 2024 margin
- Lean R (+8.2) · D 45.4% · R 53.5% · Other 1.1%
- 2008→2024 swing
- +1.1pp toward D · 2008: -9.2pp · 2024: -8.2pp
- All cycles
- 2024: R+8.2 2020: R+8.4 2016: R+12.9 2012: R+14.1 2008: R+9.2
Not yet ingested
- Civics
- —
Market trends
- HPI YoY
- ▼ -74.45%
- Current HPI
- 259.8107
- Rent YoY
- ▲ 1.06%
- Metro
- Burlington, NC
- State GDP YoY
- ▲ 3.28%
- F500 in state
- 26
Industry mix (Fortune 500 HQ in NC)
| Industry | F500 HQs | Revenue |
|---|---|---|
| Financial Services | 2 | $213B |
|
||
| Retail | 2 | $95B |
|
||
| Industrial Conglomerate | 1 | $38B |
|
||
| Metals / Steel | 1 | $35B |
|
||
| Utilities | 1 | $30B |
|
||
| Industrial Machinery | 1 | $19B |
|
||
Price history
+152.3% since first listed4 events — show timeline
- 2026-06-03 Listed $124,900 Triad MLS
- 2007-10-11 Sold (Public Records) $125,500 Public Records
- 2006-03-23 Listing Removed — TMLS
- 2005-09-23 Listed $49,500 TMLS
Property tax history
+12.5%/yrLatest (2025): $549 · +2.6% YoY. Source: county tax records.
Cash-flow waterfall
monthlySold comps — $/sqft
last 12 mo · ≤1 miLoading sold comps…