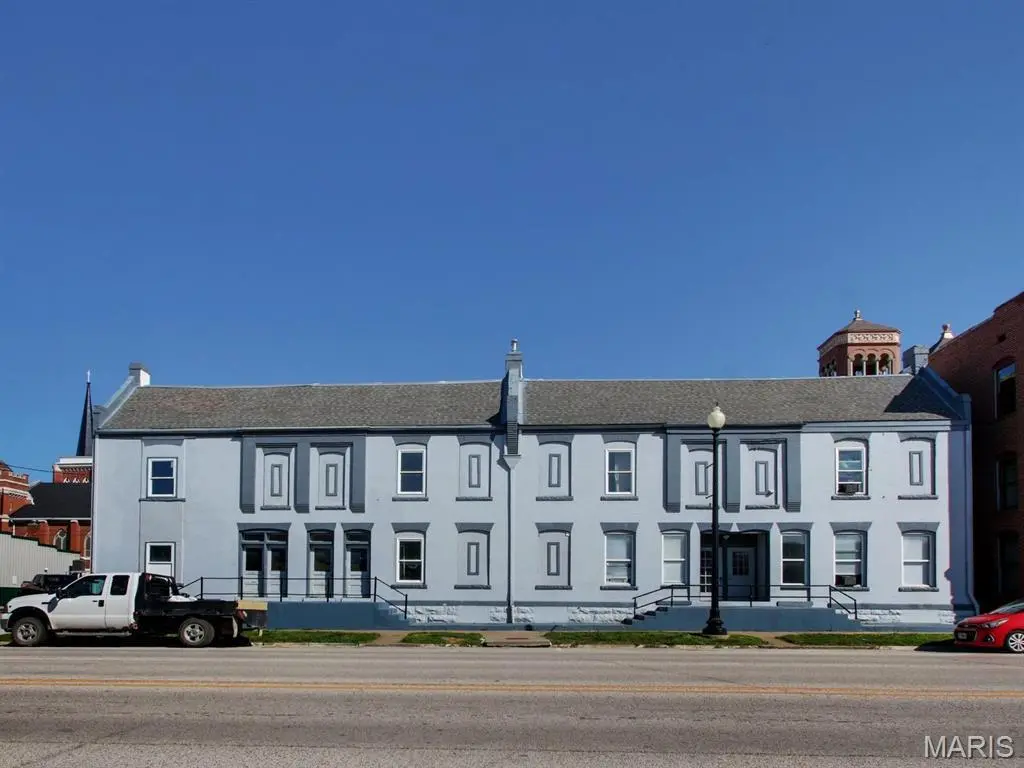
 9-Plex
504 Broadway St · Hannibal, MO
Flood risk 1/10 · Minimal
- FEMA flood zone
- X (unshaded)
- Chance of flooding over 30 yrs
- 0.0%
- Est. flood insurance / yr
- $507 – $1,088
Fire risk 1/10 · Minimal
- Est. fire insurance / yr
- $1,054 – $1,958
Heat risk 4/10 · Minor
- Hot days now (above 106°F)
- 7 days/yr
- Hot days in 30 yrs
- 19 days/yr
Wind risk 2/10 · Minimal
- Chance of severe wind over 30 yrs
- —
Air-quality risk 2/10 · Minimal
- Unhealthy air days now
- 1 days/yr
- Unhealthy air days in 30 yrs
- 1 days/yr
Risk factors via First Street. Map © Google.
Why this score? — see what drove the B grade
The composite is a weighted blend of 9 inputs, each scored 0–100. Each bar is that input's sub-score; the figure is the points it added to the 100-point composite (weight × sub-score).
- Cash flow +30.0/30.0
- 1% rule +10.0/10.0
- DSCR +10.0/10.0
- ARV discount +7.5/15.0
- Condition / age +3.8/5.0
- Livability +3.7/5.0
- Schools +3.4/10.0
- Rent growth +2.5/5.0
- Appreciation +0.0/10.0
$260,000
🖨 Deal sheet 📄 Offer letter ✓ Due diligence
Multi-family units
County records classify this as Multi-Family (5+ Unit). Listing-text estimate: 9 units. confirmed
5+ unit building — per-unit beds/baths from public records are typically unavailable; the breakdown below (if shown) is an estimate from the listing text.
Listing remarks MLS
Value-add 9-unit investment opportunity with income already in place and clear upside ahead! Five finished units currently generate $3,150/month, while three additional units have been gutted and are ready to be finished. The previous roof leak has been addressed, and the final unit will require additional work to get rent-ready. Ideal for an investor looking to increase occupancy, improve cash flow, and build long-term value.
Key facts
- 6,534 sq ft lot
- Built 1895
- Listed 37 days
Neighborhood map
What this means for you Summary
Snapshot
- This is a 9 × 10-bed/?-bath units multifamily listed at $260k. Condition is rated good.
Deal economics
- At list price, monthly cash flow is $6k ($71k/yr) — positive. Per door: $661/mo.
- The deal already cash-flows at list — no discount required.
- Meets the 1% rule at list price ($10k rent vs $260k).
- Recommended offer: $252k (3.0% below list) — sets the bar for market timing.
- Cap rate 33.7% vs local median 3.4% in Hannibal — top-decile yield for the area; either an underpriced asset or a hidden risk that comps aren't pricing in. Stress-test before assuming the spread holds.
Location & tenants
- Location reads 73/100 on livability (#81 in MO) — a middle-class / working-renter tenant base. Strengths: cost of living A+, housing A+, health & safety A+; Watch: schools C-, crime D, employment D.
- Hannibal 60 (town): math 38% / reading 44% proficiency, ranked #142 of 324 in MO (top 44%) — families likely to look elsewhere, expect single-tenant / working-renter base with shorter leases.
- Market conditions: 108 active listings in the ZIP; 38 units permitted in Marion County in 2024 (0 in 5+ unit buildings).
Forward outlook
- Local home prices are declining (-3.0%/yr); year-one equity from $2k of loan paydown is wiped out by about $8k of value loss. Plan a longer hold.
- Marion County population projected to shrink 8% by 2050 — rents likely to lag national; underwrite the cash flow, not the appreciation.
- At projected returns (-3.0% appreciation + 3.0% rent growth), your $73k cash investment doubles in ~2 years — after that, you're playing with house money.
Negotiation context
- It's been on market 37 days — a 3% lower offer ($252k) is reasonable based on typical stale-listing flexibility.
- 2 sale attempts; this cycle's ask has dropped $15k (5%) from the opening price — seller is motivated, your offer sets the floor, not the list.
Risks & watch-outs
- Watch-outs: built in 1895 — expect roof / HVAC / electrical / plumbing capex.
Questions for the listing agent
- It's been on market 37 days. Have you received any prior offers? Is the seller open to a 3% concession, seller financing, or rate buy-down credit?
- Can we see the unit-by-unit rent roll, current vacancy, and any below-market leases? What's the average tenancy length?
- What capital expenditures (roof, boiler, parking lot, exteriors) have been made in the last 5 years, and what's planned in the next 2?
- Built in 1895 — when were the roof, HVAC, electrical panel, plumbing, and water heater last replaced?
- Is there a deadline driving the sale (1031 exchange, divorce, estate, relocation)? That informs how much negotiation room exists.
- Crime grade is D in this area — have there been break-ins, vandalism, or insurance claims at this property in the last 3 years? What carrier currently insures it and at what premium?
- What's the average days-on-market for RENTAL listings here right now (not sales)? A rising rental-DOM trend means longer vacancies and softer asking-rent achievability than the comps imply.
- What's the recent tenant-quality profile in this submarket — average credit score on applications, eviction rate, late-payment / NSF rate, and stable-employment percentage? A property-management company in the area should have these aggregated.
- How much new apartment / multifamily construction is in the pipeline within 1–3 miles? Heavy new supply (>2% of stock underway) typically softens rents 12–24 months out; light construction supports rent growth.
Investment metrics
- 1% rule
- 3.77% ✓
- Cap rate
- 33.74%
- Cash-on-cash
- 98.02%
- DSCR
- 5.36
- GRM
- 2.2
CMA / ARV
No comps found within radius.
Projected returns pro-forma
-3.0% appreciation · 3.0% rent growth · sell at horizon
- IRR
- 99.0%
- Equity multiple
- 5.63×
- Total profit
- $336,770
- Equity at exit
- $38,767
- IRR
- —
- Equity multiple
- 11.74×
- Total profit
- $781,560
- Equity at exit
- $22,480
Cash invested: $72,800 (down + closing). Projections, not guarantees.
Landlord ↔ Tenant lean methodology
- Overall (STATE)
- 81 Strongly Landlord-Friendly
- State Missouri
- 81 Strongly Landlord-Friendly · R+10
- County
- — inherits STATE
- City
- — inherits STATE
ZIP-level market 63401
- Home prices YoY
- -32.9%
- Active inventory
- 108
- Price-to-rent
- 19.9×
Monthly cashflow live
- Estimated rent
- $9,802 medium interval (Pro) →
- Mortgage (P&I)
- −$1,363
- Tax est. 1.5%
- −$325 /mo · $3,900/yr
- Insurance
- −$108
- HOA
- −$0
- Vacancy / Maint / Mgmt
- −$2,058
- Net cashflow
- $5,947
Break-even live
9-unit breakdown (identical units grouped — click to expand)
| Units | Beds | Baths | Est. rent |
|---|---|---|---|
| 9× units | 10 | — | $9,801 |
| #1 | 10 | — | $1,089 |
| #2 | 10 | — | $1,089 |
| #3 | 10 | — | $1,089 |
| #4 | 10 | — | $1,089 |
| #5 | 10 | — | $1,089 |
| #6 | 10 | — | $1,089 |
| #7 | 10 | — | $1,089 |
| #8 | 10 | — | $1,089 |
| #9 | 10 | — | $1,089 |
| Total (9 units) | $9,802 | ||
UW: 25.0% down · 7.5% · 30yr · 1.5% tax · 5.0% vac · 8.0% maint · 8.0% mgmt
Financing live
Cash to close
- Down payment
- $65,000
- Closing costs
- $7,800
- Reserves months
- —
- Total cash needed
- —
Loan-product check · same deal, 3 products live
Conventional
25% down · 7.5% · 30yr
- Down + closing
- —
- Monthly P&I
- —
- Monthly cashflow
- —
- DSCR
- —
- Eligible?
- —
Personal DTI + credit; lowest rate.
DSCR
20% down · 8.5% · 30yr
- Down + closing
- —
- Monthly P&I
- —
- Monthly cashflow
- —
- DSCR
- —
- Eligible?
- —
No personal income docs; deal must DSCR.
Hard money
10% down · 12.0% · 12mo
- Down + closing
- —
- Monthly P&I
- —
- Monthly cashflow
- —
- DSCR
- —
- Eligible?
- —
Short-term bridge; refi at stabilization.
Listing history 15 events
-
2026-06-18days on market $260,000 Active 37 DOM
-
2026-06-17days on market $260,000 Active 36 DOM
-
2026-06-16days on market $260,000 Active 35 DOM
-
2026-06-15days on market $260,000 Active 34 DOM
-
2026-06-13days on market $260,000 Active 32 DOM
-
2026-06-12days on market $260,000 Active 31 DOM
-
2026-06-09days on market $260,000 Active 28 DOM
-
2026-06-08days on market $260,000 Active 27 DOM
-
2026-06-07pricedays on market $260,000 Active 26 DOM
-
2026-06-04days on market $275,000 Active 22 DOM
-
2026-06-02days on market $275,000 Active 21 DOM
-
2026-06-01days on market $275,000 Active 20 DOM
-
2026-05-31days on market $275,000 Active 19 DOM
-
2026-05-12$275,000 Active 430-char remark
Show marketing remark (430 chars)
Value-add 9-unit investment opportunity with income already in place and clear upside ahead! Five finished units currently generate $3,150/month, while three additional units have been gutted and are ready to be finished. The previous roof leak has been addressed, and the final unit will require additional work to get rent-ready. Ideal for an investor looking to increase occupancy, improve cash flow, and build long-term value.
-
2025-05-06$315,000 Active
ⓘ Source: listings_history table (triggers on properties + properties_extension) + one-shot
backfill from property_details.listing_events for pre-trigger history.
Climate risk First Street
- Flood 1/10 Low FEMA zone X (unshaded) · 0% chance over 30 yrs
- Wildfire 1/10 Low
- Heat 4/10 Moderate 7 d/yr ≥106°F today · 19 d/yr by 30 yrs out
- Wind 2/10 Low
- Air quality 2/10 Low 1 unhealthy d/yr today · 1 by 30 yrs out
Nearby sold comps map
Loading sold comps map…
Walkable amenities ~0.75 mi
Loading nearby amenities…
Taxation est. · year 1
- Rental income
- $117,624
- − Mortgage interest
- −$14,564
- − Property taxes
- −$3,900
- − Insurance
- −$1,300
- − Repairs & maintenance
- −$9,410
- − Management
- −$9,410
- − Depreciation
- −$7,564
- Taxable income
- $71,476
- Est. tax owed @ 24.0%
- −$17,154
- After-tax cash flow
- $54,207/yr
For passive investors: Depreciation is non-cash, so a rental often shows a tax loss while cash-flowing — sheltering income. Rental losses are passive: they offset passive income freely, and up to $25,000/yr can offset ordinary (W-2) income if you actively participate and your MAGI is under $100k (phasing out to $0 by $150k); unused losses carry forward. On sale, claimed depreciation is recaptured at up to 25%, and gains may owe capital-gains tax (a 1031 exchange can defer both). Figures are a year-1 estimate at your 24.0% rate — not tax advice; consult a CPA.
Condition & rehab AI · 13 photos
This multi-family property is in good condition with cosmetic updates needed. Modernizing the kitchen and improving the landscaping would significantly increase its value.
Repairs flagged
- Minor Appliances — The appliances appear dated and could be replaced with more modern models.
Value-add opportunities
- Both Modern appliances — Modern appliances would improve the kitchen's functionality and appeal to potential buyers or renters.
- Both Landscaping — A well-maintained landscape can enhance curb appeal and attract more potential buyers or renters.
Renovation cost estimate screening
| Repair item | Severity | Est. cost |
|---|---|---|
| Appliances · The appliances appear dated and could be replaced with more modern models. | Minor | $500–3,000 |
| Total estimated repair cost · 1 items | $500–3,000 |
Value-add ROI direction
- Both Modern appliances — Modern appliances would improve the kitchen's functionality and appeal to potential buyers or renters. ↑
- Both Landscaping — A well-maintained landscape can enhance curb appeal and attract more potential buyers or renters. ↑
ⓘ Cost ranges are severity-bucket heuristics (US national rule-of-thumb). Get contractor quotes + a written scope before underwriting a rehab budget.
Schools (NCES district)
- District
- Hannibal 60
- NCES district ID
- 2913650
- Math proficiency
- 38% ▼ -8.00%
- Reading proficiency
- 44% ▼ -5.00%
- Median HH income
- $40,349
- Composite
- 34.39/100
- National rank
- #5208
- State rank
- #142 of 324 in MO
Livability — Hannibal
- Score
- 73/100
- State rank
- #81
- US rank
- #5358
Category grades
Schools grade is shown separately in the Schools card above.
Census & demographics
- Census place
- Hannibal, MO
- Population (ZIP)
- 21,125
Population outlook (Marion County) Hauer SSP2
- Today (2025)
- 28,640 people
- By 2030
- 28,432 · -0.7%
- By 2040
- 27,597 · -3.6%
- By 2050
- 26,203 · -8.5%
- By 2075
- 21,931 · -23.4%
- By 2100
- 15,765 · -45.0%
Race, ethnicity, and origin ACS 2023
- Neighborhood character
- Predominantly White (88%)
- Race & ethnicity
- White 88% Black 6% Two or more races 4% Hispanic / Latino 3%
- Common ancestry
- Lithuanian 2% Romanian 1% Italian 1%
- Foreign-born
- 1% · Canada
Political lean MEDSL · Marion
- 2024 margin
- Solid R (+52.9) · D 23.1% · R 76.0%
- 2008→2024 swing
- -29.0pp toward R · 2008: -23.9pp · 2024: -52.9pp
- All cycles
- 2024: R+52.9 2020: R+50.3 2016: R+49.8 2012: R+32.0 2008: R+23.9
Not yet ingested
- Civics
- —
Market trends
- HPI YoY
- ▼ -93.01%
- Current HPI
- 189.6907
- Rent YoY
- —
- Metro
- —
- State GDP YoY
- ▲ 1.84%
- F500 in state
- 20
Industry mix (Fortune 500 HQ in MO)
| Industry | F500 HQs | Revenue |
|---|---|---|
| Healthcare | 1 | $163B |
|
||
| Insurance | 1 | $21B |
|
||
| Industrial Technology | 1 | $17B |
|
||
| Retail | 1 | $16B |
|
||
| Industrial Distribution | 1 | $10B |
|
||
| Utilities | 1 | $9B |
|
||
Price history
-12.7% since first listed2 events — show timeline
- 2026-05-12 Listed $275,000 MARIS as Distributed by MLS Grid
- 2025-05-06 Listed $315,000 MARIS as Distributed by MLS Grid
Cash-flow waterfall
monthlySold comps — $/sqft
last 12 mo · ≤1 miLoading sold comps…