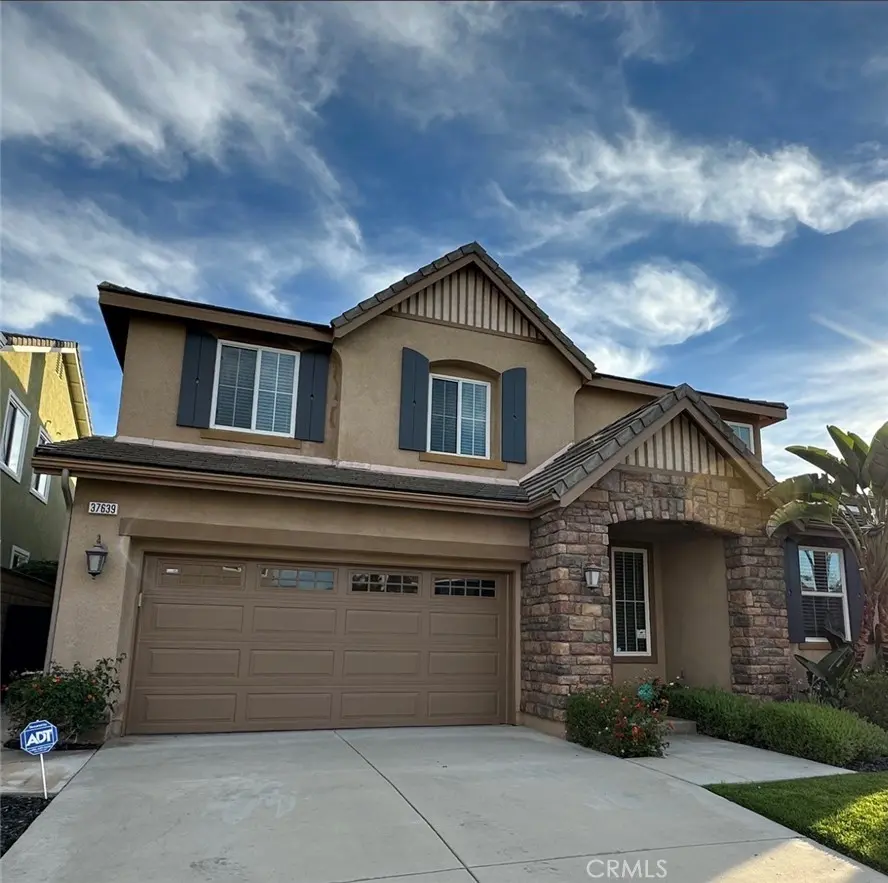
37639 Botanica · Murrieta, CA
Flood risk 1/10 · Minimal
- FEMA flood zone
- X (unshaded)
- Chance of flooding over 30 yrs
- 0.0%
- Est. flood insurance / yr
- $507 – $1,088
Fire risk 9/10 · Severe
- Est. fire insurance / yr
- $659 – $1,223
Heat risk 5/10 · Moderate
- Hot days now (above 105°F)
- 5 days/yr
- Hot days in 30 yrs
- 14 days/yr
Wind risk 1/10 · Minimal
- Chance of severe wind over 30 yrs
- —
Air-quality risk 5/10 · Moderate
- Unhealthy air days now
- 7 days/yr
- Unhealthy air days in 30 yrs
- 9 days/yr
Risk factors via First Street. Map © Google.
Why this score? — see what drove the C grade
The composite is a weighted blend of 9 inputs, each scored 0–100. Each bar is that input's sub-score; the figure is the points it added to the 100-point composite (weight × sub-score).
- Cash flow +17.6/30.0
- ARV discount +14.4/15.0
- DSCR +5.5/10.0
- Schools +5.3/10.0
- 1% rule +3.9/10.0
- Livability +3.4/5.0
- Condition / age +2.5/5.0
- Rent growth +2.3/5.0
- Appreciation +0.0/10.0
$847,999
🖨 Deal sheet 📄 Offer letter ✓ Due diligence
Listing remarks MLS
Absolutely exquisite home with all the right upgrades. Bright, open family style kitchen with granite slab countertops and gourmet island. Family room has a cozy fireplace and built-in entertainment center. Formal living and dining room. .. .perfect for holiday entertaining. Entire house is tastefully painted and shows beautifully! Backyard is fully landscaped with a spectacular view of the hills. .. very private. This backyard is a entertainer's delight with covered patio, built-in BBQ and fire pit. Hurry this gorgeous home won't last! Centrally located with quick access to the I-15 freeway, close to shopping and everything the Murrieta/Temecula Valley has to offer. This home is a MUST SEE!!!!
Key facts
- No rear neighbors
- Covered patio
- Canyon views
Tags
Property features AI
Finance
- Other: Total of 1 unit on property; Lot features: level/flat lot, 0-1 unit/acre
- Financial info: Special assessments; Lease considered
- HOA & community: Curbs; Street lighting; Sidewalks; Suburban setting; Hiking and foothills nearby
Exterior
- Parking: Attached garage; Three garage spaces; Direct garage access; Front-entry garage; Two garage doors; Garage door opener; Driveway parking; Street parking; Three total parking spaces
- Security: Smoke and fire detection system; Carbon monoxide detectors; Firewall(s)
- Utilities: 220V in garage; 220V in laundry; Natural gas connected; Electricity connected; Water connected (district/public); Public sewer; Underground utilities
- Home design: House; Two stories; Entry on front at main level; Faces east; Turnkey condition; No ADU; No common walls
- Construction: Concrete roof; Drywall walls; Block wall and wrought iron fencing; Year built source: assessor
- Exterior features: Covered slab patio; Lighting; Sprinkler system (front and rear, drip system); Lawn; Landscaped; Yard; Has view
Interior
- Kitchen: 6-burner stove; Gas cooktop; Built-in range; Double oven; Electric oven; Range/stove hood; Microwave; Garbage disposal; Dishwasher; Kitchen island; Butler’s pantry; Walk-in pantry; Kitchen open to family room; Granite counters; Breakfast counter/bar; Family kitchen; Formal dining room; In-kitchen eating area
- Bedrooms: Primary bedroom; Main floor bedroom; Walk-in closet; Primary bathroom
- Flooring: Tile; Laminate
- Bathrooms: Four full bathrooms; Separate tub and shower; Shower; Bathtub; Shower in tub; Tile counters; Corian counters; Vanity area; Linen closet/storage; Exhaust fan(s); Remodeled
- Heating & cooling: Central furnace heating; Central electric cooling; Dual cooling
- Interior features: Ceiling fans; Pantry; Recessed lighting; Storage space; Granite counters; Tandem
- Laundry & utility: Laundry room (individual room); Water heater unit; Gas water heater
Neighborhood map
What this means for you Summary
Snapshot
- This is a 6-bed/4.0-bath single-family listed at $848k.
Deal economics
- At list price, monthly cash flow is $672 ($8k/yr) — positive.
- The deal already cash-flows at list — no discount required.
- To meet the 1% rule (rent ≥ 1% of price), the offer needs to be $754k (11.1% below list).
- Recommended offer: $754k (11.1% below list) — sets the bar for 1% rule.
- Cap rate 7.2% vs local median 3.0% in Murrieta — top-decile yield for the area; either an underpriced asset or a hidden risk that comps aren't pricing in. Stress-test before assuming the spread holds.
Location & tenants
- Location reads 68/100 on livability (#279 in CA) — a middle-class / working-renter tenant base. Strengths: amenities A+, employment A+, housing A+; Watch: health & safety D+, commute F, cost of living F.
- Murrieta Valley Unified (suburban): math 51% / reading 64% proficiency, ranked #255 of 1,400 in CA (top 18%) — acceptable for families but not a draw, mixed tenant base, ~2y average lease.
- Market conditions: Rents soft (-0.7%/yr); 354 active listings in the ZIP; 2 comparable units currently listed for rent nearby; high-income renter base; 9,195 units permitted in Riverside County in 2024 (1,512 in 5+ unit buildings).
- At $7,537/mo this rent would consume 79% of the median local household income ($114k/yr) (locally 1424% of renters already pay >50% of income on rent) — very limited rent-growth headroom before tenants either downsize or default.
Forward outlook
- Local home prices are declining (-3.0%/yr); year-one equity from $6k of loan paydown is wiped out by about $25k of value loss. Plan a longer hold.
- Riverside County population projected at +22% by 2050 — long-run rental-demand tailwind backs the buy-and-hold thesis.
Negotiation context
- Only 1 days on market — expect competitive offers; lowballing is unlikely to land.
- 3 sale attempts since 18y ago with the ask held roughly flat each time — persistent listings suggest the price (not the market) is what's stuck; bring a comps-based counter.
- Current owner paid $328k; list at $848k implies a 159% gain — meaningful room to come down on a strong offer.
Risks & watch-outs
- Climate carrying-cost: severe wildfire risk; extreme-heat days projected 5→14/yr by 2055 (HVAC capex compounding) — expect insurance premiums to compound above CPI over the hold.
Questions for the listing agent
- Is there a deadline driving the sale (1031 exchange, divorce, estate, relocation)? That informs how much negotiation room exists.
- Schools are B-rated — typically a magnet for longer-tenancy family renters. What's the average tenant stay here, and is there a school-zone premium baked into asking?
- What's the average days-on-market for RENTAL listings here right now (not sales)? A rising rental-DOM trend means longer vacancies and softer asking-rent achievability than the comps imply.
- What's the recent tenant-quality profile in this submarket — average credit score on applications, eviction rate, late-payment / NSF rate, and stable-employment percentage? A property-management company in the area should have these aggregated.
- How much new for-sale + rental construction is in the pipeline within 1–3 miles? Heavy new supply typically softens prices + rents 12–24 months out; constrained supply supports both.
Investment metrics
- 1% rule
- 0.89% ✗
- Cap rate
- 7.24%
- Cash-on-cash
- 3.40%
- DSCR
- 1.15
- GRM
- 9.4
CMA / ARV
- ARV (on-the-fly)
- $1,002,650
- Comps found
- 12
Show comp detail 12 sales within ~0.75 mi
| Address | Dist | Beds/Ba | Sqft | Sold | Price | $/sf | Match |
|---|---|---|---|---|---|---|---|
| 22783 Montanya Pl | 0.21mi | 6/4.0 | 3,646 (0%) | 2mo | $760,000 | $208 | 89 |
| 22936 Belcara Pl | 0.08mi | 6/4.0 | 3,646 (0%) | 15mo | $845,000 | $232 | 84 |
| 37615 Botanica Pl | 0.03mi | 5/4.0 (-1) | 3,646 (0%) | 13mo | $1,050,000 | $288 | 83 |
| 37647 Botanica Pl | 0.01mi | 5/3.0 (-1) | 3,306 (-9%) | 18mo | $850,000 | $257 | 60 |
| 38236 Oak Bluff Ln | 0.55mi | 5/3.0 (-1) | 3,776 (+4%) | 7mo | $1,210,000 | $320 | 54 |
| 42758 Settlers | 0.34mi | 5/3.0 (-1) | 3,165 (-13%) | 8mo | $1,350,000 | $427 | 46 |
| 37541 Windsor Ct | 0.74mi | 5/3.5 (-1) | 3,441 (-6%) | 6mo | $955,000 | $278 | 44 |
| 38229 Placer Creek St | 0.67mi | 5/3.0 (-1) | 3,476 (-5%) | 14mo | $850,000 | $245 | 40 |
| 23429 Bristol Way | 0.65mi | 5/2.5 (-1) | 3,441 (-6%) | 12mo | $850,000 | $247 | 39 |
| 23549 Bending Oak Ct | 0.60mi | 5/3.0 (-1) | 3,165 (-13%) | 5mo | $870,000 | $275 | 37 |
| 42711 Mountain Shadow Rd | 0.48mi | 5/3.0 (-1) | 3,165 (-13%) | 18mo | $1,080,000 | $341 | 31 |
| 38194 Clear Creek St | 0.72mi | 5/3.0 (-1) | 3,287 (-10%) | 12mo | $847,500 | $258 | 31 |
Match score weights: distance 35% · size 25% · config 20% · recency 20%. Top-matched comps best support the ARV.
Projected returns pro-forma
-3.0% appreciation · 0.0% rent growth · sell at horizon
- IRR
- -14.1%
- Equity multiple
- 0.51×
- Total profit
- $-116,926
- Equity at exit
- $126,439
- IRR
- -10.5%
- Equity multiple
- 0.44×
- Total profit
- $-133,031
- Equity at exit
- $73,319
Cash invested: $237,440 (down + closing). Projections, not guarantees.
Landlord ↔ Tenant lean methodology
- Overall (STATE)
- 18 Strongly Tenant-Friendly
- State California
- 18 Strongly Tenant-Friendly · D+13
- County
- — inherits STATE
- City
- — inherits STATE
ZIP-level market 92562
- Home prices YoY
- -27.7%
- Rents YoY
- -0.7%
- Active inventory
- 354
- Price-to-rent
- 9.4×
Monthly cashflow live
- Estimated rent
- $7,537 medium interval (Pro) →
- Mortgage (P&I)
- −$4,447
- Tax from tax record
- −$482 /mo · $5,783/yr
- Insurance
- −$353
- HOA
- −$0
- Vacancy / Maint / Mgmt
- −$1,583
- Net cashflow
- $672
Break-even live
UW: 25.0% down · 7.5% · 30yr · 1.5% tax · 5.0% vac · 8.0% maint · 8.0% mgmt
Financing live
Cash to close
- Down payment
- $212,000
- Closing costs
- $25,440
- Reserves months
- —
- Total cash needed
- —
Loan-product check · same deal, 3 products live
Conventional
25% down · 7.5% · 30yr
- Down + closing
- —
- Monthly P&I
- —
- Monthly cashflow
- —
- DSCR
- —
- Eligible?
- —
Personal DTI + credit; lowest rate.
DSCR
20% down · 8.5% · 30yr
- Down + closing
- —
- Monthly P&I
- —
- Monthly cashflow
- —
- DSCR
- —
- Eligible?
- —
No personal income docs; deal must DSCR.
Hard money
10% down · 12.0% · 12mo
- Down + closing
- —
- Monthly P&I
- —
- Monthly cashflow
- —
- DSCR
- —
- Eligible?
- —
Short-term bridge; refi at stabilization.
Rent comps 2 comps
| Address | Beds | Baths | Sqft | Rent | $/sqft | DOM | Units | Dist |
|---|---|---|---|---|---|---|---|---|
| 22053 Highland St Wildomar, CA | 5.0 | 3.5 | 4376 | $17,000 | $3.88 | 5d | 1 | 1.25mi |
| 36413 Wandering Rill St Wildomar, CA | 5.0 | 4.0 | 4018 | $5,000 | $1.24 | 43d | 1 | 1.38mi |
Listing history 5 events
-
2026-06-17statusdays on market $847,999 Active 1 DOM
-
2026-06-16days on market $847,999 Coming Soon 5 DOM
-
2026-06-15days on market $847,999 Coming Soon 4 DOM
-
2026-06-13remarks 699-char remark
-
2026-06-13$847,999 Coming Soon 2 DOM
ⓘ Source: listings_history table (triggers on properties + properties_extension) + one-shot
backfill from property_details.listing_events for pre-trigger history.
Tax reassessment forecast CA · Resets to sale price
- Current annual tax
- $5,783 · $482/mo
- Projected year-2 tax
- $6,445 · $537/mo
- Expected delta
- +$661/yr (+$55/mo · 11.4%)
ⓘ Screening estimate from a state-policy table — verify with the county assessor before closing.
Climate risk First Street
- Flood 1/10 Low FEMA zone X (unshaded) · 0% chance over 30 yrs
- Wildfire 9/10 Extreme
- Heat 5/10 Major 5 d/yr ≥105°F today · 14 d/yr by 30 yrs out
- Wind 1/10 Low
- Air quality 5/10 Major 7 unhealthy d/yr today · 9 by 30 yrs out
Nearby sold comps map
Loading sold comps map…
Walkable amenities ~0.75 mi
Loading nearby amenities…
Taxation est. · year 1
- Rental income
- $90,449
- − Mortgage interest
- −$47,501
- − Property taxes
- −$5,783
- − Insurance
- −$4,240
- − Repairs & maintenance
- −$7,236
- − Management
- −$7,236
- − Depreciation
- −$24,669
- Taxable loss
- −$6,217
- Est. tax savings @ 24.0%
- +$1,492
- After-tax cash flow
- $9,559/yr
For passive investors: Depreciation is non-cash, so a rental often shows a tax loss while cash-flowing — sheltering income. Rental losses are passive: they offset passive income freely, and up to $25,000/yr can offset ordinary (W-2) income if you actively participate and your MAGI is under $100k (phasing out to $0 by $150k); unused losses carry forward. On sale, claimed depreciation is recaptured at up to 25%, and gains may owe capital-gains tax (a 1031 exchange can defer both). Figures are a year-1 estimate at your 24.0% rate — not tax advice; consult a CPA.
Schools (NCES district)
- District
- Murrieta Valley Unified
- NCES district ID
- 0600029
- Math proficiency
- 51% ▲ 3.00%
- Reading proficiency
- 64% ▲ 4.00%
- Median HH income
- $78,615
- Composite
- 53.42/100
- National rank
- #3152
- State rank
- #255 of 1400 in CA
Livability — Murrieta
- Score
- 68/100
- State rank
- #279
- US rank
- #9348
Category grades
Schools grade is shown separately in the Schools card above.
Census & demographics
- Census place
- Murrieta, CA
- County
- Riverside County · 2,287,001 people
- City population
- 145,160
- Metro
- Riverside-San Bernardino-Ontario, CA
- Population (ZIP)
- 64,781
- Household income
- $114,266
- Rent vs Own
- Severe rent burden
- 1424.0
Population outlook (Riverside County) Hauer SSP2
- Today (2025)
- 2,664,475 people
- By 2030
- 2,802,692 · +5.2%
- By 2040
- 3,050,904 · +14.5%
- By 2050
- 3,256,783 · +22.2%
- By 2075
- 3,655,058 · +37.2%
- By 2100
- 3,766,594 · +41.4%
Race, ethnicity, and origin ACS 2023
- Neighborhood character
- Diverse neighborhood (Simpson 0.62)
- Race & ethnicity
- White 52% Hispanic / Latino 32% Two or more races 16% Asian 6% Black 4%
- Hispanic origin (detail)
- Mexican 26%
- Common ancestry
- Italian 4% Lithuanian 2% Slovak 2%
- Foreign-born
- 14% · Canada, Vietnam, South Korea
- Languages at home
- 77% English-only · Spanish 15% Tagalog/Filipino 1% Other Asian/Pacific 1%
Political lean MEDSL · Riverside
- 2024 margin
- Toss-up / Even · D 48.0% · R 49.3% · Other 2.6%
- 2008→2024 swing
- -3.6pp toward R · 2008: 2.3pp · 2024: -1.3pp
- All cycles
- 2024: R+1.3 2020: D+8.0 2016: D+4.3 2012: R+0.4 2008: D+2.3
Not yet ingested
- Civics
- —
Market trends
- HPI YoY
- ▼ -124.36%
- Current HPI
- 323.9003
- Rent YoY
- ▼ -0.73%
- Metro
- Riverside-San Bernardino-Ontario, CA
- State GDP YoY
- ▲ 3.21%
- F500 in state
- 116
Industry mix (Fortune 500 HQ in CA)
| Industry | F500 HQs | Revenue |
|---|---|---|
| Technology | 27 | $1,492B |
|
||
| Financial Services | 3 | $174B |
|
||
| Retail | 3 | $44B |
|
||
| Insurance | 3 | $26B |
|
||
| Media / Entertainment | 2 | $115B |
|
||
| Pharmaceuticals / Biotech | 2 | $62B |
|
||
Price history
+150.1% since first listed13 events — show timeline
- 2026-06-11 Coming Soon $847,999 CRMLS
- 2026-04-29 Listing Removed — CRMLS
- 2025-11-05 Price Changed $849,999 CRMLS
- 2025-08-27 Listed $869,999 CRMLS
- 2025-02-13 Rental Removed $3,875 CRMLS
- 2024-10-30 Price Changed $3,875 CRMLS
- 2024-10-02 Price Changed $3,975 CRMLS
- 2024-08-03 Listed for Rent $4,100 CRMLS
- 2009-02-10 Sold (Public Records) $328,000 Public Records
- 2009-02-10 Sold (MLS) $328,000 CRMLS
- 2008-11-16 Listing Removed — CRMLS
- 2008-09-07 Contingent — CRMLS
- 2008-09-04 Listed $339,000 CRMLS
Property tax history
-1.2%/yrLatest (2025): $5,783 · +2.0% YoY. Source: county tax records.
Cash-flow waterfall
monthlySold comps — $/sqft
last 12 mo · ≤1 miLoading sold comps…