384 F St · Shaler, PA
Flood risk 1/10 · Minimal
- FEMA flood zone
- X (unshaded)
- Chance of flooding over 30 yrs
- 0.0%
- Est. flood insurance / yr
- $473 – $860
Fire risk 1/10 · Minimal
- Est. fire insurance / yr
- $511 – $949
Heat risk 3/10 · Minor
- Hot days now (above 98°F)
- 7 days/yr
- Hot days in 30 yrs
- 17 days/yr
Wind risk 2/10 · Minimal
- Chance of severe wind over 30 yrs
- 0.0%
Air-quality risk 4/10 · Minor
- Unhealthy air days now
- 4 days/yr
- Unhealthy air days in 30 yrs
- 5 days/yr
Risk factors via First Street. Map © Google.
Why this score? — see what drove the C- grade
The composite is a weighted blend of 9 inputs, each scored 0–100. Each bar is that input's sub-score; the figure is the points it added to the 100-point composite (weight × sub-score).
- Cash flow +16.7/30.0
- ARV discount +15.0/15.0
- DSCR +5.2/10.0
- 1% rule +4.6/10.0
- Schools +4.1/10.0
- Rent growth +3.8/5.0
- Livability +2.5/5.0
- Condition / age +2.5/5.0
- Appreciation +0.0/10.0
$155,000
🖨 Deal sheet 📄 Offer letter ✓ Due diligence
Listing remarks MLS
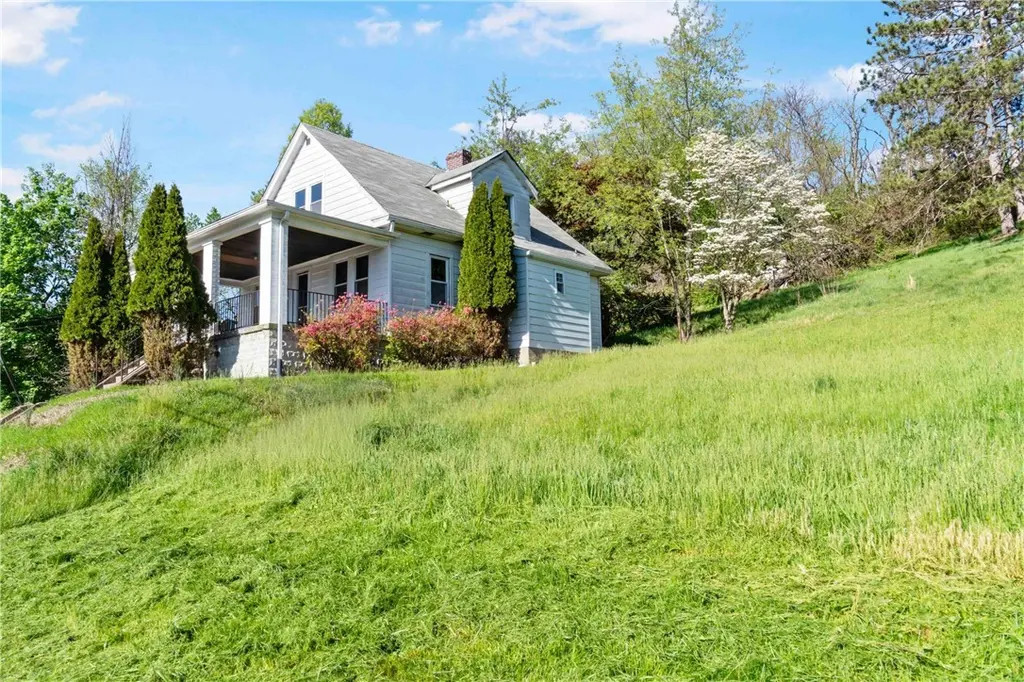
Opportunity awaits with this 3-bedroom, 2-bath Cape Cod situated on a generous corner lot totaling nearly ¾ of an acre across three parcels. Located in Shaler Area School District, this property offers strong rental or resale potential. Features include a newer furnace, flexible layout, and ample outdoor space for expansion or additional structures. Whether you're looking to renovate, rent, or build, this prime location offers multiple exit strategies. Don’t miss your chance to capitalize on this rare multi-parcel investment!
Key facts
- Covered front porch
- Walkout basement
- Integral garage
Tags
Property features AI
Exterior
- Parking: Attached garage; Built-in parking
- Utilities: Public water service; Public sewer service
- Home design: 2-story home
- Exterior features: Public water; Public sewer; Lot approximately 0.235 acres; Resale property
Interior
- Bathrooms: 2 full bathrooms
- Heating & cooling: Forced air heating; Gas heating
- Interior features: Unfinished walk-out basement; Basement present
Neighborhood map
What this means for you Summary
Snapshot
- This is a 2-bed/1.0-bath single-family listed at $155k.
Deal economics
- At list price, monthly cash flow is $96 ($1k/yr) — positive.
- The deal already cash-flows at list — no discount required.
- To meet the 1% rule (rent ≥ 1% of price), the offer needs to be $148k (4.4% below list).
- Recommended offer: $148k (4.4% below list) — sets the bar for 1% rule.
Location & tenants
- Location reads: area grade C — affects rentability + tenant quality, not the cash-flow math above.
- Shaler Area SD (suburban): math 36% / reading 59% proficiency, ranked #208 of 539 in PA (top 39%) — families likely to look elsewhere, expect single-tenant / working-renter base with shorter leases.
- Market conditions: Rents rising fast (+5.3%/yr); 26 active listings in the ZIP; 13 comparable units currently listed for rent nearby; rentals at typical pace (median 24d on market — plan ~3-4 weeks tenant-placement turnaround); solid renter incomes; 2,996 units permitted in Allegheny County in 2024 (1,588 in 5+ unit buildings).
Forward outlook
- Local home prices are declining (-3.0%/yr); year-one equity from $1k of loan paydown is wiped out by about $5k of value loss. Plan a longer hold.
Negotiation context
- It's been on market 44 days — a 3% lower offer ($150k) is reasonable based on typical stale-listing flexibility.
- 4 sale attempts since 29y ago with the ask held roughly flat each time — persistent listings suggest the price (not the market) is what's stuck; bring a comps-based counter.
- Current owner paid $68k; list at $155k implies a 128% gain — meaningful room to come down on a strong offer.
Risks & watch-outs
- Watch-outs: built in 1940 — expect roof / HVAC / electrical / plumbing capex.
Questions for the listing agent
- It's been on market 44 days. Have you received any prior offers? Is the seller open to a 4% concession, seller financing, or rate buy-down credit?
- Built in 1940 — when were the roof, HVAC, electrical panel, plumbing, and water heater last replaced?
- Is there a deadline driving the sale (1031 exchange, divorce, estate, relocation)? That informs how much negotiation room exists.
- What's the average days-on-market for RENTAL listings here right now (not sales)? A rising rental-DOM trend means longer vacancies and softer asking-rent achievability than the comps imply.
- What's the recent tenant-quality profile in this submarket — average credit score on applications, eviction rate, late-payment / NSF rate, and stable-employment percentage? A property-management company in the area should have these aggregated.
- How much new for-sale + rental construction is in the pipeline within 1–3 miles? Heavy new supply typically softens prices + rents 12–24 months out; constrained supply supports both.
Investment metrics
- 1% rule
- 0.96% ✗
- Cap rate
- 7.03%
- Cash-on-cash
- 2.64%
- DSCR
- 1.12
- GRM
- 8.7
CMA / ARV
- ARV (median comp)
- $252,419
- List price
- $155,000
- Delta
- -38.59%
- Verdict
- UNDERPRICED
- Comps
- 20 within 1.0 mi
Show comp detail 12 sales within ~0.75 mi
| Address | Dist | Beds/Ba | Sqft | Sold | Price | $/sf | Match |
|---|---|---|---|---|---|---|---|
| 498 Seavey Rd | 0.07mi | 3/1.5 (+1) | 1,353 (+7%) | 3mo | $257,000 | $190 | 76 |
| 15 Old Soose Rd Unit A | 0.21mi | 3/1.5 (+1) | 1,344 (+6%) | 1mo | $83,000 | $62 | 72 |
| 44 Greeley Ave | 0.44mi | 2/1.0 | 1,224 (-3%) | 9mo | $75,000 | $61 | 66 |
| 146 Buckeye Way | 0.33mi | 3/2.0 (+1) | 1,188 (-6%) | 3mo | $232,000 | $195 | 63 |
| 410 Winterset Dr | 0.30mi | 3/2.0 (+1) | 1,200 (-5%) | 8mo | $225,000 | $188 | 62 |
| 137 Vista St | 0.48mi | 2/1.0 | 1,366 (+8%) | 5mo | $195,000 | $143 | 61 |
| 206 Rebecca St | 0.35mi | 3/1.5 (+1) | 1,163 (-8%) | 6mo | $235,000 | $202 | 58 |
| 174 Seavey Rd | 0.38mi | 3/1.5 (+1) | 1,155 (-9%) | 6mo | $215,000 | $186 | 55 |
| 2 Greeley Ave | 0.55mi | 3/2.0 (+1) | 1,232 (-3%) | 8mo | $271,000 | $220 | 54 |
| 396 Friday Rd | 0.68mi | 2/1.0 | 1,170 (-8%) | 9mo | $130,000 | $111 | 48 |
| 9529 Charley Dr | 0.41mi | 3/2.5 (+1) | 1,416 (+12%) | 4mo | $314,900 | $222 | 48 |
| 7 Spring Street Ext | 0.51mi | 3/2.0 (+1) | 1,384 (+9%) | 10mo | $175,000 | $126 | 44 |
Match score weights: distance 35% · size 25% · config 20% · recency 20%. Top-matched comps best support the ARV.
Projected returns pro-forma
-3.0% appreciation · 5.31% rent growth · sell at horizon
- IRR
- -9.5%
- Equity multiple
- 0.64×
- Total profit
- $-15,478
- Equity at exit
- $23,111
- IRR
- 2.8%
- Equity multiple
- 1.22×
- Total profit
- $9,626
- Equity at exit
- $13,402
Cash invested: $43,400 (down + closing). Projections, not guarantees.
Landlord ↔ Tenant lean methodology
- Overall (STATE)
- 62 Landlord-Friendly
- State Pennsylvania
- 62 Landlord-Friendly · EVEN
- County
- — inherits STATE
- City
- — inherits STATE
ZIP-level market 15209
- Home prices YoY
- -27.7%
- Rents YoY
- 5.3%
- Active inventory
- 26
- Price-to-rent
- 8.7×
Monthly cashflow live
- Estimated rent
- $1,482 high interval (Pro) →
- Mortgage (P&I)
- −$813
- Tax from tax record
- −$198 /mo · $2,375/yr
- Insurance
- −$65
- HOA
- −$0
- Vacancy / Maint / Mgmt
- −$311
- Net cashflow
- $96
Break-even live
UW: 25.0% down · 7.5% · 30yr · 1.5% tax · 5.0% vac · 8.0% maint · 8.0% mgmt
Financing live
Cash to close
- Down payment
- $38,750
- Closing costs
- $4,650
- Reserves months
- —
- Total cash needed
- —
Loan-product check · same deal, 3 products live
Conventional
25% down · 7.5% · 30yr
- Down + closing
- —
- Monthly P&I
- —
- Monthly cashflow
- —
- DSCR
- —
- Eligible?
- —
Personal DTI + credit; lowest rate.
DSCR
20% down · 8.5% · 30yr
- Down + closing
- —
- Monthly P&I
- —
- Monthly cashflow
- —
- DSCR
- —
- Eligible?
- —
No personal income docs; deal must DSCR.
Hard money
10% down · 12.0% · 12mo
- Down + closing
- —
- Monthly P&I
- —
- Monthly cashflow
- —
- DSCR
- —
- Eligible?
- —
Short-term bridge; refi at stabilization.
Rent comps 13 comps
| Address | Beds | Baths | Sqft | Rent | $/sqft | DOM | Units | Dist |
|---|---|---|---|---|---|---|---|---|
| 212 Hugel Dr Unit 1 Pittsburgh, PA | 2.0 | 1.0 | 1200 | $1,450 | $1.21 | 23d | 1 | 0.60mi |
| 39 Prospect St Pittsburgh, PA | 2.0 | 1.0 | 1056 | $1,200 | $1.14 | 7d | 1 | 0.72mi |
| 621 Butler St Unit BS Pittsburgh, PA | 2.0 | 1.0 | 1000 | $995 | $0.99 | 43d | 1 | 0.79mi |
| 20 Beyrleye Ave Pittsburgh, PA | 3.0 | 2.0 | 1100 | $1,350 | $1.23 | 23d | 1 | 0.84mi |
| 903 North Ave Unit 2 Millvale, PA | 1.0 | 1.0 | 900 | $875 | $0.97 | 23d | 1 | 0.86mi |
| 903 North Ave Unit 2 Millvale, PA | 1.0 | 1.0 | 900 | $875 | $0.97 | 43d | 1 | 0.86mi |
| 160 56th St Pittsburgh, PA | 3.0 | 3.0 | 1737 | $3,900 | $2.25 | 19d | 1 | 1.06mi |
| 5275 Butler St Pittsburgh, PA | 2.0 | 1.0–2.0 | 885 | $4,076 | $4.61 | 1d | 130 | 1.09mi |
| 5264 Dresden Way Pittsburgh, PA | 2.0 | 2.0 | 1853 | $2,500 | $1.35 | 23d | 1 | 1.13mi |
| 553 Foundry St Pittsburgh, PA | 2.0 | 2.0 | 1025 | $1,650 | $1.61 | 21d | 1 | 1.27mi |
| 17 Cambria Pt Pittsburgh, PA | 3.0 | 4.0 | 1692 | $1,995 | $1.18 | 43d | 1 | 1.28mi |
| 14 Bethany Dr Unit A Pittsburgh, PA | 2.0 | 1.5 | 1032 | $1,650 | $1.60 | 43d | 1 | 1.32mi |
| 105 Davis St Pittsburgh, PA | 1.0 | 1.0 | 926 | $1,200 | $1.30 | 43d | 1 | 1.37mi |
Listing history 20 events
-
2026-06-18days on market $155,000 Active 44 DOM
-
2026-06-17days on market $155,000 Active 43 DOM
-
2026-06-16days on market $155,000 Active 42 DOM
-
2026-06-15days on market $155,000 Active 41 DOM
-
2026-06-13days on market $155,000 Active 39 DOM
-
2026-06-13days on market $155,000 Active 38 DOM
-
2026-06-09days on market $155,000 Active 35 DOM
-
2026-06-08days on market $155,000 Active 34 DOM
-
2026-06-07days on market $155,000 Active 33 DOM
-
2026-06-03days on market $155,000 Active 29 DOM
-
2026-06-02statusdays on market $155,000 Active 28 DOM
-
2026-06-01days on market $155,000 Contingent 27 DOM
-
2026-05-31days on market $155,000 Contingent 26 DOM
-
2026-05-08historical Contingent 583-char remark
-
2026-05-05$155,000 Active 583-char remark
-
2025-07-02price $170,000 544-char remark
Show marketing remark (544 chars)
Opportunity awaits with this 3-bedroom, 2-bath Cape Cod situated on a generous corner lot totaling nearly ¾ of an acre across three parcels. Located in Shaler Area School District, this property offers strong rental or resale potential. Features include a newer furnace, flexible layout, and ample outdoor space for expansion or additional structures. Whether you're looking to renovate, rent, or build, this prime location offers multiple exit strategies. Don’t miss your chance to capitalize on this rare multi-parcel investment!
-
2025-06-23$175,000 Active 544-char remark
Show marketing remark (544 chars)
Opportunity awaits with this 3-bedroom, 2-bath Cape Cod situated on a generous corner lot totaling nearly ¾ of an acre across three parcels. Located in Shaler Area School District, this property offers strong rental or resale potential. Features include a newer furnace, flexible layout, and ample outdoor space for expansion or additional structures. Whether you're looking to renovate, rent, or build, this prime location offers multiple exit strategies. Don’t miss your chance to capitalize on this rare multi-parcel investment!
-
1998-03-11soldstatus $68,000
-
1998-03-05soldstatus $68,000
Show marketing remark (118 chars)
TRIPLE LOT SURROUNDS THIS CHARMING OLDER FARMHOUSE; BATHS ON 1ST & 2ND; HOME WARRANTY EAT IN KITCHEN; SOME UPDATES
-
1997-04-16$74,900
Show marketing remark (118 chars)
TRIPLE LOT SURROUNDS THIS CHARMING OLDER FARMHOUSE; BATHS ON 1ST & 2ND; HOME WARRANTY EAT IN KITCHEN; SOME UPDATES
ⓘ Source: listings_history table (triggers on properties + properties_extension) + one-shot
backfill from property_details.listing_events for pre-trigger history.
Tax reassessment forecast PA · Partial reset (capped growth)
- Current annual tax
- $2,375 · $198/mo
- Projected year-2 tax
- $2,412 · $201/mo
- Expected delta
- +$37/yr (+$3/mo · 1.6%)
ⓘ Screening estimate from a state-policy table — verify with the county assessor before closing.
Climate risk First Street
- Flood 1/10 Low FEMA zone X (unshaded) · 0% chance over 30 yrs
- Wildfire 1/10 Low
- Heat 3/10 Moderate 7 d/yr ≥98°F today · 17 d/yr by 30 yrs out
- Wind 2/10 Low 0% chance of damaging wind over 30 yrs
- Air quality 4/10 Moderate 4 unhealthy d/yr today · 5 by 30 yrs out
Nearby sold comps map
Loading sold comps map…
Walkable amenities ~0.75 mi
Loading nearby amenities…
Taxation est. · year 1
- Rental income
- $17,786
- − Mortgage interest
- −$8,682
- − Property taxes
- −$2,375
- − Insurance
- −$775
- − Repairs & maintenance
- −$1,423
- − Management
- −$1,423
- − Depreciation
- −$4,509
- Taxable loss
- −$1,401
- Est. tax savings @ 24.0%
- +$336
- After-tax cash flow
- $1,483/yr
For passive investors: Depreciation is non-cash, so a rental often shows a tax loss while cash-flowing — sheltering income. Rental losses are passive: they offset passive income freely, and up to $25,000/yr can offset ordinary (W-2) income if you actively participate and your MAGI is under $100k (phasing out to $0 by $150k); unused losses carry forward. On sale, claimed depreciation is recaptured at up to 25%, and gains may owe capital-gains tax (a 1031 exchange can defer both). Figures are a year-1 estimate at your 24.0% rate — not tax advice; consult a CPA.
Schools (NCES district)
- District
- Shaler Area SD
- NCES district ID
- 4221200
- Math proficiency
- 36% ▼ -16.00%
- Reading proficiency
- 59% ▼ -15.00%
- Median HH income
- $57,411
- Composite
- 41.33/100
- National rank
- #3506
- State rank
- #208 of 539 in PA
Livability — Shaler
No livability data for this city. (Only ~50 U.S. cities are tracked.)
Census & demographics
- County
- Allegheny County · 1,022,028 people
- Metro
- Pittsburgh, PA
- Population (ZIP)
- 12,328
- Household income
- $85,542
- Rent vs Own
- Severe rent burden
- 356.0
Population outlook (Allegheny County) Hauer SSP2
- Today (2025)
- 1,250,282 people
- By 2030
- 1,256,482 · +0.5%
- By 2040
- 1,256,318 · +0.5%
- By 2050
- 1,244,169 · -0.5%
- By 2075
- 1,197,693 · -4.2%
- By 2100
- 1,093,187 · -12.6%
Race, ethnicity, and origin ACS 2023
- Neighborhood character
- Predominantly White (90%)
- Race & ethnicity
- White 90% Hispanic / Latino 3% Black 3% Two or more races 2% Asian 1%
- Common ancestry
- Romanian 13% Serbian 2% Italian 2%
- Foreign-born
- 3% · Canada
- Languages at home
- 96% English-only · Spanish 2% Other Indo-European 1% Arabic 1%
Political lean MEDSL · Allegheny
- 2024 margin
- Strong D (+20.3) · D 59.7% · R 39.4%
- 2008→2024 swing
- +4.8pp toward D · 2008: 15.5pp · 2024: 20.3pp
- All cycles
- 2024: D+20.3 2020: D+20.4 2016: D+16.4 2012: D+14.4 2008: D+15.5
Not yet ingested
- Civics
- —
Market trends
- HPI YoY
- ▼ -117.81%
- Current HPI
- 307.7796
- Rent YoY
- ▲ 5.31%
- Metro
- Pittsburgh, PA
- State GDP YoY
- ▲ 1.68%
- F500 in state
- 34
Industry mix (Fortune 500 HQ in PA)
| Industry | F500 HQs | Revenue |
|---|---|---|
| Healthcare | 2 | $309B |
|
||
| Insurance | 2 | $27B |
|
||
| Telecommunications / Media | 1 | $124B |
|
||
| Industrial Distribution | 1 | $22B |
|
||
| Financial Services | 1 | $20B |
|
||
| Chemicals / Materials | 1 | $18B |
|
||
Price history
+106.9% since first listed8 events — show timeline
- 2026-06-02 Relisted — West Penn MLS
- 2026-05-08 Contingent — West Penn MLS
- 2026-05-05 Listed $155,000 West Penn MLS
- 2025-07-02 Price Changed $170,000 West Penn MLS
- 2025-06-23 Listed $175,000 West Penn MLS
- 1998-03-11 Sold (Public Records) $68,000 Public Records
- 1998-03-05 Sold (MLS) $68,000 West Penn MLS
- 1997-04-16 Listed $74,900 West Penn MLS
Property tax history
+2.0%/yrLatest (2026): $2,375 · +0.0% YoY. Source: county tax records.
Cash-flow waterfall
monthlySold comps — $/sqft
last 12 mo · ≤1 miLoading sold comps…