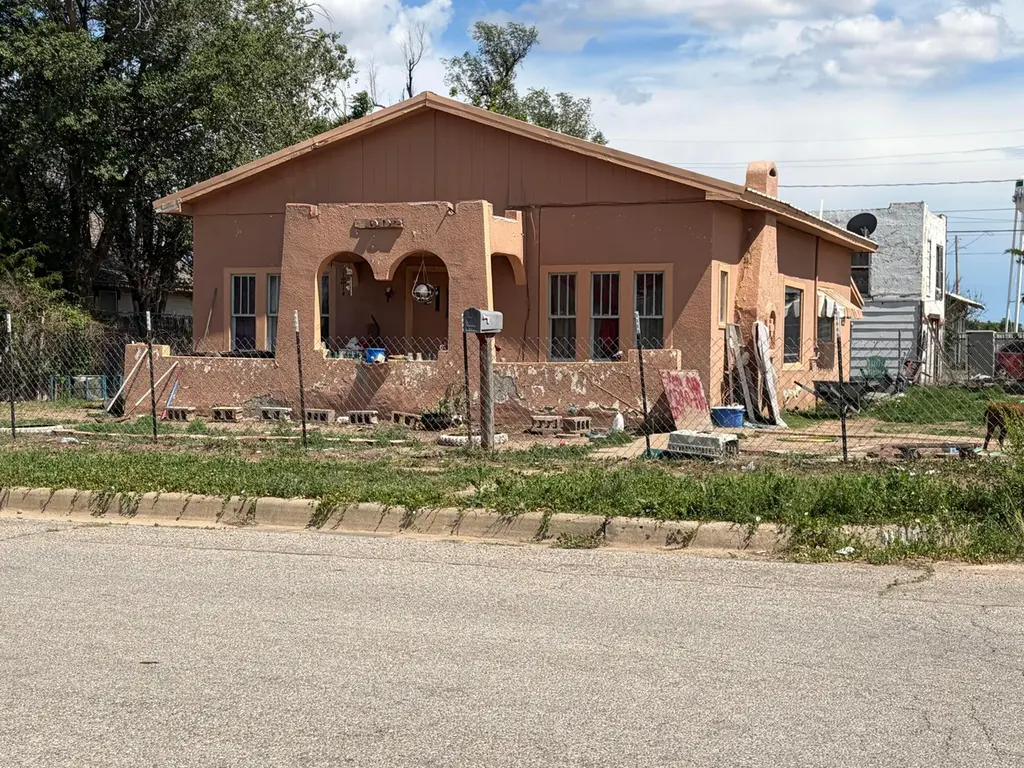
1002 E Francis Ave · Pampa, TX
Flood risk 1/10 · Minimal
- FEMA flood zone
- X (unshaded)
- Chance of flooding over 30 yrs
- 0.0%
- Est. flood insurance / yr
- $507 – $1,088
Fire risk 9/10 · Severe
- Est. fire insurance / yr
- $1,222 – $2,270
Heat risk 5/10 · Moderate
- Hot days now (above 99°F)
- 7 days/yr
- Hot days in 30 yrs
- 19 days/yr
Wind risk 2/10 · Minimal
- Chance of severe wind over 30 yrs
- —
Air-quality risk 2/10 · Minimal
- Unhealthy air days now
- 1 days/yr
- Unhealthy air days in 30 yrs
- 1 days/yr
Risk factors via First Street. Map © Google.
Why this score? — see what drove the D grade
The composite is a weighted blend of 9 inputs, each scored 0–100. Each bar is that input's sub-score; the figure is the points it added to the 100-point composite (weight × sub-score).
- Cash flow +15.0/30.0
- ARV discount +7.5/15.0
- 1% rule +5.0/10.0
- DSCR +5.0/10.0
- Livability +3.8/5.0
- Schools +3.1/10.0
- Rent growth +2.5/5.0
- Condition / age +2.5/5.0
- Appreciation +0.0/10.0
$30,000
🖨 Deal sheet 📄 Offer letter ✓ Due diligence
Listing remarks MLS
Cute in Channing Addition. This 3 Bedroom, 1 Bath, Open Living Area to Dining, Nice Kitchen with Spacious Cabinets and Counter Top for the Cook in the Family is all Situated on a Fenced in Corner Property. LOOK TODAY
Key facts
- Listed 9 days
Property features AI
Exterior
- Home design: Single-family residence; One level / single story
- Construction: Stucco exterior; Composition roof
- Exterior features: Corner lot; Chain link fencing
Interior
- Kitchen: Dishwasher; Range; Oven; Refrigerator
- Bathrooms: 1 full bathroom
- Heating & cooling: Ceiling fan(s)
- Interior features: Fireplace in the living room; Ceiling fan(s)
Neighborhood map
What this means for you Summary
Snapshot
- This is a 3-bed/1.0-bath single-family listed at $30k.
Deal economics
- At list price, monthly cash flow is $1k ($12k/yr) — positive.
- The deal already cash-flows at list — no discount required.
- Meets the 1% rule at list price ($2k rent vs $30k).
Location & tenants
- Location reads 75/100 on livability (#128 in TX, #3,885 nationally) — a middle-class / working-renter tenant base. Strengths: cost of living A+, housing A+, health & safety A+; Watch: schools D+, employment D+, crime F.
- Pampa ISD (town): math 38% / reading 36% proficiency, ranked #482 of 826 in TX (top 58%) — families likely to look elsewhere, expect single-tenant / working-renter base with shorter leases.
- Market conditions: 174 active listings in the ZIP; 2 comparable units currently listed for rent nearby; 7 units permitted in Gray County in 2024 (0 in 5+ unit buildings).
Forward outlook
- Local home prices are declining (-3.0%/yr); year-one equity from $207 of loan paydown is wiped out by about $900 of value loss. Plan a longer hold.
- Gray County population projected at +28% by 2050 — long-run rental-demand tailwind backs the buy-and-hold thesis.
- At projected returns (-3.0% appreciation + 3.0% rent growth), your $8k cash investment doubles in ~1 year — after that, you're playing with house money.
Negotiation context
- Only 10 days on market — expect competitive offers; lowballing is unlikely to land.
- 2 sale attempts since 13y ago with the ask held roughly flat each time — persistent listings suggest the price (not the market) is what's stuck; bring a comps-based counter.
Risks & watch-outs
- Watch-outs: property tax is 2.6% of price.
- Climate carrying-cost: severe wildfire risk; extreme-heat days projected 7→19/yr by 2055 (HVAC capex compounding) — expect insurance premiums to compound above CPI over the hold.
Questions for the listing agent
- Property tax is high relative to price — has the assessment been appealed recently, and will the sale trigger a re-assessment?
- Is there a deadline driving the sale (1031 exchange, divorce, estate, relocation)? That informs how much negotiation room exists.
- Schools are D-rated, which usually means shorter tenancies and higher turnover. Who's the typical renter profile here, and what's been the actual vacancy rate?
- Crime grade is F in this area — have there been break-ins, vandalism, or insurance claims at this property in the last 3 years? What carrier currently insures it and at what premium?
- The area grade is low — what's the realistic commute time and amenity access for the typical tenant pool here? Any planned neighborhood developments (good or bad) we should know about?
- What's the average days-on-market for RENTAL listings here right now (not sales)? A rising rental-DOM trend means longer vacancies and softer asking-rent achievability than the comps imply.
- What's the recent tenant-quality profile in this submarket — average credit score on applications, eviction rate, late-payment / NSF rate, and stable-employment percentage? A property-management company in the area should have these aggregated.
- How much new for-sale + rental construction is in the pipeline within 1–3 miles? Heavy new supply typically softens prices + rents 12–24 months out; constrained supply supports both.
Investment metrics
- 1% rule
- 5.27% ✓
- Cap rate
- 46.88%
- Cash-on-cash
- 144.96%
- DSCR
- 7.45
- GRM
- 1.6
CMA / ARV
No comps found within radius.
Projected returns pro-forma
-3.0% appreciation · 3.0% rent growth · sell at horizon
- IRR
- —
- Equity multiple
- 8.12×
- Total profit
- $59,809
- Equity at exit
- $4,473
- IRR
- —
- Equity multiple
- 17.13×
- Total profit
- $135,465
- Equity at exit
- $2,594
Cash invested: $8,400 (down + closing). Projections, not guarantees.
Landlord ↔ Tenant lean methodology
- Overall (STATE)
- 87 Strongly Landlord-Friendly
- State Texas
- 87 Strongly Landlord-Friendly · R+5
- County
- — inherits STATE
- City
- — inherits STATE
ZIP-level market 79065
- Active inventory
- 174
- Price-to-rent
- 1.6×
Monthly cashflow live
- Estimated rent
- $1,581 medium interval (Pro) →
- Mortgage (P&I)
- −$157
- Tax from tax record
- −$65 /mo · $774/yr
- Insurance
- −$12
- HOA
- −$0
- Vacancy / Maint / Mgmt
- −$332
- Net cashflow
- $1,015
Break-even live
UW: 25.0% down · 7.5% · 30yr · 1.5% tax · 5.0% vac · 8.0% maint · 8.0% mgmt
Financing live
Cash to close
- Down payment
- $7,500
- Closing costs
- $900
- Reserves months
- —
- Total cash needed
- —
Loan-product check · same deal, 3 products live
Conventional
25% down · 7.5% · 30yr
- Down + closing
- —
- Monthly P&I
- —
- Monthly cashflow
- —
- DSCR
- —
- Eligible?
- —
Personal DTI + credit; lowest rate.
DSCR
20% down · 8.5% · 30yr
- Down + closing
- —
- Monthly P&I
- —
- Monthly cashflow
- —
- DSCR
- —
- Eligible?
- —
No personal income docs; deal must DSCR.
Hard money
10% down · 12.0% · 12mo
- Down + closing
- —
- Monthly P&I
- —
- Monthly cashflow
- —
- DSCR
- —
- Eligible?
- —
Short-term bridge; refi at stabilization.
Rent comps 2 comps
| Address | Beds | Baths | Sqft | Rent | $/sqft | DOM | Units | Dist |
|---|---|---|---|---|---|---|---|---|
| 828 N Nelson St Pampa, TX | 4.0 | 2.5 | 1778 | $2,000 | $1.12 | 43d | 1 | 1.35mi |
| 1404 Coronado Dr Pampa, TX | 3.0 | 2.5 | 1500 | $1,200 | $0.80 | 43d | 1 | 1.46mi |
Listing history 9 events
-
2026-06-18days on market $30,000 Active 10 DOM
-
2026-06-17days on market $30,000 Active 9 DOM
-
2026-06-16days on market $30,000 Active 8 DOM
-
2026-06-15days on market $30,000 Active 7 DOM
-
2026-06-15days on market $30,000 Active 6 DOM
-
2026-06-13days on market $30,000 Active 5 DOM
-
2026-06-12days on market $30,000 Active 4 DOM
-
2026-06-09remarks 42-char remark
-
2026-06-09$30,000 Active 1 DOM
ⓘ Source: listings_history table (triggers on properties + properties_extension) + one-shot
backfill from property_details.listing_events for pre-trigger history.
Tax reassessment forecast TX · Resets to sale price
- Current annual tax
- $774 · $65/mo
- Projected year-2 tax
- $774 · $65/mo
- Expected delta
- $0/yr ($0/mo · 0.0%)
ⓘ Screening estimate from a state-policy table — verify with the county assessor before closing.
Climate risk First Street
- Flood 1/10 Low FEMA zone X (unshaded) · 0% chance over 30 yrs
- Wildfire 9/10 Extreme
- Heat 5/10 Major 7 d/yr ≥99°F today · 19 d/yr by 30 yrs out
- Wind 2/10 Low
- Air quality 2/10 Low 1 unhealthy d/yr today · 1 by 30 yrs out
Nearby sold comps map
Loading sold comps map…
Walkable amenities ~0.75 mi
Loading nearby amenities…
Taxation est. · year 1
- Rental income
- $18,973
- − Mortgage interest
- −$1,680
- − Property taxes
- −$774
- − Insurance
- −$150
- − Repairs & maintenance
- −$1,518
- − Management
- −$1,518
- − Depreciation
- −$873
- Taxable income
- $12,460
- Est. tax owed @ 24.0%
- −$2,990
- After-tax cash flow
- $9,186/yr
For passive investors: Depreciation is non-cash, so a rental often shows a tax loss while cash-flowing — sheltering income. Rental losses are passive: they offset passive income freely, and up to $25,000/yr can offset ordinary (W-2) income if you actively participate and your MAGI is under $100k (phasing out to $0 by $150k); unused losses carry forward. On sale, claimed depreciation is recaptured at up to 25%, and gains may owe capital-gains tax (a 1031 exchange can defer both). Figures are a year-1 estimate at your 24.0% rate — not tax advice; consult a CPA.
Schools (NCES district)
- District
- Pampa ISD
- NCES district ID
- 4834170
- Math proficiency
- 38% ▼ -10.00%
- Reading proficiency
- 36% ▬ 0.00%
- Median HH income
- $43,741
- Composite
- 31.43/100
- National rank
- #5986
- State rank
- #482 of 826 in TX
Livability — Pampa
- Score
- 75/100
- State rank
- #128
- US rank
- #3885
Category grades
Schools grade is shown separately in the Schools card above.
Census & demographics
- Census place
- Pampa, TX
- Population (ZIP)
- 19,569
Population outlook (Gray County) Hauer SSP2
- Today (2025)
- 24,965 people
- By 2030
- 26,105 · +4.6%
- By 2040
- 28,752 · +15.2%
- By 2050
- 31,859 · +27.6%
- By 2075
- 39,812 · +59.5%
- By 2100
- 43,284 · +73.4%
Race, ethnicity, and origin ACS 2023
- Neighborhood character
- Majority White (59%)
- Race & ethnicity
- White 59% Hispanic / Latino 32% Two or more races 6% Black 5% Native American 1%
- Hispanic origin (detail)
- Mexican 29%
- Common ancestry
- Slovak 3% Iranian 2% Lithuanian 2%
- Foreign-born
- 10% · Canada, South Korea
- Languages at home
- 79% English-only · Spanish 21%
Political lean MEDSL · Gray
- 2024 margin
- Solid R (+77.1) · D 11.2% · R 88.3%
- 2008→2024 swing
- -6.2pp toward R · 2008: -71.0pp · 2024: -77.1pp
- All cycles
- 2024: R+77.1 2020: R+77.2 2016: R+78.8 2012: R+75.2 2008: R+71.0
Not yet ingested
- Civics
- —
Market trends
- HPI YoY
- ▼ -88.67%
- Current HPI
- 128.8525
- Rent YoY
- —
- Metro
- —
- State GDP YoY
- ▲ 3.95%
- F500 in state
- 110
Industry mix (Fortune 500 HQ in TX)
| Industry | F500 HQs | Revenue |
|---|---|---|
| Energy | 16 | $1,198B |
|
||
| Technology | 5 | $198B |
|
||
| Engineering / Construction | 4 | $72B |
|
||
| Energy Services | 3 | $60B |
|
||
| Utilities | 3 | $41B |
|
||
| Healthcare | 2 | $330B |
|
||
Price history
-24.1% since first listed4 events — show timeline
- 2026-06-08 Listed $30,000 PBOR
- 2014-12-31 Sold (Public Records) — Public Records
- 2014-12-30 Sold (MLS) — PBOR
- 2013-09-30 Listed $39,500 PBOR
Property tax history
-1.0%/yrLatest (2025): $774 · +2.4% YoY. Source: county tax records.
Cash-flow waterfall
monthlySold comps — $/sqft
last 12 mo · ≤1 miLoading sold comps…