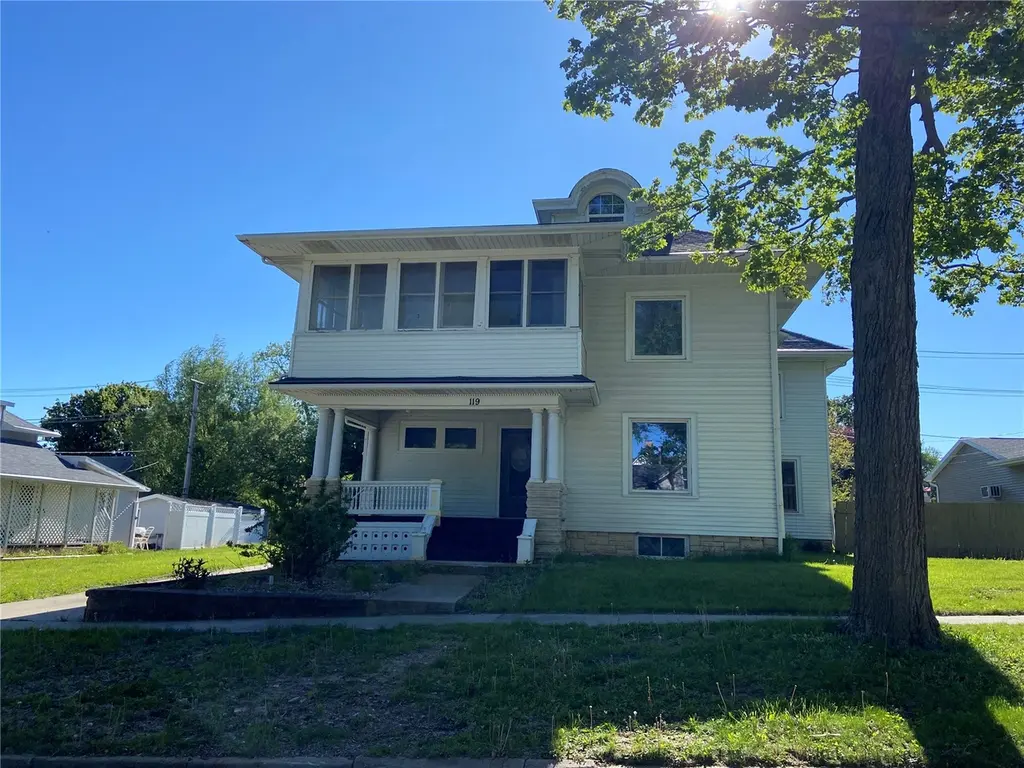
119 S Garnavillo St · Anamosa, IA
Flood risk 1/10 · Minimal
- FEMA flood zone
- X (unshaded)
- Chance of flooding over 30 yrs
- 0.0%
- Est. flood insurance / yr
- $473 – $860
Fire risk 4/10 · Minor
- Est. fire insurance / yr
- $902 – $1,676
Heat risk 3/10 · Minor
- Hot days now (above 102°F)
- 7 days/yr
- Hot days in 30 yrs
- 15 days/yr
Wind risk 2/10 · Minimal
- Chance of severe wind over 30 yrs
- —
Air-quality risk 2/10 · Minimal
- Unhealthy air days now
- 1 days/yr
- Unhealthy air days in 30 yrs
- 1 days/yr
Risk factors via First Street. Map © Google.
Why this score? — see what drove the C+ grade
The composite is a weighted blend of 9 inputs, each scored 0–100. Each bar is that input's sub-score; the figure is the points it added to the 100-point composite (weight × sub-score).
- Cash flow +24.8/30.0
- 1% rule +8.6/10.0
- DSCR +8.1/10.0
- ARV discount +7.5/15.0
- Schools +5.4/10.0
- Livability +3.7/5.0
- Rent growth +2.5/5.0
- Condition / age +2.5/5.0
- Appreciation +0.0/10.0
$110,500
🖨 Deal sheet 📄 Offer letter ✓ Due diligence
Listing remarks
Built in 1902, this 2-story home features original woodwork and floors, solid wood doors, stained glass accents, a curved staircase, high 9+' ceilings, and parlor with original fireplace. Additional features include updated kitchen, formal dining, two living areas, eat-in kitchen, enclosed upstairs porch, fenced backyard, and period architectural details that reflect the home's historic character. FHA Case #161-416117. Insured status is: Insured with Escrow Repairs. Property being sold “AS IS”. HUD property sold by electronic bid only. For a property condition report, forms, disclosures & availability visit www. hudhomestore. gov. If property built prior to 1978, lead base
Key facts
- Formal dining
- Curved staircase
- Original woodwork
Tags
Property features AI
Exterior
- Parking: Detached 2-car garage
- Utilities: Public water; Public sewer
- Home design: Single family residence; Two levels / 2 stories
- Construction: Frame construction with metal siding
- Exterior features: Patio
Interior
- Kitchen: Dishwasher; Range; Microwave; Refrigerator; Eat-in kitchen
- Bedrooms: Bedrooms included in the 9 total rooms
- Bathrooms: 2 full bathrooms; 1 half bathroom
- Heating & cooling: Hot water heating; Fireplace insert
- Interior features: Eat-in kitchen; Full basement; Fireplace (insert) serving family room and master bedroom
- Laundry & utility: Washer; Dryer
Neighborhood map
What this means for you Summary
Snapshot
- This is a 4-bed/3.5-bath single-family listed at $110k.
Deal economics
- At list price, monthly cash flow is $235 ($3k/yr) — positive.
- The deal already cash-flows at list — no discount required.
- Meets the 1% rule at list price ($1k rent vs $110k).
- Recommended offer: $107k (3.0% below list) — sets the bar for market timing.
- Cap rate 8.8% vs local median 3.3% in Anamosa — top-decile yield for the area; either an underpriced asset or a hidden risk that comps aren't pricing in. Stress-test before assuming the spread holds.
Location & tenants
- Location reads 74/100 on livability (#240 in IA, #4,682 nationally) — a middle-class / working-renter tenant base. Strengths: crime A+, cost of living A+, housing A+; Watch: amenities F, commute F, employment F.
- Anamosa Community School District (town): math 62% / reading 65% proficiency, ranked #210 of 289 in IA (top 73%) — acceptable for families but not a draw, mixed tenant base, ~2y average lease.
- Zoned schools: Strawberry Hill (math 62% / reading 57%, grade B-, #390 of 616 statewide, top 69%, 442 students, 46% FRL); Anamosa Middle School (math 64% / reading 63%, grade B+, #169 of 246 statewide, top 69%, 344 students, 40% FRL); Anamosa High School (math 58% / reading 72%, grade B, #208 of 336 statewide, top 62%, 397 students, 39% FRL).
- Market conditions: 47 active listings in the ZIP; 25 units permitted in Jones County in 2024 (0 in 5+ unit buildings).
Forward outlook
- Local home prices are declining (-3.0%/yr); year-one equity from $764 of loan paydown is wiped out by about $3k of value loss. Plan a longer hold.
- Jones County population projected to shrink 8% by 2050 — rents likely to lag national; underwrite the cash flow, not the appreciation.
Negotiation context
- It's been on market 36 days — a 3% lower offer ($107k) is reasonable based on typical stale-listing flexibility.
- 4 sale attempts since 11y ago; this cycle's ask has dropped $20k (15%) from the opening price — seller is motivated, your offer sets the floor, not the list.
Risks & watch-outs
- Watch-outs: property tax is 3.5% of price; built in 1902 — expect roof / HVAC / electrical / plumbing capex.
Questions for the listing agent
- It's been on market 36 days. Have you received any prior offers? Is the seller open to a 3% concession, seller financing, or rate buy-down credit?
- Built in 1902 — when were the roof, HVAC, electrical panel, plumbing, and water heater last replaced?
- Property tax is high relative to price — has the assessment been appealed recently, and will the sale trigger a re-assessment?
- Is there a deadline driving the sale (1031 exchange, divorce, estate, relocation)? That informs how much negotiation room exists.
- Schools are B-rated — typically a magnet for longer-tenancy family renters. What's the average tenant stay here, and is there a school-zone premium baked into asking?
- What's the average days-on-market for RENTAL listings here right now (not sales)? A rising rental-DOM trend means longer vacancies and softer asking-rent achievability than the comps imply.
- What's the recent tenant-quality profile in this submarket — average credit score on applications, eviction rate, late-payment / NSF rate, and stable-employment percentage? A property-management company in the area should have these aggregated.
- How much new for-sale + rental construction is in the pipeline within 1–3 miles? Heavy new supply typically softens prices + rents 12–24 months out; constrained supply supports both.
Investment metrics
- 1% rule
- 1.36% ✓
- Cap rate
- 8.84%
- Cash-on-cash
- 9.11%
- DSCR
- 1.41
- GRM
- 6.1
CMA / ARV
- ARV (median comp)
- $262,439
- List price
- $110,500
- Delta
- -57.89%
- Verdict
- UNDERPRICED
- Comps
- 11 within 1.0 mi
Show comp detail 3 sales within ~0.75 mi
| Address | Dist | Beds/Ba | Sqft | Sold | Price | $/sf | Match |
|---|---|---|---|---|---|---|---|
| 102 S Booth | 0.11mi | 4/3.5 | 2,895 (-12%) | 4mo | $239,000 | $83 | 73 |
| 204 N Huber St | 0.29mi | 3/2.0 (-1) | 2,942 (-10%) | 7mo | $260,000 | $88 | 53 |
| 303 Cherry St | 0.45mi | 3/2.5 (-1) | 2,928 (-10%) | 21mo | $225,000 | $77 | 35 |
Match score weights: distance 35% · size 25% · config 20% · recency 20%. Top-matched comps best support the ARV.
Projected returns pro-forma
-3.0% appreciation · 3.0% rent growth · sell at horizon
- IRR
- -2.4%
- Equity multiple
- 0.91×
- Total profit
- $-2,814
- Equity at exit
- $16,476
- IRR
- 7.4%
- Equity multiple
- 1.56×
- Total profit
- $17,361
- Equity at exit
- $9,554
Cash invested: $30,940 (down + closing). Projections, not guarantees.
Landlord ↔ Tenant lean methodology
- Overall (STATE)
- 83 Strongly Landlord-Friendly
- State Iowa
- 83 Strongly Landlord-Friendly · R+6
- County
- — inherits STATE
- City
- — inherits STATE
ZIP-level market 52205
- Home prices YoY
- -24.1%
- Active inventory
- 47
- Price-to-rent
- 6.1×
Monthly cashflow live
- Estimated rent
- $1,498 medium interval (Pro) →
- Mortgage (P&I)
- −$579
- Tax from tax record
- −$323 /mo · $3,878/yr
- Insurance
- −$46
- HOA
- −$0
- Vacancy / Maint / Mgmt
- −$315
- Net cashflow
- $235
Break-even live
UW: 25.0% down · 7.5% · 30yr · 1.5% tax · 5.0% vac · 8.0% maint · 8.0% mgmt
Financing live
Cash to close
- Down payment
- $27,625
- Closing costs
- $3,315
- Reserves months
- —
- Total cash needed
- —
Loan-product check · same deal, 3 products live
Conventional
25% down · 7.5% · 30yr
- Down + closing
- —
- Monthly P&I
- —
- Monthly cashflow
- —
- DSCR
- —
- Eligible?
- —
Personal DTI + credit; lowest rate.
DSCR
20% down · 8.5% · 30yr
- Down + closing
- —
- Monthly P&I
- —
- Monthly cashflow
- —
- DSCR
- —
- Eligible?
- —
No personal income docs; deal must DSCR.
Hard money
10% down · 12.0% · 12mo
- Down + closing
- —
- Monthly P&I
- —
- Monthly cashflow
- —
- DSCR
- —
- Eligible?
- —
Short-term bridge; refi at stabilization.
Listing history 24 events
-
2026-06-18days on market $110,500 Active 36 DOM
-
2026-06-17days on market $110,500 Active 35 DOM
-
2026-06-16days on market $110,500 Active 34 DOM
-
2026-06-15days on market $110,500 Active 33 DOM
-
2026-06-14price $110,500 Active 31 DOM
-
2026-06-13days on market $130,000 Active 31 DOM
-
2026-06-12days on market $130,000 Active 30 DOM
-
2026-06-09days on market $130,000 Active 27 DOM
-
2026-06-08days on market $130,000 Active 26 DOM
-
2026-06-07days on market $130,000 Active 25 DOM
-
2026-06-07days on market $130,000 Active 24 DOM
-
2026-06-04days on market $130,000 Active 21 DOM
-
2026-06-02days on market $130,000 Active 20 DOM
-
2026-06-01days on market $130,000 Active 19 DOM
-
2026-05-31days on market $130,000 Active 18 DOM
-
2026-05-31days on market $130,000 Active 17 DOM
-
2026-05-13$130,000 Active 753-char remark
-
2022-03-31soldstatus $175,000
-
2022-03-30soldstatus $175,000
-
2022-03-30$175,000
-
2016-05-19soldstatus $150,000
-
2016-05-17soldstatus $150,000
-
2015-11-14$150,000
-
2015-05-08$159,900
ⓘ Source: listings_history table (triggers on properties + properties_extension) + one-shot
backfill from property_details.listing_events for pre-trigger history.
Tax reassessment forecast IA · Partial reset (capped growth)
- Current annual tax
- $3,878 · $323/mo
- Projected year-2 tax
- $3,878 · $323/mo
- Expected delta
- $0/yr ($0/mo · 0.0%)
ⓘ Screening estimate from a state-policy table — verify with the county assessor before closing.
Climate risk First Street
- Flood 1/10 Low FEMA zone X (unshaded) · 0% chance over 30 yrs
- Wildfire 4/10 Moderate
- Heat 3/10 Moderate 7 d/yr ≥102°F today · 15 d/yr by 30 yrs out
- Wind 2/10 Low
- Air quality 2/10 Low 1 unhealthy d/yr today · 1 by 30 yrs out
Nearby sold comps map
Loading sold comps map…
Walkable amenities ~0.75 mi
Loading nearby amenities…
Taxation est. · year 1
- Rental income
- $17,977
- − Mortgage interest
- −$6,190
- − Property taxes
- −$3,878
- − Insurance
- −$552
- − Repairs & maintenance
- −$1,438
- − Management
- −$1,438
- − Depreciation
- −$3,215
- Taxable income
- $1,266
- Est. tax owed @ 24.0%
- −$304
- After-tax cash flow
- $2,514/yr
For passive investors: Depreciation is non-cash, so a rental often shows a tax loss while cash-flowing — sheltering income. Rental losses are passive: they offset passive income freely, and up to $25,000/yr can offset ordinary (W-2) income if you actively participate and your MAGI is under $100k (phasing out to $0 by $150k); unused losses carry forward. On sale, claimed depreciation is recaptured at up to 25%, and gains may owe capital-gains tax (a 1031 exchange can defer both). Figures are a year-1 estimate at your 24.0% rate — not tax advice; consult a CPA.
Schools (NCES district)
- District
- Anamosa Community School District
- NCES district ID
- 1903570
- Math proficiency
- 62% ▼ -5.00%
- Reading proficiency
- 65% ▲ 3.00%
- Median HH income
- $51,672
- Composite
- 54.14/100
- National rank
- #1383
- State rank
- #210 of 289 in IA
Livability — Anamosa
- Score
- 74/100
- State rank
- #240
- US rank
- #4682
Category grades
Schools grade is shown separately in the Schools card above.
Census & demographics
- Census place
- Anamosa, IA
- Population (ZIP)
- 8,670
Population outlook (Jones County) Hauer SSP2
- Today (2025)
- 20,023 people
- By 2030
- 19,702 · -1.6%
- By 2040
- 19,007 · -5.1%
- By 2050
- 18,396 · -8.1%
- By 2075
- 17,955 · -10.3%
- By 2100
- 17,448 · -12.9%
Race, ethnicity, and origin ACS 2023
- Neighborhood character
- Predominantly White (91%)
- Race & ethnicity
- White 91% Black 4% Two or more races 2% Hispanic / Latino 2%
- Common ancestry
- Slovak 6% Portuguese 4% Lithuanian 3%
- Foreign-born
- 2% · China
- Languages at home
- 98% English-only · Spanish 1%
Political lean MEDSL · Jones
- 2024 margin
- Strong R (+26.3) · D 36.0% · R 62.3% · Other 1.7%
- 2008→2024 swing
- -36.7pp toward R · 2008: 10.4pp · 2024: -26.3pp
- All cycles
- 2024: R+26.3 2020: R+21.5 2016: R+19.4 2012: D+7.7 2008: D+10.4
Not yet ingested
- Civics
- —
Market trends
- HPI YoY
- ▼ -54.46%
- Current HPI
- 171.5338
- Rent YoY
- —
- Metro
- —
- State GDP YoY
- ▲ 2.48%
- F500 in state
- 4
Industry mix (Fortune 500 HQ in IA)
| Industry | F500 HQs | Revenue |
|---|---|---|
| Financial Services | 1 | $16B |
|
||
| Retail / Convenience | 1 | $15B |
|
||
Price history
-30.9% since first listed9 events — show timeline
- 2026-06-13 Price Changed $110,500 CRAAR, CDRMLS
- 2026-05-13 Listed $130,000 CRAAR, CDRMLS
- 2022-03-31 Sold (Public Records) $175,000 Public Records
- 2022-03-30 Listed $175,000 CRAAR, CDRMLS
- 2022-03-30 Sold (MLS) $175,000 CRAAR, CDRMLS
- 2016-05-19 Sold (Public Records) $150,000 Public Records
- 2016-05-17 Sold (MLS) $150,000 CRAAR, CDRMLS
- 2015-11-14 Listed $150,000 CRAAR, CDRMLS
- 2015-05-08 Listed $159,900 CRAAR, CDRMLS
Property tax history
+2.2%/yrLatest (2025): $3,878 · +1.1% YoY. Source: county tax records.
Cash-flow waterfall
monthlySold comps — $/sqft
last 12 mo · ≤1 miLoading sold comps…