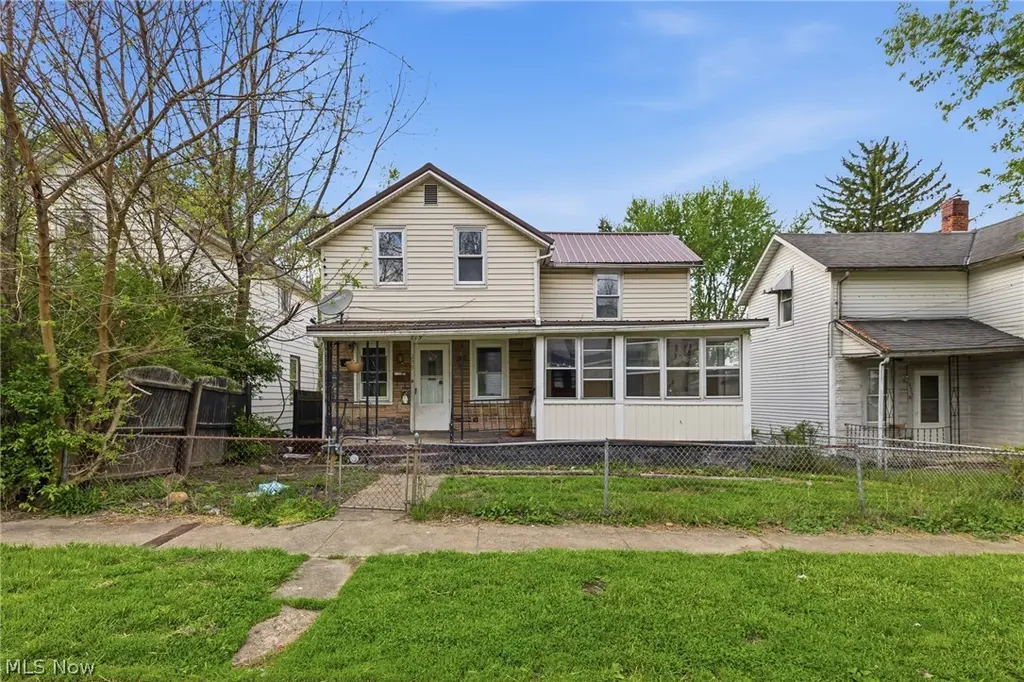
229 E 1st St · Mansfield, OH
Flood risk 4/10 · Minor
- FEMA flood zone
- X (unshaded)
- Chance of flooding over 30 yrs
- 0.22%
- Est. flood insurance / yr
- $473 – $860
Fire risk 1/10 · Minimal
- Est. fire insurance / yr
- $713 – $1,323
Heat risk 3/10 · Minor
- Hot days now (above 96°F)
- 7 days/yr
- Hot days in 30 yrs
- 18 days/yr
Wind risk 2/10 · Minimal
- Chance of severe wind over 30 yrs
- —
Air-quality risk 2/10 · Minimal
- Unhealthy air days now
- 1 days/yr
- Unhealthy air days in 30 yrs
- 1 days/yr
Risk factors via First Street. Map © Google.
Why this score? — see what drove the B- grade
The composite is a weighted blend of 9 inputs, each scored 0–100. Each bar is that input's sub-score; the figure is the points it added to the 100-point composite (weight × sub-score).
- Cash flow +30.0/30.0
- DSCR +10.0/10.0
- Appreciation +9.2/10.0
- 1% rule +8.9/10.0
- Livability +3.8/5.0
- Rent growth +2.5/5.0
- Condition / age +2.5/5.0
- Schools +2.3/10.0
- ARV discount +0.0/15.0
$74,900
🖨 Deal sheet 📄 Offer letter ✓ Due diligence
Listing remarks MLS
Opportunity is knocking! Are you ready to answer? This property offers the perfect blend of functionality and upside potential for buyers looking to build equity fast. Step inside and you'll find a true blank canvas ideal for adding your personal style and value through simple updates. Features include a hard-to-find first-floor master suite with convenient laundry location & a second full bath upstairs adding flexibility for guests or additional occupants, making this layout both practical and appealing. Outside, enjoy ample private off-street parking, a rare find that adds immediate convenience and desirability for both homeowners and tenants alike. Major updates include a roof approximately 2 years old, helping reduce big-ticket concerns so you can focus on improvements that build equity. With the right vision and a little sweat equity, the upside here is undeniable. Priced to move! Schedule your showing today and position yourself for a fast close & immediate possession.
Key facts
- 7,078 sq ft lot
- Parking
- Built 1900
Tags
Property features AI
Exterior
- Parking: Driveway with gravel surface
- Utilities: Public water; Public sewer
- Home design: Two-story home; Property is attached
- Construction: Built per public records; Stone and vinyl siding exterior; Metal roof
- Exterior features: Chain-link fencing; Lot of about 0.16 acres
Interior
- Kitchen: Kitchen on the first floor
- Bedrooms: One main-level bedroom; Additional bedrooms on the second floor (two bedrooms)
- Bathrooms: Two full bathrooms total; One full bathroom on the main level
- Heating & cooling: Forced-air heating; Gas heating
- Interior features: Partial basement; Total of 6 rooms
Neighborhood map
What this means for you Summary
Snapshot
- This is a 3-bed/1.0-bath single-family listed at $75k.
Deal economics
- At list price, monthly cash flow is $350 ($4k/yr) — positive.
- The deal already cash-flows at list — no discount required.
- Meets the 1% rule at list price ($1k rent vs $75k).
- Recommended offer: $73k (3.0% below list) — sets the bar for market timing.
- Cap rate 11.9% vs local median 4.2% in Mansfield — top-decile yield for the area; either an underpriced asset or a hidden risk that comps aren't pricing in. Stress-test before assuming the spread holds.
Location & tenants
- Location reads 76/100 on livability (#224 in OH, #3,525 nationally) — a middle-class / working-renter tenant base. Strengths: commute A+, cost of living A+, housing A+; Watch: schools C-, crime D-, amenities D-.
- Mansfield City (urban): math 24% / reading 33% proficiency, ranked #590 of 656 in OH (top 90%) — low school quality limits family demand, transient renter base, plan for 1-2y turnover; 80% free/reduced lunch — lower-income household profile, screen leases tightly.
- Market conditions: 30 active listings in the ZIP; 6 comparable units currently listed for rent nearby; rentals lingering (median 44d on market — plan ~5-8 weeks vacancy on turnover, expect pricing pressure); 100% of comp listings sitting > 30 days — soft ceiling on asking rent; lower-income renter base — watch delinquency; 145 units permitted in Richland County in 2024 (0 in 5+ unit buildings).
- This rent runs 40% of the median local income ($32k/yr) — at the standard rent-burdened threshold; future hikes will face affordability resistance.
Forward outlook
- In year one you build about $7k of equity ($518 loan paydown + $6k appreciation (8.4% local appreciation)).
- Richland County population projected at -18% by 2050 — secular population decline; favor cash flow + early exit over multi-decade hold.
- At projected returns (8.4% appreciation + 3.0% rent growth), your $21k cash investment doubles in ~2 years — after that, you're playing with house money.
- By year 5, paydown + projected appreciation supports a ~$31k cash-out refi (75% LTV) — recoverable capital for the next deal without selling this one.
Negotiation context
- It's been on market 51 days — a 3% lower offer ($73k) is reasonable based on typical stale-listing flexibility.
- 3 sale attempts; this cycle's ask has dropped $5k (6%) from the opening price — seller is motivated, your offer sets the floor, not the list.
- Current owner paid $33k; list at $75k implies a 127% gain — meaningful room to come down on a strong offer.
Risks & watch-outs
- Watch-outs: built in 1900 — expect roof / HVAC / electrical / plumbing capex.
Questions for the listing agent
- It's been on market 51 days. Have you received any prior offers? Is the seller open to a 3% concession, seller financing, or rate buy-down credit?
- Built in 1900 — when were the roof, HVAC, electrical panel, plumbing, and water heater last replaced?
- Is there a deadline driving the sale (1031 exchange, divorce, estate, relocation)? That informs how much negotiation room exists.
- Crime grade is D in this area — have there been break-ins, vandalism, or insurance claims at this property in the last 3 years? What carrier currently insures it and at what premium?
- What's the average days-on-market for RENTAL listings here right now (not sales)? A rising rental-DOM trend means longer vacancies and softer asking-rent achievability than the comps imply.
- What's the recent tenant-quality profile in this submarket — average credit score on applications, eviction rate, late-payment / NSF rate, and stable-employment percentage? A property-management company in the area should have these aggregated.
- How much new for-sale + rental construction is in the pipeline within 1–3 miles? Heavy new supply typically softens prices + rents 12–24 months out; constrained supply supports both.
Investment metrics
- 1% rule
- 1.39% ✓
- Cap rate
- 11.90%
- Cash-on-cash
- 20.01%
- DSCR
- 1.89
- GRM
- 6.0
CMA / ARV
- ARV (median comp)
- $58,895
- List price
- $74,900
- Delta
- 27.18%
- Verdict
- OVERPRICED
- Comps
- 20 within 1.0 mi
Show comp detail 12 sales within ~0.75 mi
| Address | Dist | Beds/Ba | Sqft | Sold | Price | $/sf | Match |
|---|---|---|---|---|---|---|---|
| 271 E 1st St | 0.08mi | 3/2.0 | 1,298 (-4%) | 7mo | $96,000 | $74 | 80 |
| 268 Superior St | 0.12mi | 3/1.0 | 1,498 (+11%) | 1mo | $38,000 | $25 | 75 |
| 183 E First St | 0.08mi | 3/1.0 | 1,176 (-13%) | 3mo | $89,900 | $76 | 73 |
| 209 Second | 0.09mi | 2/1.0 (-1) | 1,212 (-10%) | 5mo | $60,000 | $50 | 70 |
| 223 E 2nd St | 0.08mi | 4/1.5 (+1) | 1,483 (+10%) | 9mo | $134,000 | $90 | 65 |
| 195 Hedges St | 0.24mi | 4/1.5 (+1) | 1,483 (+10%) | 1mo | $141,500 | $95 | 64 |
| 175 S Mulberry St | 0.57mi | 3/1.5 | 1,405 (+4%) | 3mo | $100,000 | $71 | 62 |
| 22 Small Ave | 0.50mi | 4/2.0 (+1) | 1,394 (+4%) | 3mo | $137,600 | $99 | 60 |
| 130 E Arch St | 0.24mi | 4/1.0 (+1) | 1,176 (-13%) | 6mo | $72,500 | $62 | 58 |
| 153 Hedges St | 0.17mi | 4/1.5 (+1) | 1,483 (+10%) | 12mo | $134,990 | $91 | 58 |
| 319 Altamont Ave | 0.52mi | 2/1.0 (-1) | 1,225 (-9%) | 7mo | $65,000 | $53 | 50 |
| 11 Hoffer Ave | 0.70mi | 3/1.5 | 1,528 (+13%) | 9mo | $92,700 | $61 | 36 |
Match score weights: distance 35% · size 25% · config 20% · recency 20%. Top-matched comps best support the ARV.
Projected returns pro-forma
8.45% appreciation · 3.0% rent growth · sell at horizon
- IRR
- 36.5%
- Equity multiple
- 3.64×
- Total profit
- $55,298
- Equity at exit
- $59,221
- IRR
- 32.3%
- Equity multiple
- 7.87×
- Total profit
- $144,015
- Equity at exit
- $119,834
Cash invested: $20,972 (down + closing). Projections, not guarantees.
Landlord ↔ Tenant lean methodology
- Overall (STATE)
- 73 Landlord-Friendly
- State Ohio
- 73 Landlord-Friendly · R+6
- County
- — inherits STATE
- City
- — inherits STATE
ZIP-level market 44902
- Home prices YoY
- 2.9%
- Active inventory
- 30
- Price-to-rent
- 6.0×
Monthly cashflow live
- Estimated rent
- $1,043 high interval (Pro) →
- Mortgage (P&I)
- −$393
- Tax from tax record
- −$50 /mo · $598/yr
- Insurance
- −$31
- HOA
- −$0
- Vacancy / Maint / Mgmt
- −$219
- Net cashflow
- $350
Break-even live
UW: 25.0% down · 7.5% · 30yr · 1.5% tax · 5.0% vac · 8.0% maint · 8.0% mgmt
Financing live
Cash to close
- Down payment
- $18,725
- Closing costs
- $2,247
- Reserves months
- —
- Total cash needed
- —
Loan-product check · same deal, 3 products live
Conventional
25% down · 7.5% · 30yr
- Down + closing
- —
- Monthly P&I
- —
- Monthly cashflow
- —
- DSCR
- —
- Eligible?
- —
Personal DTI + credit; lowest rate.
DSCR
20% down · 8.5% · 30yr
- Down + closing
- —
- Monthly P&I
- —
- Monthly cashflow
- —
- DSCR
- —
- Eligible?
- —
No personal income docs; deal must DSCR.
Hard money
10% down · 12.0% · 12mo
- Down + closing
- —
- Monthly P&I
- —
- Monthly cashflow
- —
- DSCR
- —
- Eligible?
- —
Short-term bridge; refi at stabilization.
Rent comps 6 comps
| Address | Beds | Baths | Sqft | Rent | $/sqft | DOM | Units | Dist |
|---|---|---|---|---|---|---|---|---|
| 147 Ford St Mansfield, OH | 3.0 | 1.5 | 1286 | $995 | $0.77 | 43d | 1 | 0.54mi |
| 243 W 1st St Mansfield, OH | 4.0 | 1.0 | 1470 | $1,195 | $0.81 | 43d | 1 | 0.88mi |
| 19 State St Mansfield, OH | 3.0 | 1.0 | 1040 | $995 | $0.96 | 43d | 1 | 0.92mi |
| 275 Cliffbrook Dr Mansfield, OH | 2.0 | 1.5 | 1200 | $925 | $0.77 | 43d | 1 | 1.24mi |
| 282 Cliffbrook Dr Mansfield, OH | 3.0 | 1.0 | 912 | $1,395 | $1.53 | 43d | 1 | 1.27mi |
| 520 Lida St Mansfield, OH | 3.0 | 1.0 | 1300 | $850 | $0.65 | 43d | 1 | 1.34mi |
Listing history 20 events
-
2026-06-19days on market $74,900 Active 51 DOM
-
2026-06-18days on market $74,900 Active 50 DOM
-
2026-06-17days on market $74,900 Active 49 DOM
-
2026-06-16days on market $74,900 Active 48 DOM
-
2026-06-15days on market $74,900 Active 47 DOM
-
2026-06-14days on market $74,900 Active 45 DOM
-
2026-06-12days on market $74,900 Active 44 DOM
-
2026-06-09days on market $74,900 Active 41 DOM
-
2026-06-08days on market $74,900 Active 40 DOM
-
2026-06-07days on market $74,900 Active 39 DOM
-
2026-06-05days on market $74,900 Active 36 DOM
-
2026-06-03days on market $74,900 Active 35 DOM
-
2026-06-02days on market $74,900 Active 34 DOM
-
2026-06-01days on market $74,900 Active 33 DOM
-
2026-05-31days on market $74,900 Active 32 DOM
-
2026-05-30days on market $74,900 Active 31 DOM
-
2026-04-30$79,900 Active 1149-char remark
Show marketing remark (1001 chars)
Opportunity is knocking! Are you ready to answer? This property offers the perfect blend of functionality and upside potential for buyers looking to build equity fast. Step inside and you'll find a true blank canvas ideal for adding your personal style and value through simple updates. Features include a hard-to-find first-floor master suite with convenient laundry location & a second full bath upstairs adding flexibility for guests or additional occupants, making this layout both practical and appealing. Outside, enjoy ample private off-street parking, a rare find that adds immediate convenience and desirability for both homeowners and tenants alike. Major updates include a roof approximately 2 years old, helping reduce big-ticket concerns so you can focus on improvements that build equity. With the right vision and a little sweat equity, the upside here is undeniable. Priced to move! Schedule your showing today and position yourself for a fast close & immediate possession.
-
2026-04-30$79,900 Active 1001-char remark
Show marketing remark (1001 chars)
Opportunity is knocking! Are you ready to answer? This property offers the perfect blend of functionality and upside potential for buyers looking to build equity fast. Step inside and you'll find a true blank canvas ideal for adding your personal style and value through simple updates. Features include a hard-to-find first-floor master suite with convenient laundry location & a second full bath upstairs adding flexibility for guests or additional occupants, making this layout both practical and appealing. Outside, enjoy ample private off-street parking, a rare find that adds immediate convenience and desirability for both homeowners and tenants alike. Major updates include a roof approximately 2 years old, helping reduce big-ticket concerns so you can focus on improvements that build equity. With the right vision and a little sweat equity, the upside here is undeniable. Priced to move! Schedule your showing today and position yourself for a fast close & immediate possession.
-
2026-04-30$79,900 Active
Show marketing remark (1001 chars)
Opportunity is knocking! Are you ready to answer? This property offers the perfect blend of functionality and upside potential for buyers looking to build equity fast. Step inside and you'll find a true blank canvas ideal for adding your personal style and value through simple updates. Features include a hard-to-find first-floor master suite with convenient laundry location & a second full bath upstairs adding flexibility for guests or additional occupants, making this layout both practical and appealing. Outside, enjoy ample private off-street parking, a rare find that adds immediate convenience and desirability for both homeowners and tenants alike. Major updates include a roof approximately 2 years old, helping reduce big-ticket concerns so you can focus on improvements that build equity. With the right vision and a little sweat equity, the upside here is undeniable. Priced to move! Schedule your showing today and position yourself for a fast close & immediate possession.
-
1997-12-15soldstatus $33,000
ⓘ Source: listings_history table (triggers on properties + properties_extension) + one-shot
backfill from property_details.listing_events for pre-trigger history.
Tax reassessment forecast OH · Partial reset (capped growth)
- Current annual tax
- $598 · $50/mo
- Projected year-2 tax
- $883 · $74/mo
- Expected delta
- +$285/yr (+$24/mo · 47.7%)
ⓘ Screening estimate from a state-policy table — verify with the county assessor before closing.
Climate risk First Street
- Flood 4/10 Moderate FEMA zone X (unshaded) · 22% chance over 30 yrs
- Wildfire 1/10 Low
- Heat 3/10 Moderate 7 d/yr ≥96°F today · 18 d/yr by 30 yrs out
- Wind 2/10 Low
- Air quality 2/10 Low 1 unhealthy d/yr today · 1 by 30 yrs out
Nearby sold comps map
Loading sold comps map…
Walkable amenities ~0.75 mi
Loading nearby amenities…
Taxation est. · year 1
- Rental income
- $12,510
- − Mortgage interest
- −$4,196
- − Property taxes
- −$598
- − Insurance
- −$374
- − Repairs & maintenance
- −$1,001
- − Management
- −$1,001
- − Depreciation
- −$2,179
- Taxable income
- $3,162
- Est. tax owed @ 24.0%
- −$759
- After-tax cash flow
- $3,438/yr
For passive investors: Depreciation is non-cash, so a rental often shows a tax loss while cash-flowing — sheltering income. Rental losses are passive: they offset passive income freely, and up to $25,000/yr can offset ordinary (W-2) income if you actively participate and your MAGI is under $100k (phasing out to $0 by $150k); unused losses carry forward. On sale, claimed depreciation is recaptured at up to 25%, and gains may owe capital-gains tax (a 1031 exchange can defer both). Figures are a year-1 estimate at your 24.0% rate — not tax advice; consult a CPA.
Schools (NCES district)
- District
- Mansfield City
- NCES district ID
- 3904429
- Math proficiency
- 24% ▼ -19.00%
- Reading proficiency
- 33% ▼ -12.00%
- Median HH income
- $32,435
- Composite
- 23.25/100
- National rank
- #7934
- State rank
- #590 of 656 in OH
Livability — Mansfield
- Score
- 76/100
- State rank
- #224
- US rank
- #3525
Category grades
Schools grade is shown separately in the Schools card above.
Census & demographics
- Census place
- Mansfield, OH
- County
- Richland · 128,966 people
- City population
- 16,349
- Metro
- Mansfield, OH
- Population (ZIP)
- 4,876
- Household income
- $31,619
- Rent vs Own
- Severe rent burden
- 13.2
Population outlook (Richland County) Hauer SSP2
- Today (2025)
- 115,577 people
- By 2030
- 111,669 · -3.4%
- By 2040
- 103,323 · -10.6%
- By 2050
- 95,135 · -17.7%
- By 2075
- 76,719 · -33.6%
- By 2100
- 57,188 · -50.5%
Race, ethnicity, and origin ACS 2023
- Neighborhood character
- Diverse neighborhood (Simpson 0.61)
- Race & ethnicity
- White 52% Black 35% Two or more races 10% Hispanic / Latino 5%
- Common ancestry
- Italian 2% Serbian 2% Iranian 1%
- Foreign-born
- 1% · Canada
- Languages at home
- 95% English-only · Spanish 4% Other Indo-European 1%
Political lean MEDSL · Richland
- 2024 margin
- Solid R (+42.3) · D 28.4% · R 70.8%
- 2008→2024 swing
- -28.8pp toward R · 2008: -13.6pp · 2024: -42.3pp
- All cycles
- 2024: R+42.3 2020: R+39.7 2016: R+37.5 2012: R+20.1 2008: R+13.6
Not yet ingested
- Civics
- —
Market trends
- HPI YoY
- ▲ 8.45%
- Current HPI
- 302.035
- Rent YoY
- —
- Metro
- —
- State GDP YoY
- ▲ 1.98%
- F500 in state
- 48
Industry mix (Fortune 500 HQ in OH)
| Industry | F500 HQs | Revenue |
|---|---|---|
| Insurance | 3 | $145B |
|
||
| Industrial Machinery | 3 | $49B |
|
||
| Financial Services | 3 | $24B |
|
||
| Consumer Goods | 2 | $93B |
|
||
| Aerospace / Defense | 2 | $47B |
|
||
| Utilities | 2 | $33B |
|
||
Price history
+127.0% since first listed7 events — show timeline
- 2026-05-29 Price Changed $74,900 MARMLS
- 2026-05-29 Price Changed $74,900 ABOR
- 2026-05-29 Price Changed $74,900 MLSNOW
- 2026-04-30 Listed $79,900 MLSNOW
- 2026-04-30 Listed $79,900 ABOR
- 2026-04-30 Listed $79,900 MARMLS
- 1997-12-15 Sold (Public Records) $33,000 Public Records
Property tax history
+16.1%/yrLatest (2025): $598 · +0.0% YoY. Source: county tax records.
Cash-flow waterfall
monthlySold comps — $/sqft
last 12 mo · ≤1 miLoading sold comps…