 🔨 Auction
19326 Old Delta Rd · Tamms, IL
Flood risk 1/10 · Minimal
- FEMA flood zone
- X (unshaded)
- Chance of flooding over 30 yrs
- 0.0%
- Est. flood insurance / yr
- $507 – $1,088
Fire risk 3/10 · Minor
- Est. fire insurance / yr
- $804 – $1,492
Heat risk 4/10 · Minor
- Hot days now (above 108°F)
- 6 days/yr
- Hot days in 30 yrs
- 18 days/yr
Wind risk 2/10 · Minimal
- Chance of severe wind over 30 yrs
- 3.0%
Air-quality risk 2/10 · Minimal
- Unhealthy air days now
- 0 days/yr
- Unhealthy air days in 30 yrs
- 1 days/yr
Risk factors via First Street. Map © Google.
Why this score? — see what drove the D+ grade
The composite is a weighted blend of 9 inputs, each scored 0–100. Each bar is that input's sub-score; the figure is the points it added to the 100-point composite (weight × sub-score).
- Cash flow +15.0/30.0
- ARV discount +7.5/15.0
- 1% rule +5.0/10.0
- DSCR +5.0/10.0
- Appreciation +3.9/10.0
- Livability +2.8/5.0
- Rent growth +2.5/5.0
- Condition / age +2.5/5.0
- Schools +1.4/10.0
$1
🖨 Deal sheet 📄 Offer letter ✓ Due diligence
Listing remarks
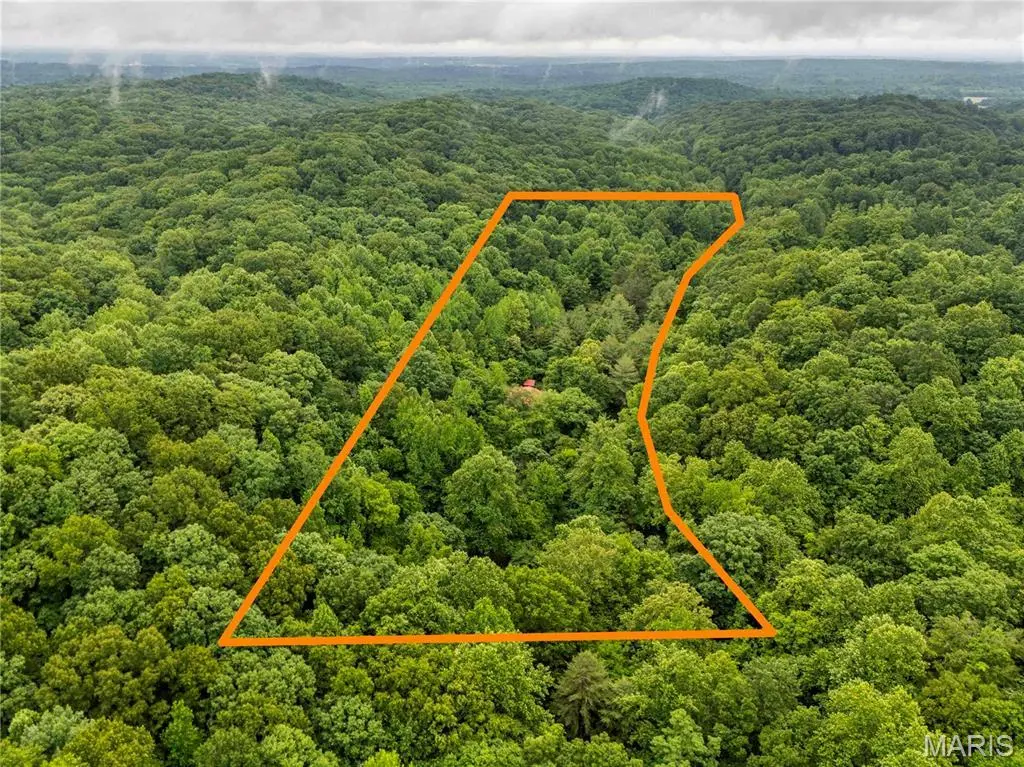
AUCTION LISTING - List price is not indicative of Seller’s final reserve amount. This property is part of an online bidding event. This sale will be executed with a no-contingency contract provided by the brokerage representing the Seller. See MLS Supplement Document for complete details. Tucked into the rolling country of Alexander County and surrounded by thousands of acres of the Shawnee National Forest, this 17.47- acre property pairs a comfortable three-level home with the kind of land that rewards both everyday living and serious outdoor recreation. The residence offers three bedrooms and three baths, a recently remodeled kitchen, and a partially finished walkout basement built
Key facts
- Covered porch
- Three level home
- Metal roof
Tags
Property features AI
Finance
- Financial info: Property listed for auction
Exterior
- Parking: Detached garage with storage (garage approx. 15 x 20) — 1 garage space
- Utilities: Well water; Septic tank; Single-phase electric service; Electricity, phone, sewer and water connected/available
- Home design: Farm property; Private ownership; Three or more levels; Concrete perimeter foundation; Metal roof; Wood siding
- Construction: Wood siding construction; Metal roof; Concrete perimeter foundation
- Exterior features: Adjoins government land and scattered woods; Pasture and wooded areas on the property; Pond on the property; Barn(s) and storage structures; Gravel road frontage on a county road
Interior
- Kitchen: Free-standing refrigerator
- Bedrooms: Three bedrooms total (two on the main level, one on the upper level); Bedroom approx. 13 x 17.5
- Flooring: Carpet; Vinyl; Wood
- Bathrooms: One full bathroom; Two half bathrooms (one on upper level, one on lower level)
- Heating & cooling: Baseboard heating; Wall/window air conditioning units
- Interior features: Free-standing refrigerator; Basement with partial finish, daylight windows, concrete floor, bathroom, storage space and walk-out access; No fireplace
- Laundry & utility: Laundry located in the basement
Neighborhood map
What this means for you Summary
Snapshot
- This is a 3-bed/2.0-bath single-family listed at $1.
Deal economics
- At list price, monthly cash flow is $997 ($12k/yr) — positive.
- The deal already cash-flows at list — no discount required.
- Meets the 1% rule at list price ($1k rent vs $1).
Location & tenants
- Location reads 56/100 on livability (#1,222 in IL) — a working-class tenant base; expect higher turnover. Strengths: cost of living A+, housing A+; Watch: schools F, crime F, amenities F.
- Egyptian CUSD 5 (rural): math 10% / reading 15% proficiency, ranked #812 of 919 in IL (top 88%) — low school quality limits family demand, transient renter base, plan for 1-2y turnover.
- Market conditions: 6 active listings in the ZIP.
Forward outlook
- Local home prices are declining (-2.2%/yr); year-one equity from $0 of loan paydown is wiped out by about $0 of value loss. Plan a longer hold.
- Alexander County population projected at -53% by 2050 — secular population decline; favor cash flow + early exit over multi-decade hold.
- At projected returns (-2.2% appreciation + 3.0% rent growth), your $0 cash investment doubles in ~1 year — after that, you're playing with house money.
Negotiation context
- It's been on market 21 days — a 2% lower offer ($0) is reasonable based on typical stale-listing flexibility.
- 2 sale attempts since 2y ago with the ask held roughly flat each time — persistent listings suggest the price (not the market) is what's stuck; bring a comps-based counter.
Risks & watch-outs
- Watch-outs: built in 1927 — expect roof / HVAC / electrical / plumbing capex.
Questions for the listing agent
- Built in 1927 — when were the roof, HVAC, electrical panel, plumbing, and water heater last replaced?
- Is there a deadline driving the sale (1031 exchange, divorce, estate, relocation)? That informs how much negotiation room exists.
- Schools are F-rated, which usually means shorter tenancies and higher turnover. Who's the typical renter profile here, and what's been the actual vacancy rate?
- Crime grade is F in this area — have there been break-ins, vandalism, or insurance claims at this property in the last 3 years? What carrier currently insures it and at what premium?
- The area grade is low — what's the realistic commute time and amenity access for the typical tenant pool here? Any planned neighborhood developments (good or bad) we should know about?
- What's the average days-on-market for RENTAL listings here right now (not sales)? A rising rental-DOM trend means longer vacancies and softer asking-rent achievability than the comps imply.
- What's the recent tenant-quality profile in this submarket — average credit score on applications, eviction rate, late-payment / NSF rate, and stable-employment percentage? A property-management company in the area should have these aggregated.
- How much new for-sale + rental construction is in the pipeline within 1–3 miles? Heavy new supply typically softens prices + rents 12–24 months out; constrained supply supports both.
Investment metrics
- 1% rule
- 126258.00% ✓
- Cap rate
- 1196923.84%
- Cash-on-cash
- 4274705.53%
- DSCR
- 190201.34
- GRM
- 0.0
CMA / ARV
No comps found within radius.
Projected returns pro-forma
-2.23% appreciation · 3.0% rent growth · sell at horizon
- IRR
- —
- Equity multiple
- 226950.46×
- Total profit
- $63,546
- Equity at exit
- $0
- IRR
- —
- Equity multiple
- 490047.79×
- Total profit
- $137,213
- Equity at exit
- $0
Cash invested: $0 (down + closing). Projections, not guarantees.
Landlord ↔ Tenant lean methodology
- Overall (STATE)
- 43 Moderately Tenant-Leaning
- State Illinois
- 43 Moderately Tenant-Leaning · D+7
- County
- — inherits STATE
- City
- — inherits STATE
ZIP-level market 62988
- Home prices YoY
- -3.0%
- Active inventory
- 6
Monthly cashflow live
- Estimated rent
- $1,263 medium interval (Pro) →
- Mortgage (P&I)
- −$0
- Tax est. 1.5%
- −$0 /mo · $0/yr
- Insurance
- −$0
- HOA
- −$0
- Vacancy / Maint / Mgmt
- −$265
- Net cashflow
- $997
Break-even live
UW: 25.0% down · 7.5% · 30yr · 1.5% tax · 5.0% vac · 8.0% maint · 8.0% mgmt
Financing live
Cash to close
- Down payment
- $0
- Closing costs
- $0
- Reserves months
- —
- Total cash needed
- —
Loan-product check · same deal, 3 products live
Conventional
25% down · 7.5% · 30yr
- Down + closing
- —
- Monthly P&I
- —
- Monthly cashflow
- —
- DSCR
- —
- Eligible?
- —
Personal DTI + credit; lowest rate.
DSCR
20% down · 8.5% · 30yr
- Down + closing
- —
- Monthly P&I
- —
- Monthly cashflow
- —
- DSCR
- —
- Eligible?
- —
No personal income docs; deal must DSCR.
Hard money
10% down · 12.0% · 12mo
- Down + closing
- —
- Monthly P&I
- —
- Monthly cashflow
- —
- DSCR
- —
- Eligible?
- —
Short-term bridge; refi at stabilization.
Listing history 18 events
-
2026-06-18days on market $1 Active 21 DOM
-
2026-06-17days on market $1 Active 20 DOM
-
2026-06-16days on market $1 Active 19 DOM
-
2026-06-15days on market $1 Active 18 DOM
-
2026-06-13days on market $1 Active 16 DOM
-
2026-06-12days on market $1 Active 15 DOM
-
2026-06-09days on market $1 Active 12 DOM
-
2026-06-08days on market $1 Active 11 DOM
-
2026-06-07days on market $1 Active 10 DOM
-
2026-06-05days on market $1 Active 8 DOM
-
2026-06-04days on market $1 Active 6 DOM
-
2026-06-02days on market $1 Active 5 DOM
-
2026-06-01days on market $1 Active 4 DOM
-
2026-05-31days on market $1 Active 3 DOM
-
2026-05-31days on market $1 Active 2 DOM
-
2026-05-28$1 Active
-
2025-02-04historical
-
2024-08-21$184,900 Active
ⓘ Source: listings_history table (triggers on properties + properties_extension) + one-shot
backfill from property_details.listing_events for pre-trigger history.
Climate risk First Street
- Flood 1/10 Low FEMA zone X (unshaded) · 0% chance over 30 yrs
- Wildfire 3/10 Moderate
- Heat 4/10 Moderate 6 d/yr ≥108°F today · 18 d/yr by 30 yrs out
- Wind 2/10 Low 3% chance of damaging wind over 30 yrs
- Air quality 2/10 Low 0 unhealthy d/yr today · 1 by 30 yrs out
Nearby sold comps map
Loading sold comps map…
Walkable amenities ~0.75 mi
Loading nearby amenities…
Taxation est. · year 1
- Rental income
- $15,151
- − Mortgage interest
- −$0
- − Property taxes
- −$0
- − Insurance
- −$0
- − Repairs & maintenance
- −$1,212
- − Management
- −$1,212
- − Depreciation
- −$0
- Taxable income
- $12,727
- Est. tax owed @ 24.0%
- −$3,054
- After-tax cash flow
- $8,915/yr
For passive investors: Depreciation is non-cash, so a rental often shows a tax loss while cash-flowing — sheltering income. Rental losses are passive: they offset passive income freely, and up to $25,000/yr can offset ordinary (W-2) income if you actively participate and your MAGI is under $100k (phasing out to $0 by $150k); unused losses carry forward. On sale, claimed depreciation is recaptured at up to 25%, and gains may owe capital-gains tax (a 1031 exchange can defer both). Figures are a year-1 estimate at your 24.0% rate — not tax advice; consult a CPA.
Schools (NCES district)
- District
- Egyptian CUSD 5
- NCES district ID
- 1713590
- Math proficiency
- 10% ▼ -3.00%
- Reading proficiency
- 15% ▲ 1.00%
- Median HH income
- $36,975
- Composite
- 13.99/100
- National rank
- #14453
- State rank
- #812 of 919 in IL
Livability — Tamms
- Score
- 56/100
- State rank
- #1222
- US rank
- #22967
Category grades
Schools grade is shown separately in the Schools card above.
Census & demographics
- Population (ZIP)
- 1,222
Population outlook (Alexander County) Hauer SSP2
- Today (2025)
- 4,931 people
- By 2030
- 4,184 · -15.1%
- By 2040
- 3,052 · -38.1%
- By 2050
- 2,325 · -52.8%
- By 2075
- 1,567 · -68.2%
- By 2100
- 1,350 · -72.6%
Race, ethnicity, and origin ACS 2023
- Neighborhood character
- Diverse neighborhood (Simpson 0.55)
- Race & ethnicity
- White 57% Black 35% Hispanic / Latino 5% Two or more races 5%
- Hispanic origin (detail)
- Mexican 2% Puerto Rican 3%
- Common ancestry
- Italian 3% Scottish 3% Portuguese 1%
- Foreign-born
- 1%
Political lean MEDSL · Alexander
- 2024 margin
- R (+19.2) · D 39.8% · R 59.0% · Other 1.1%
- 2008→2024 swing
- -31.9pp toward R · 2008: 12.6pp · 2024: -19.2pp
- All cycles
- 2024: R+19.2 2020: R+14.2 2016: R+8.3 2012: D+13.6 2008: D+12.6
Not yet ingested
- Civics
- —
Market trends
- HPI YoY
- ▼ -2.23%
- Current HPI
- 71.6433
- Rent YoY
- —
- Metro
- —
- State GDP YoY
- ▲ 1.59%
- F500 in state
- 60
Industry mix (Fortune 500 HQ in IL)
| Industry | F500 HQs | Revenue |
|---|---|---|
| Insurance | 4 | $201B |
|
||
| Consumer Goods | 4 | $87B |
|
||
| Industrial Machinery | 3 | $64B |
|
||
| Healthcare | 2 | $55B |
|
||
| Retail / Pharmacy | 1 | $148B |
|
||
| Agriculture / Food | 1 | $86B |
|
||
Price history
3 events — show timeline
- 2026-05-28 Listed $1 MARIS as Distributed by MLS Grid
- 2025-02-04 Delisted — MARIS as Distributed by MLS Grid
- 2024-08-21 Listed $184,900 MARIS as Distributed by MLS Grid
Cash-flow waterfall
monthlySold comps — $/sqft
last 12 mo · ≤1 miLoading sold comps…