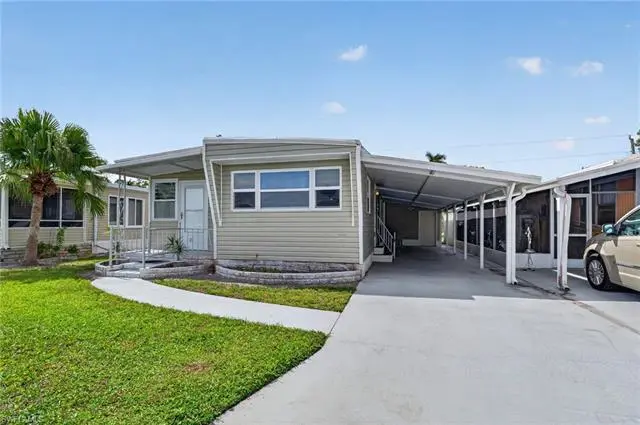
77 Enchanting Blvd Unit E77 · Naples, FL
Flood risk 9/10 · Severe
- FEMA flood zone
- AE
- Chance of flooding over 30 yrs
- 0.99%
- Est. flood insurance / yr
- $1,737 – $8,500
Fire risk 4/10 · Minor
- Est. fire insurance / yr
- $947 – $1,759
Heat risk 10/10 · Severe
- Hot days now (above 107°F)
- 7 days/yr
- Hot days in 30 yrs
- 28 days/yr
Wind risk 10/10 · Severe
- Chance of severe wind over 30 yrs
- 99.0%
Air-quality risk 3/10 · Minor
- Unhealthy air days now
- 3 days/yr
- Unhealthy air days in 30 yrs
- 3 days/yr
Risk factors via First Street. Map © Google.
Why this score? — see what drove the B grade
The composite is a weighted blend of 9 inputs, each scored 0–100. Each bar is that input's sub-score; the figure is the points it added to the 100-point composite (weight × sub-score).
- Cash flow +30.0/30.0
- 1% rule +10.0/10.0
- DSCR +10.0/10.0
- ARV discount +7.5/15.0
- Schools +5.0/10.0
- Livability +4.0/5.0
- Condition / age +3.8/5.0
- Rent growth +2.1/5.0
- Appreciation +0.0/10.0
$115,000
🖨 Deal sheet (PDF) 📄 Offer letter ✓ Due diligence
Listing remarks
This inviting double-wide mobile home offers more than 1000 sq ft of comfortable living space in the desirable Enchanting Acres 55+ community. Featuring 2 bedrooms and 2 bathrooms, this Turnkey Furnished & well-maintained home is move-in ready and perfect for full-time living, seasonal enjoyment, or as a second home. The front-facing kitchen is bright and functional, equipped with a dishwasher, microwave, electric range, and French door refrigerator—ideal for preparing daily meals or entertaining guests. Adjacent is a delightful Florida room with northeast exposure, perfect for morning coffee, relaxing, or enjoying the gentle breeze. Additional highlights include a convenient la
Key facts
- Front-facing kitchen
- Mini-split ac system
- Florida room
Tags
Property features AI
Finance
- Other: Part of a complex with 169 units; single unit in building; single-floor building
- HOA & community: Mobile/manufactured community (non-gated); Professional management; Community amenities include clubhouse, community pool, bocce court, shuffleboard (see remarks); Maintenance covers lawn/land, legal/accounting, trash removal, and water; One-time fee of $50; Total annual recurring fees approximately $3,924; Total one-time fees approximately $150
Exterior
- Parking: Attached carport with 2 carport spaces
- Utilities: Central water; Central sewer; Cable available; Electric power (central)
- Home design: Manufactured residential property; 1 story / ranch; Rear exposure faces south; Built 1973; Located in Enchanting Acres Mobile Home community
- Construction: Manufactured construction; Vinyl siding exterior finish; Built-up or rolled (flat) roof
- Exterior features: Storage; Single-hung windows; Central irrigation; Landscaped area view; Deeded restrictions
Interior
- Kitchen: Electric cooktop; Dishwasher; Microwave; Refrigerator; Pantry
- Bedrooms: 2 bedrooms plus den (split bedroom floor plan)
- Flooring: Laminate; Vinyl
- Bathrooms: 2 full bathrooms; Master bath with shower-only configuration
- Heating & cooling: Central electric heating (see remarks); Central electric cooling (see remarks)
- Interior features: Built-in cabinets; Cable prewire; Laundry tub; Pantry; Window coverings; Den (study); Florida room; Laundry in residence; Turnkey
- Laundry & utility: Washer; Dryer; Laundry tub
Neighborhood map
What this means for you Summary
Snapshot
- This is a 2-bed/2.0-bath manufactured listed at $115k. Condition is rated good.
Deal economics
- At list price, monthly cash flow is $663 ($8k/yr) — positive.
- The deal already cash-flows at list — no discount required.
- Meets the 1% rule at list price ($2k rent vs $115k).
- Recommended offer: $108k (6.0% below list) — sets the bar for market timing.
Location & tenants
- Location reads 80/100 on livability (#126 in FL, #1,903 nationally) — a professional / high-income tenant draw. Strengths: crime A+, amenities A+, employment A+; Watch: commute D+, cost of living F.
- Collier (suburban): math 60% / reading 56% proficiency, ranked #16 of 73 in FL (top 22%) — acceptable for families but not a draw, mixed tenant base, ~2y average lease.
- Market conditions: Rents soft (-1.7%/yr); 771 active listings in the ZIP; 40 comparable units currently listed for rent nearby; rentals at typical pace (median 24d on market — plan ~3-4 weeks tenant-placement turnaround); 3,520 units permitted in Collier County in 2024 (959 in 5+ unit buildings).
- This rent runs 41% of the median local income ($70k/yr) — at the standard rent-burdened threshold; future hikes will face affordability resistance.
Forward outlook
- Local home prices are declining (-3.0%/yr); year-one equity from $795 of loan paydown is wiped out by about $3k of value loss. Plan a longer hold.
- Collier County population projected at +30% by 2050 — long-run rental-demand tailwind backs the buy-and-hold thesis.
- At projected returns (-3.0% appreciation + 0.0% rent growth), your $32k cash investment doubles in ~7 years — after that, you're playing with house money.
Negotiation context
- It's been on market 63 days — a 6% lower offer ($108k) is reasonable based on typical stale-listing flexibility.
Risks & watch-outs
- Watch-outs: flood insurance adds $427/mo.
- Climate carrying-cost: in FEMA flood zone AE (mandatory federal flood insurance); severe wind risk, 99% chance of damaging wind over 30y; extreme-heat days projected 7→28/yr by 2055 (HVAC capex compounding) — expect insurance premiums to compound above CPI over the hold.
Questions for the listing agent
- It's been on market 63 days. Have you received any prior offers? Is the seller open to a 6% concession, seller financing, or rate buy-down credit?
- Built in 1973 — when were the roof, HVAC, electrical panel, plumbing, and water heater last replaced?
- What's the actual annual flood-insurance premium (NFIP or private), and is the property in a SFHA with mandatory coverage?
- Why hasn't it sold? Are there any deal-killer items the seller is aware of (foundation, flood, title, zoning, code violations)?
- Is there a deadline driving the sale (1031 exchange, divorce, estate, relocation)? That informs how much negotiation room exists.
- Schools are B-rated — typically a magnet for longer-tenancy family renters. What's the average tenant stay here, and is there a school-zone premium baked into asking?
- What's the average days-on-market for RENTAL listings here right now (not sales)? A rising rental-DOM trend means longer vacancies and softer asking-rent achievability than the comps imply.
- What's the recent tenant-quality profile in this submarket — average credit score on applications, eviction rate, late-payment / NSF rate, and stable-employment percentage? A property-management company in the area should have these aggregated.
- How much new for-sale + rental construction is in the pipeline within 1–3 miles? Heavy new supply typically softens prices + rents 12–24 months out; constrained supply supports both.
Investment metrics
- 1% rule
- 2.07% ✓
- Cap rate
- 17.66%
- Cash-on-cash
- 40.61%
- DSCR
- 2.81
- GRM
- 4.0
CMA / ARV
No comps found within radius.
Projected returns pro-forma
-3.0% appreciation · 0.0% rent growth · sell at horizon
- IRR
- 13.8%
- Equity multiple
- 1.53×
- Total profit
- $16,916
- Equity at exit
- $17,147
- IRR
- 19.5%
- Equity multiple
- 2.35×
- Total profit
- $43,320
- Equity at exit
- $9,943
Cash invested: $32,200 (down + closing). Projections, not guarantees.
Landlord ↔ Tenant lean methodology
- Overall (STATE)
- 87 Strongly Landlord-Friendly
- State Florida
- 87 Strongly Landlord-Friendly · R+3
- County
- — inherits STATE
- City
- — inherits STATE
ZIP-level market 34112
- Rents YoY
- -1.7%
- Active inventory
- 771
- Price-to-rent
- 4.0×
Monthly cashflow live
- Estimated rent
- $2,386 high interval (Pro) →
- Mortgage (P&I)
- −$603
- Tax est. 1.5%
- −$144 /mo · $1,725/yr
- Insurance
- −$48
- Flood insurance flood zone
- −$427 /mo · $5,118/yr
- HOA
- −$0
- Vacancy / Maint / Mgmt
- −$501
- Net cashflow
- $663
Break-even live
Sensitivity live
| Price | -10% $743 | -5% $703 | +0% $663 | +5% $624 | +10% $584 |
|---|---|---|---|---|---|
| Rent | -10% $475 | -5% $569 | +0% $663 | +5% $757 | +10% $852 |
| Rate | -1.0pp $721 | -0.5pp $693 | base $663 | +0.5pp $633 | +1.0pp $603 |
UW: 25.0% down · 7.5% · 30yr · 1.5% tax · 5.0% vac · 8.0% maint · 8.0% mgmt
Financing live
Cash to close
- Down payment
- $28,750
- Closing costs
- $3,450
- Reserves months
- —
- Total cash needed
- —
Loan-product check · same deal, 3 products live
Conventional
25% down · 7.5% · 30yr
- Down + closing
- —
- Monthly P&I
- —
- Monthly cashflow
- —
- DSCR
- —
- Eligible?
- —
Personal DTI + credit; lowest rate.
DSCR
20% down · 8.5% · 30yr
- Down + closing
- —
- Monthly P&I
- —
- Monthly cashflow
- —
- DSCR
- —
- Eligible?
- —
No personal income docs; deal must DSCR.
Hard money
10% down · 12.0% · 12mo
- Down + closing
- —
- Monthly P&I
- —
- Monthly cashflow
- —
- DSCR
- —
- Eligible?
- —
Short-term bridge; refi at stabilization.
Rent comps 40 comps
| Address | Beds | Baths | Sqft | Rent | $/sqft | DOM | Units | Dist |
|---|---|---|---|---|---|---|---|---|
| 3806 Guilford Rd Unit 4 Naples, FL | 2.0 | 2.0 | 1100 | $1,750 | $1.59 | 24d | 1 | 0.30mi |
| 3016 Van Buren Ave Naples, FL | 3.0 | 2.5 | 1332 | $3,500 | $2.63 | 24d | 1 | 0.40mi |
| 135 Palm Dr #12 Naples, FL | 2.0 | 2.0 | 1180 | $2,200 | $1.86 | 14d | 1 | 0.47mi |
| 154 Palm Dr Unit 1049699P Naples, FL | 2.0 | 2.0 | 1248 | $2,732 | $2.19 | 22d | 1 | 0.49mi |
| 3350 Putney Ct Naples, FL | 1.0–3.0 | 1.0–2.0 | 1038 | $2,986 | $2.88 | 14d | 26 | 0.49mi |
| 149 Palm Dr Unit 8617 Naples, FL | 2.0 | 2.0 | 981 | $2,000 | $2.04 | 14d | 1 | 0.50mi |
| 4455 Botanical Place Cir Unit 5-104 Naples, FL | 2.0 | 2.0 | 915 | $1,795 | $1.96 | 24d | 1 | 0.51mi |
| 4450 Botanical Place Cir Unit 6 Naples, FL | 2.0 | 2.0 | 915 | $1,895 | $2.07 | 22d | 1 | 0.53mi |
| 3005 Gordon St Naples, FL | 3.0 | 2.0 | 967 | $2,275 | $2.35 | 24d | 1 | 0.55mi |
| 3005 Gordon St Naples, FL | 3.0 | 2.0 | 967 | $2,275 | $2.35 | 14d | 1 | 0.55mi |
| 4430 Botanical Place Cir #303 Naples, FL | 2.0 | 2.0 | 1126 | $3,500 | $3.11 | 14d | 1 | 0.58mi |
| 190 Palm Dr Unit 3085 Naples, FL | 2.0 | 2.0 | 1251 | $1,850 | $1.48 | 14d | 1 | 0.58mi |
| 2840 Shoreview Dr Unit 7 Naples, FL | 2.0 | 1.0 | 800 | $2,000 | $2.50 | 24d | 1 | 0.59mi |
| 162 Teryl Rd Unit 6-2 Naples, FL | 2.0 | 2.0 | 1188 | $2,500 | $2.10 | 24d | 1 | 0.59mi |
| 131 Teryl Rd Unit 3UNIT 3 Naples, FL | 2.0 | 2.0 | 1080 | $1,750 | $1.62 | 14d | 1 | 0.60mi |
| 131 Teryl Rd Unit C3 Naples, FL | 2.0 | 2.0 | 1080 | $3,495 | $3.24 | 24d | 1 | 0.60mi |
| 2685 Van Buren Ave Naples, FL | 2.0 | 2.0 | 865 | $2,450 | $2.83 | 24d | 1 | 0.61mi |
| 4510 Botanical Place Cir Naples, FL | 3.0 | 2.0 | 1246 | $3,248 | $2.61 | 14d | 2 | 0.61mi |
| 3619 Poplar Way Unit B Naples, FL | 2.0 | 2.0 | 1045 | $2,300 | $2.20 | 24d | 1 | 0.61mi |
| 159 Teryl Rd #2 Naples, FL | 2.0 | 2.0 | 1080 | $5,200 | $4.81 | 14d | 1 | 0.62mi |
| 3950 Mohawk Pl Naples, FL | 2.0 | 2.0 | 1500 | $3,200 | $2.13 | 24d | 1 | 0.63mi |
| 200 Palm Dr #7 Naples, FL | 2.0 | 2.0 | 1010 | $1,600 | $1.58 | 14d | 1 | 0.64mi |
| 3561 Thomasson Dr Naples, FL | 2.0 | 2.0 | 1085 | $8,000 | $7.37 | 24d | 1 | 0.66mi |
| 4719 Alladin Ln Naples, FL | 1.0–2.0 | 1.0–2.0 | 671 | $1,895 | $2.82 | 24d | 2 | 0.66mi |
| 209 Palm Dr #1 Naples, FL | 2.0 | 2.0 | 1215 | $5,000 | $4.12 | 14d | 1 | 0.67mi |
| 4607 Bayshore Dr Unit K7 Naples, FL | 2.0 | 2.0 | 886 | $1,650 | $1.86 | 24d | 1 | 0.67mi |
| 4621 Bayshore Dr Naples, FL | 2.0 | 2.0 | 886 | $1,675 | $1.89 | 24d | 2 | 0.67mi |
| 216 Palm Dr #5 Naples, FL | 2.0 | 2.0 | 1010 | $4,500 | $4.46 | 14d | 1 | 0.68mi |
| 4611 Bayshore Dr Unit O8 Naples, FL | 2.0 | 2.0 | 886 | $1,650 | $1.86 | 14d | 1 | 0.68mi |
| 3655 Boca Ciega Dr #202 Naples, FL | 2.0 | 2.0 | 966 | $1,800 | $1.86 | 24d | 1 | 0.69mi |
| 4629 Bayshore Dr Unit J7 Naples, FL | 2.0 | 2.0 | 886 | $1,600 | $1.81 | 24d | 1 | 0.70mi |
| 4603 Bayshore Dr Unit F8 Naples, FL | 2.0 | 2.0 | 886 | $2,550 | $2.88 | 24d | 1 | 0.70mi |
| 4617 Bayshore Dr Unit H5 Naples, FL | 2.0 | 2.0 | 886 | $1,700 | $1.92 | 24d | 1 | 0.70mi |
| 2505 Storter Ave Naples, FL | 3.0 | 2.0 | 1484 | $2,795 | $1.88 | 14d | 1 | 0.71mi |
| 4551 Arboretum Cir Unit 202 Naples, FL | 2.0 | 2.0 | 1480 | $2,500 | $1.69 | 24d | 1 | 0.71mi |
| 232 Palm Dr Unit 47-5 Naples, FL | 2.0 | 2.0 | 1010 | $2,500 | $2.48 | 24d | 1 | 0.71mi |
| 4635 Bayshore Dr Unit P7 Naples, FL | 2.0 | 2.0 | 886 | $1,600 | $1.81 | 14d | 1 | 0.72mi |
| 4615 Bayshore Dr Unit E8 Naples, FL | 2.0 | 2.0 | 886 | $1,600 | $1.81 | 14d | 1 | 0.72mi |
| 229 Palm Dr Unit 229-2 Naples, FL | 2.0 | 2.0 | 1215 | $4,400 | $3.62 | 14d | 1 | 0.72mi |
| 240 Palm Dr Unit 48-1 Naples, FL | 2.0 | 2.0 | 1100 | $1,800 | $1.64 | 24d | 1 | 0.73mi |
Listing history 12 events
-
2026-06-18days on market $115,000 Active 63 DOM
-
2026-06-17days on market $115,000 Active 62 DOM
-
2026-06-16days on market $115,000 Active 61 DOM
-
2026-06-15days on market $115,000 Active 60 DOM
-
2026-06-14days on market $115,000 Active 58 DOM
-
2026-06-10days on market $115,000 Active 55 DOM
-
2026-06-09days on market $115,000 Active 54 DOM
-
2026-06-08days on market $115,000 Active 53 DOM
-
2026-06-07days on market $115,000 Active 52 DOM
-
2026-06-03days on market $115,000 Active 48 DOM
-
2026-06-03remarks 689-char remark
-
2026-06-03$115,000 Active 47 DOM
ⓘ Source: listings_history table (triggers on properties + properties_extension) + one-shot
backfill from property_details.listing_events for pre-trigger history.
Climate risk First Street
- Flood 9/10 Extreme FEMA zone AE · 99% chance over 30 yrs
- Wildfire 4/10 Moderate
- Heat 10/10 Extreme 7 d/yr ≥107°F today · 28 d/yr by 30 yrs out
- Wind 10/10 Extreme 99% chance of damaging wind over 30 yrs
- Air quality 3/10 Moderate 3 unhealthy d/yr today · 3 by 30 yrs out
Nearby sold comps map
Loading sold comps map…
Walkable amenities ~0.75 mi
Loading nearby amenities…
Taxation est. · year 1
- Rental income
- $28,626
- − Mortgage interest
- −$6,442
- − Property taxes
- −$1,725
- − Insurance
- −$5,694
- − Repairs & maintenance
- −$2,290
- − Management
- −$2,290
- − Depreciation
- −$3,345
- Taxable income
- $6,840
- Est. tax owed @ 24.0%
- −$1,642
- After-tax cash flow
- $6,318/yr
For passive investors: Depreciation is non-cash, so a rental often shows a tax loss while cash-flowing — sheltering income. Rental losses are passive: they offset passive income freely, and up to $25,000/yr can offset ordinary (W-2) income if you actively participate and your MAGI is under $100k (phasing out to $0 by $150k); unused losses carry forward. On sale, claimed depreciation is recaptured at up to 25%, and gains may owe capital-gains tax (a 1031 exchange can defer both). Figures are a year-1 estimate at your 24.0% rate — not tax advice; consult a CPA.
Condition & rehab AI · 12 photos
This move-in ready double-wide mobile home in the Enchanting Acres 55+ community offers a good condition with minor cosmetic updates to enhance its curb appeal and energy efficiency.
Value-add opportunities
- Resale Paint exterior siding — Enhances curb appeal and value
- Both Replace blinds with energy-efficient ones — Improves energy efficiency and aesthetics
- Both Install smart home devices — Enhances convenience and marketability
Renovation cost estimate screening
Value-add ROI direction
- Resale Paint exterior siding — Enhances curb appeal and value ↑
- Both Replace blinds with energy-efficient ones — Improves energy efficiency and aesthetics ↑
- Both Install smart home devices — Enhances convenience and marketability ↑
ⓘ Cost ranges are severity-bucket heuristics (US national rule-of-thumb). Get contractor quotes + a written scope before underwriting a rehab budget.
Schools (NCES district)
- District
- Collier
- NCES district ID
- 1200330
- Math proficiency
- 60% ▼ -4.00%
- Reading proficiency
- 56% ▼ -2.00%
- Median HH income
- $58,275
- Composite
- 50.23/100
- National rank
- #1892
- State rank
- #16 of 73 in FL
Livability — Naples
- Score
- 80/100
- State rank
- #126
- US rank
- #1903
Category grades
Schools grade is shown separately in the Schools card above.
Census & demographics
- County
- Collier County · 396,295 people
- Metro
- Naples-Marco Island, FL
- Population (ZIP)
- 27,193
- Household income
- $69,842
- Rent vs Own
- Severe rent burden
- 980.0
Population outlook (Collier County) Hauer SSP2
- Today (2025)
- 420,858 people
- By 2030
- 450,054 · +6.9%
- By 2040
- 502,232 · +19.3%
- By 2050
- 544,932 · +29.5%
- By 2075
- 627,203 · +49.0%
- By 2100
- 659,015 · +56.6%
Race, ethnicity, and origin ACS 2023
- Neighborhood character
- Predominantly White (74%)
- Race & ethnicity
- White 74% Hispanic / Latino 18% Two or more races 9% Black 6% Native American 2% Asian 1%
- Hispanic origin (detail)
- Mexican 7% Puerto Rican 2% Cuban 4% Dominican 1%
- Common ancestry
- Hispanic 4% Romanian 3% Portuguese 2%
- Foreign-born
- 19% · Canada, Jamaica
- Languages at home
- 75% English-only · Spanish 17% French/Haitian/Cajun 4% German/W. Germanic 1%
Political lean MEDSL · Collier
- 2024 margin
- Solid R (+33.1) · D 33.1% · R 66.2%
- 2008→2024 swing
- -10.6pp toward R · 2008: -22.5pp · 2024: -33.1pp
- All cycles
- 2024: R+33.1 2020: R+24.7 2016: R+26.0 2012: R+30.1 2008: R+22.5
Not yet ingested
- Civics
- —
Market trends
- HPI YoY
- ▼ -235.10%
- Current HPI
- 256.9182
- Rent YoY
- ▼ -1.69%
- Metro
- Naples-Marco Island, FL
- State GDP YoY
- ▲ 3.28%
- F500 in state
- 36
Industry mix (Fortune 500 HQ in FL)
| Industry | F500 HQs | Revenue |
|---|---|---|
| Industrial Technology | 2 | $29B |
|
||
| Insurance | 2 | $17B |
|
||
| Retail | 1 | $60B |
|
||
| Technology Distribution | 1 | $58B |
|
||
| Homebuilding | 1 | $35B |
|
||
| Technology Manufacturing | 1 | $35B |
|
||
Price history
1 event — show timeline
- 2026-04-16 Listed $115,000 NAPLESMLS
Cash-flow waterfall
monthlySold comps — $/sqft
last 12 mo · ≤1 miLoading sold comps…