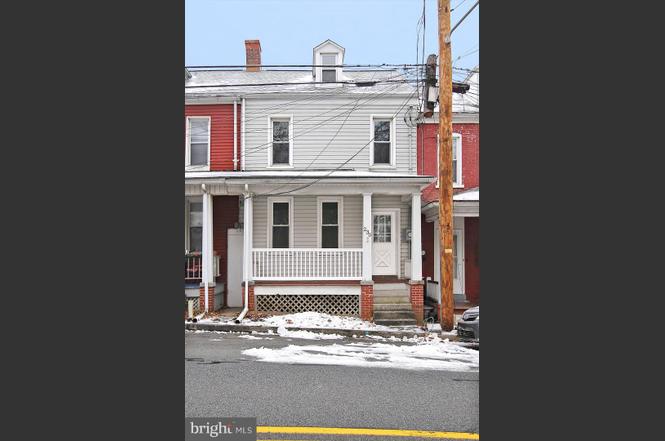
230 Rexmont Rd · Cornwall, PA
Flood risk 1/10 · Minimal
- FEMA flood zone
- X (unshaded)
- Chance of flooding over 30 yrs
- 0.0%
- Est. flood insurance / yr
- $507 – $1,088
Fire risk 4/10 · Minor
- Est. fire insurance / yr
- $511 – $949
Heat risk 4/10 · Minor
- Hot days now (above 98°F)
- 7 days/yr
- Hot days in 30 yrs
- 15 days/yr
Wind risk 4/10 · Minor
- Chance of severe wind over 30 yrs
- 10.0%
Air-quality risk 3/10 · Minor
- Unhealthy air days now
- 3 days/yr
- Unhealthy air days in 30 yrs
- 4 days/yr
Risk factors via First Street. Map © Google.
Why this score? — see what drove the D+ grade
The composite is a weighted blend of 9 inputs, each scored 0–100. Each bar is that input's sub-score; the figure is the points it added to the 100-point composite (weight × sub-score).
- ARV discount +15.0/15.0
- Cash flow +13.4/30.0
- DSCR +4.1/10.0
- Schools +4.1/10.0
- Livability +3.5/5.0
- 1% rule +3.4/10.0
- Rent growth +3.4/5.0
- Condition / age +2.5/5.0
- Appreciation +0.0/10.0
$179,900
🖨 Deal sheet 📄 Offer letter ✓ Due diligence
Listing remarks
Welcome to this historic row home in Anthracite Village, nestled in a quiet Cornwall neighborhood with easy access to local amenities and the Quentin shopping district. This charming property features a unique layout with 3 bedrooms and 1 bathroom, offering character you won’t find in a typical home. Fresh paint throughout provides a clean, move-in-ready feel. Enjoy the convenience of off-street parking, a fenced backyard perfect for relaxing or entertaining, and a large shed for additional storage. Whether you’re a first-time homebuyer looking to build equity or an investor seeking a solid opportunity, this vacant home is easy to show and ready for its next owner. Motivated sel
Key facts
- Built 1869
- Listed 119 days
Property features AI
Finance
- Other: Lease not considered
- Financial info: Fee simple ownership; Below-grade finished area: 160; Above-grade finished area: 910; Total below-grade area reported as 160
Exterior
- Parking: Off-street parking
- Utilities: Public water; Public sewer; 200+ amp electric service; Oil hot water
- Home design: Interior townhouse/rowhouse; Entry configured in townhouse/rowhouse style
- Construction: Vinyl siding exterior; Shingle roof; Permanent foundation; Above-grade and below-grade structures; Year built per assessor
- Exterior features: Not in a federal flood zone; No tidal water
Interior
- Bedrooms: 3 bedrooms on the main level
- Bathrooms: 1 full bathroom on the main level; 1 full bathroom total
- Heating & cooling: Hot water heating; Heating fuel: oil and other; Window air conditioning units; Ceiling fans
- Interior features: Unfinished basement; Basement present
Neighborhood map
What this means for you Summary
Snapshot
- This is a 2-bed/1.0-bath single-family listed at $180k.
Deal economics
- At list price, monthly cash flow is $5 ($57/yr) — positive.
- The deal already cash-flows at list — no discount required.
- To meet the 1% rule (rent ≥ 1% of price), the offer needs to be $151k (16.0% below list).
- Recommended offer: $151k (16.0% below list) — sets the bar for 1% rule.
- Cap rate 6.3% vs local median 0.9% in Cornwall — top-decile yield for the area; either an underpriced asset or a hidden risk that comps aren't pricing in. Stress-test before assuming the spread holds.
Location & tenants
- Location reads 70/100 on livability (#740 in PA) — a middle-class / working-renter tenant base. Strengths: crime A+, employment A+, housing A+; Watch: amenities F, commute F, health & safety F.
- Cornwall-Lebanon SD (suburban): math 37% / reading 56% proficiency, ranked #219 of 539 in PA (top 41%) — families likely to look elsewhere, expect single-tenant / working-renter base with shorter leases.
- Market conditions: Rents rising (+3.5%/yr); 264 active listings in the ZIP; 315 units permitted in Lebanon County in 2024 (36 in 5+ unit buildings).
Forward outlook
- Local home prices are declining (-3.0%/yr); year-one equity from $1k of loan paydown is wiped out by about $5k of value loss. Plan a longer hold.
- Lebanon County population projected at +10% by 2050 — modest demand growth; plan on rents tracking national, not racing it.
Negotiation context
- It's been on market 119 days — a 9% lower offer ($164k) is reasonable based on typical stale-listing flexibility.
- Current owner paid $25k; list at $180k implies a 620% gain — meaningful room to come down on a strong offer.
Risks & watch-outs
- Watch-outs: built in 1869 — expect roof / HVAC / electrical / plumbing capex.
Questions for the listing agent
- It's been on market 119 days. Have you received any prior offers? Is the seller open to a 16% concession, seller financing, or rate buy-down credit?
- Built in 1869 — when were the roof, HVAC, electrical panel, plumbing, and water heater last replaced?
- Why hasn't it sold? Are there any deal-killer items the seller is aware of (foundation, flood, title, zoning, code violations)?
- Is there a deadline driving the sale (1031 exchange, divorce, estate, relocation)? That informs how much negotiation room exists.
- Schools are A-rated — typically a magnet for longer-tenancy family renters. What's the average tenant stay here, and is there a school-zone premium baked into asking?
- The area grade is low — what's the realistic commute time and amenity access for the typical tenant pool here? Any planned neighborhood developments (good or bad) we should know about?
- What's the average days-on-market for RENTAL listings here right now (not sales)? A rising rental-DOM trend means longer vacancies and softer asking-rent achievability than the comps imply.
- What's the recent tenant-quality profile in this submarket — average credit score on applications, eviction rate, late-payment / NSF rate, and stable-employment percentage? A property-management company in the area should have these aggregated.
- How much new for-sale + rental construction is in the pipeline within 1–3 miles? Heavy new supply typically softens prices + rents 12–24 months out; constrained supply supports both.
Investment metrics
- 1% rule
- 0.84% ✗
- Cap rate
- 6.32%
- Cash-on-cash
- 0.11%
- DSCR
- 1.01
- GRM
- 9.9
CMA / ARV
- ARV (on-the-fly)
- $264,290
- Comps found
- 2
Show comp detail 2 sales within ~0.75 mi
| Address | Dist | Beds/Ba | Sqft | Sold | Price | $/sf | Match |
|---|---|---|---|---|---|---|---|
| 206 Rex | 0.67mi | 3/2.0 (+1) | 1,192 (+11%) | 9mo | $295,000 | $247 | 33 |
| 356 Rexmont Rd | 0.72mi | 3/1.0 (+1) | 1,196 (+12%) | 19mo | $218,000 | $182 | 26 |
Match score weights: distance 35% · size 25% · config 20% · recency 20%. Top-matched comps best support the ARV.
Projected returns pro-forma
-3.0% appreciation · 3.53% rent growth · sell at horizon
- IRR
- -15.6%
- Equity multiple
- 0.44×
- Total profit
- $-28,048
- Equity at exit
- $26,824
- IRR
- -6.3%
- Equity multiple
- 0.59×
- Total profit
- $-20,716
- Equity at exit
- $15,554
Cash invested: $50,372 (down + closing). Projections, not guarantees.
Landlord ↔ Tenant lean methodology
- Overall (STATE)
- 62 Landlord-Friendly
- State Pennsylvania
- 62 Landlord-Friendly · EVEN
- County
- — inherits STATE
- City
- — inherits STATE
ZIP-level market 17042
- Rents YoY
- 3.5%
- Active inventory
- 264
- Price-to-rent
- 9.9×
Monthly cashflow live
- Estimated rent
- $1,511 medium interval (Pro) →
- Mortgage (P&I)
- −$943
- Tax from tax record
- −$171 /mo · $2,048/yr
- Insurance
- −$75
- HOA
- −$0
- Vacancy / Maint / Mgmt
- −$317
- Net cashflow
- $5
Break-even live
UW: 25.0% down · 7.5% · 30yr · 1.5% tax · 5.0% vac · 8.0% maint · 8.0% mgmt
Financing live
Cash to close
- Down payment
- $44,975
- Closing costs
- $5,397
- Reserves months
- —
- Total cash needed
- —
Loan-product check · same deal, 3 products live
Conventional
25% down · 7.5% · 30yr
- Down + closing
- —
- Monthly P&I
- —
- Monthly cashflow
- —
- DSCR
- —
- Eligible?
- —
Personal DTI + credit; lowest rate.
DSCR
20% down · 8.5% · 30yr
- Down + closing
- —
- Monthly P&I
- —
- Monthly cashflow
- —
- DSCR
- —
- Eligible?
- —
No personal income docs; deal must DSCR.
Hard money
10% down · 12.0% · 12mo
- Down + closing
- —
- Monthly P&I
- —
- Monthly cashflow
- —
- DSCR
- —
- Eligible?
- —
Short-term bridge; refi at stabilization.
Listing history 6 events
-
2026-04-28status Pending
-
2026-04-02historical Active Under Contract
-
2026-03-02price $179,900
-
2025-12-05$185,000 Active
-
2025-10-13historical $185,000
-
1988-01-25soldstatus $25,000
ⓘ Source: listings_history table (triggers on properties + properties_extension) + one-shot
backfill from property_details.listing_events for pre-trigger history.
Tax reassessment forecast PA · Partial reset (capped growth)
- Current annual tax
- $2,048 · $171/mo
- Projected year-2 tax
- $2,445 · $204/mo
- Expected delta
- +$397/yr (+$33/mo · 19.4%)
ⓘ Screening estimate from a state-policy table — verify with the county assessor before closing.
Climate risk First Street
- Flood 1/10 Low FEMA zone X (unshaded) · 0% chance over 30 yrs
- Wildfire 4/10 Moderate
- Heat 4/10 Moderate 7 d/yr ≥98°F today · 15 d/yr by 30 yrs out
- Wind 4/10 Moderate 10% chance of damaging wind over 30 yrs
- Air quality 3/10 Moderate 3 unhealthy d/yr today · 4 by 30 yrs out
Nearby sold comps map
Loading sold comps map…
Walkable amenities ~0.75 mi
Loading nearby amenities…
Taxation est. · year 1
- Rental income
- $18,134
- − Mortgage interest
- −$10,077
- − Property taxes
- −$2,048
- − Insurance
- −$900
- − Repairs & maintenance
- −$1,451
- − Management
- −$1,451
- − Depreciation
- −$5,233
- Taxable loss
- −$3,026
- Est. tax savings @ 24.0%
- +$726
- After-tax cash flow
- $783/yr
For passive investors: Depreciation is non-cash, so a rental often shows a tax loss while cash-flowing — sheltering income. Rental losses are passive: they offset passive income freely, and up to $25,000/yr can offset ordinary (W-2) income if you actively participate and your MAGI is under $100k (phasing out to $0 by $150k); unused losses carry forward. On sale, claimed depreciation is recaptured at up to 25%, and gains may owe capital-gains tax (a 1031 exchange can defer both). Figures are a year-1 estimate at your 24.0% rate — not tax advice; consult a CPA.
Schools (NCES district)
- District
- Cornwall-Lebanon SD
- NCES district ID
- 4206840
- Math proficiency
- 37% ▼ -15.00%
- Reading proficiency
- 56% ▼ -15.00%
- Median HH income
- $62,483
- Composite
- 41.0/100
- National rank
- #3589
- State rank
- #219 of 539 in PA
Livability — Cornwall
- Score
- 70/100
- State rank
- #740
- US rank
- #7415
Category grades
Schools grade is shown separately in the Schools card above.
Census & demographics
- Census place
- Cornwall, PA
- County
- Lebanon County · 95,836 people
- City population
- 40,670
- Metro
- Lebanon, PA
- Population (ZIP)
- 40,161
- Household income
- $74,831
- Rent vs Own
- Severe rent burden
- 801.0
Population outlook (Lebanon County) Hauer SSP2
- Today (2025)
- 144,806 people
- By 2030
- 147,534 · +1.9%
- By 2040
- 152,952 · +5.6%
- By 2050
- 159,406 · +10.1%
- By 2075
- 181,736 · +25.5%
- By 2100
- 198,402 · +37.0%
Race, ethnicity, and origin ACS 2023
- Neighborhood character
- Predominantly White (77%)
- Race & ethnicity
- White 77% Hispanic / Latino 16% Two or more races 8% Black 3% Asian 1%
- Hispanic origin (detail)
- Puerto Rican 12% Dominican 1%
- Common ancestry
- Romanian 2% Polish 2% Iranian 1%
- Foreign-born
- 3% · Canada
- Languages at home
- 87% English-only · Spanish 10% German/W. Germanic 1% Other Indo-European 1%
Political lean MEDSL · Lebanon
- 2024 margin
- Solid R (+32.0) · D 33.6% · R 65.5%
- 2008→2024 swing
- -13.1pp toward R · 2008: -18.9pp · 2024: -32.0pp
- All cycles
- 2024: R+32.0 2020: R+31.7 2016: R+35.5 2012: R+28.0 2008: R+18.9
Not yet ingested
- Civics
- —
Market trends
- HPI YoY
- ▼ -124.28%
- Current HPI
- 192.3643
- Rent YoY
- ▲ 3.53%
- Metro
- Lebanon, PA
- State GDP YoY
- ▲ 1.68%
- F500 in state
- 34
Industry mix (Fortune 500 HQ in PA)
| Industry | F500 HQs | Revenue |
|---|---|---|
| Healthcare | 2 | $309B |
|
||
| Insurance | 2 | $27B |
|
||
| Telecommunications / Media | 1 | $124B |
|
||
| Industrial Distribution | 1 | $22B |
|
||
| Financial Services | 1 | $20B |
|
||
| Chemicals / Materials | 1 | $18B |
|
||
Price history
+619.6% since first listed6 events — show timeline
- 2026-04-28 Pending — BRIGHT MLS
- 2026-04-02 Contingent — BRIGHT MLS
- 2026-03-02 Price Changed $179,900 BRIGHT MLS
- 2025-12-05 Listed $185,000 BRIGHT MLS
- 2025-10-13 Coming Soon $185,000 BRIGHT MLS
- 1988-01-25 Sold (Public Records) $25,000 Public Records
Property tax history
+3.5%/yrLatest (2026): $2,048 · +4.1% YoY. Source: county tax records.
Cash-flow waterfall
monthlySold comps — $/sqft
last 12 mo · ≤1 miLoading sold comps…