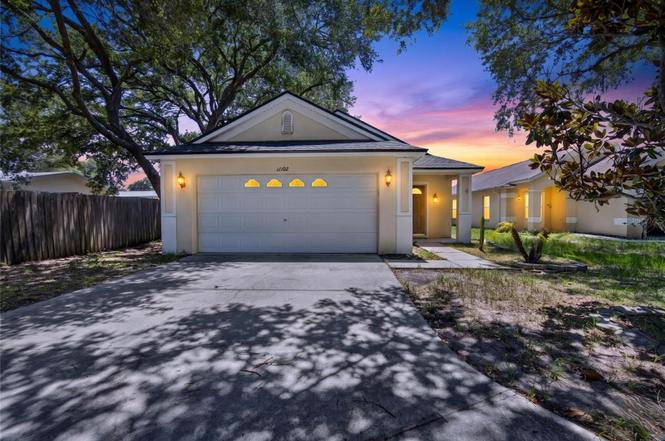
11102 Robin Lake Ct · Riverview, FL
Flood risk 1/10 · Minimal
- FEMA flood zone
- X (unshaded)
- Chance of flooding over 30 yrs
- 0.0%
- Est. flood insurance / yr
- $507 – $1,088
Fire risk 3/10 · Minor
- Est. fire insurance / yr
- $947 – $1,759
Heat risk 10/10 · Severe
- Hot days now (above 109°F)
- 7 days/yr
- Hot days in 30 yrs
- 25 days/yr
Wind risk 9/10 · Severe
- Chance of severe wind over 30 yrs
- 99.0%
Air-quality risk 3/10 · Minor
- Unhealthy air days now
- 3 days/yr
- Unhealthy air days in 30 yrs
- 3 days/yr
Risk factors via First Street. Map © Google.
Why this score? — see what drove the D- grade
The composite is a weighted blend of 9 inputs, each scored 0–100. Each bar is that input's sub-score; the figure is the points it added to the 100-point composite (weight × sub-score).
- Cash flow +11.5/30.0
- ARV discount +7.5/15.0
- Schools +4.2/10.0
- Livability +4.0/5.0
- DSCR +3.4/10.0
- 1% rule +3.0/10.0
- Rent growth +3.0/5.0
- Condition / age +2.5/5.0
- Appreciation +0.0/10.0
$300,000
🖨 Deal sheet 📄 Offer letter ✓ Due diligence
Listing remarks MLS
NO CDD and low HOA Fees on this beautiful, quiet, Cul-De-Sac street makes this home a must see for any buyer. 3 bedroom and 2 bathrooms, this home provides you with a fenced yard and backyard patio area great for entertaining. With lots of wonderful little touches, this quaint home is convenient to lakeside restaurants and I75. Easy commute to Tampa, MacDill, and the area beaches also puts you in the center of a great location. Don’t wait and make an appointment to see this home today - it will not last long!
Key facts
- Quiet cul-de-sac
- Newer roof
- Ac system
Tags
Property features AI
Finance
- Other: Homestead exemption claimed
- HOA & community: HOA managed by Unique Property Services; Quarterly association fee ($100); Monthly HOA equivalent about $33.33; Community features include deed restrictions, park, and playground; Pets allowed
Exterior
- Parking: Attached 2-car garage
- Utilities: Public water; Public sewer; Broadband/high-speed internet available; Cable available
- Home design: Single family residence; One story; Faces south
- Construction: Block construction; Shingle roof; Slab foundation; Built on a 0.15-acre lot
- Exterior features: Sidewalk; Cul-de-sac lot; Paved road access
Interior
- Kitchen: Dishwasher
- Bedrooms: 3 bedrooms
- Flooring: Carpet
- Bathrooms: 2 full bathrooms
- Heating & cooling: Central heating; Central air conditioning
- Interior features: Vaulted ceilings; Walk-in closets; Blinds
- Laundry & utility: Laundry in garage
Neighborhood map
What this means for you Summary
Snapshot
- This is a 3-bed/2.0-bath single-family listed at $300k.
Deal economics
- At list price, monthly cash flow is $-98 ($-1k/yr) — negative.
- To cash-flow at today's rent, offer at most $283k (5.8% below list).
- To meet the 1% rule (rent ≥ 1% of price), the offer needs to be $239k (20.5% below list).
- Recommended offer: $239k (20.5% below list) — sets the bar for 1% rule.
Location & tenants
- Location reads 79/100 on livability (#134 in FL, #2,000 nationally) — a middle-class / working-renter tenant base. Strengths: housing A+, health & safety A+, employment B+; Watch: amenities F.
- Hillsborough (suburban): math 47% / reading 50% proficiency, ranked #41 of 73 in FL (top 56%) — families likely to look elsewhere, expect single-tenant / working-renter base with shorter leases.
- Zoned schools: Riverview High School (math 37% / reading 50%, grade F, #248 of 667 statewide, top 38%, 2,599 students, 46% FRL).
- Market conditions: Rents rising (+2.0%/yr); 228 active listings in the ZIP; 35 comparable units currently listed for rent nearby; rentals at typical pace (median 15d on market — plan ~3-4 weeks tenant-placement turnaround); solid renter incomes; 9,053 units permitted in Hillsborough County in 2024 (4,555 in 5+ unit buildings).
Forward outlook
- Local home prices are declining (-3.0%/yr); year-one equity from $2k of loan paydown is wiped out by about $9k of value loss. Plan a longer hold.
- Hillsborough County population projected at +37% by 2050 — long-run rental-demand tailwind backs the buy-and-hold thesis.
Negotiation context
- Only 8 days on market — expect competitive offers; lowballing is unlikely to land.
- 3 sale attempts since 11y ago with the ask held roughly flat each time — persistent listings suggest the price (not the market) is what's stuck; bring a comps-based counter.
- Current owner paid $178k; list at $300k implies a 69% gain — meaningful room to come down on a strong offer.
Risks & watch-outs
- Climate carrying-cost: severe wind risk, 99% chance of damaging wind over 30y; extreme-heat days projected 7→25/yr by 2055 (HVAC capex compounding) — expect insurance premiums to compound above CPI over the hold.
Questions for the listing agent
- What do current leases actually rent for vs. the listed asking? Can we see a recent rent roll and the last 12 months of T-12 income?
- What does the HOA fee cover, when was the last increase, and are there any pending special assessments or reserve-fund shortfalls?
- Is there a deadline driving the sale (1031 exchange, divorce, estate, relocation)? That informs how much negotiation room exists.
- Schools are B-rated — typically a magnet for longer-tenancy family renters. What's the average tenant stay here, and is there a school-zone premium baked into asking?
- The area grade is low — what's the realistic commute time and amenity access for the typical tenant pool here? Any planned neighborhood developments (good or bad) we should know about?
- What's the average days-on-market for RENTAL listings here right now (not sales)? A rising rental-DOM trend means longer vacancies and softer asking-rent achievability than the comps imply.
- What's the recent tenant-quality profile in this submarket — average credit score on applications, eviction rate, late-payment / NSF rate, and stable-employment percentage? A property-management company in the area should have these aggregated.
- How much new for-sale + rental construction is in the pipeline within 1–3 miles? Heavy new supply typically softens prices + rents 12–24 months out; constrained supply supports both.
Investment metrics
- 1% rule
- 0.80% ✗
- Cap rate
- 5.90%
- Cash-on-cash
- -1.41%
- DSCR
- 0.94
- GRM
- 10.5
CMA / ARV
No comps found within radius.
Projected returns pro-forma
-3.0% appreciation · 2.0% rent growth · sell at horizon
- IRR
- -19.7%
- Equity multiple
- 0.32×
- Total profit
- $-57,282
- Equity at exit
- $44,731
- IRR
- -14.7%
- Equity multiple
- 0.20×
- Total profit
- $-67,595
- Equity at exit
- $25,939
Cash invested: $84,000 (down + closing). Projections, not guarantees.
Landlord ↔ Tenant lean methodology
- Overall (STATE)
- 87 Strongly Landlord-Friendly
- State Florida
- 87 Strongly Landlord-Friendly · R+3
- County
- — inherits STATE
- City
- — inherits STATE
ZIP-level market 33569
- Home prices YoY
- -16.7%
- Rents YoY
- 2.0%
- Active inventory
- 228
- Price-to-rent
- 10.5×
Monthly cashflow live
- Estimated rent
- $2,386 high interval (Pro) →
- Mortgage (P&I)
- −$1,573
- Tax from tax record
- −$252 /mo · $3,025/yr
- Insurance
- −$125
- HOA
- −$33
- Vacancy / Maint / Mgmt
- −$501
- Net cashflow
- $-98
Break-even live
UW: 25.0% down · 7.5% · 30yr · 1.5% tax · 5.0% vac · 8.0% maint · 8.0% mgmt
Financing live
Cash to close
- Down payment
- $75,000
- Closing costs
- $9,000
- Reserves months
- —
- Total cash needed
- —
Loan-product check · same deal, 3 products live
Conventional
25% down · 7.5% · 30yr
- Down + closing
- —
- Monthly P&I
- —
- Monthly cashflow
- —
- DSCR
- —
- Eligible?
- —
Personal DTI + credit; lowest rate.
DSCR
20% down · 8.5% · 30yr
- Down + closing
- —
- Monthly P&I
- —
- Monthly cashflow
- —
- DSCR
- —
- Eligible?
- —
No personal income docs; deal must DSCR.
Hard money
10% down · 12.0% · 12mo
- Down + closing
- —
- Monthly P&I
- —
- Monthly cashflow
- —
- DSCR
- —
- Eligible?
- —
Short-term bridge; refi at stabilization.
Rent comps 35 comps
| Address | Beds | Baths | Sqft | Rent | $/sqft | DOM | Units | Dist |
|---|---|---|---|---|---|---|---|---|
| 11106 Havasu Ct Riverview, FL | 4.0 | 2.0 | 1343 | $2,100 | $1.56 | 24d | 1 | 0.07mi |
| 10310 Lakeside Vista Dr Riverview, FL | 4.0 | 2.0 | 1462 | $2,099 | $1.44 | 4d | 1 | 0.21mi |
| 11351 Coconut Island Dr Riverview, FL | 3.0 | 2.0 | 1519 | $2,015 | $1.33 | 4d | 1 | 0.44mi |
| 10611 Summer Azure Dr Riverview, FL | 4.0 | 2.5 | 1805 | $2,390 | $1.32 | 13d | 1 | 0.70mi |
| 11573 Hammocks Glade Dr Riverview, FL | 3.0 | 2.0 | 1430 | $2,765 | $1.93 | 12d | 1 | 0.72mi |
| 10918 Winter Crest Dr Riverview, FL | 2.0 | 2.0 | 1340 | $1,800 | $1.34 | 4d | 1 | 0.76mi |
| 11415 Mountain Bay Dr Riverview, FL | 4.0 | 2.0 | 1504 | $2,400 | $1.60 | 17d | 1 | 0.78mi |
| 10243 Allenwood Dr Riverview, FL | 3.0 | 2.0 | 1454 | $2,195 | $1.51 | 4d | 1 | 0.84mi |
| 10631 Sweet Sapling St Riverview, FL | 3.0 | 2.0 | 1461 | $2,224 | $1.52 | 24d | 1 | 0.86mi |
| 10621 Sweet Sapling St Riverview, FL | 3.0 | 2.0 | 1461 | $2,224 | $1.52 | 24d | 1 | 0.88mi |
| 11855 Mountain Retreat Ln Riverview, FL | 3.0 | 2.5 | 1673 | $2,399 | $1.43 | 12d | 1 | 0.89mi |
| 10615 Sweet Sapling St Riverview, FL | 3.0 | 2.0 | 1461 | $2,224 | $1.52 | 24d | 1 | 0.90mi |
| 10210 Falcon Gate Loop Riverview, FL | 1.0–2.0 | 1.0–2.0 | 902 | $2,090 | $2.32 | 1d | 41 | 0.90mi |
| 11888 Mountain Retreat Ln Riverview, FL | 3.0 | 2.5 | 1673 | $2,299 | $1.37 | 20d | 1 | 0.92mi |
| 11904 Stoneport Pl Riverview, FL | 3.0 | 2.5 | 1673 | $2,399 | $1.43 | 12d | 1 | 0.93mi |
| 10114 Allenwood Dr Riverview, FL | 3.0 | 2.5 | 1383 | $2,190 | $1.58 | 14d | 1 | 0.96mi |
| 11316 Maybrook Ave Riverview, FL | 3.0 | 2.0 | 1454 | $2,395 | $1.65 | 23d | 1 | 0.98mi |
| 11991 Stoneport Pl Riverview, FL | 3.0 | 2.5 | 1758 | $2,699 | $1.54 | 12d | 1 | 1.02mi |
| 11821 Stone Pine St Riverview, FL | 3.0 | 2.0 | 1492 | $2,190 | $1.47 | 24d | 1 | 1.02mi |
| 11815 Stone Pine St Riverview, FL | 3.0 | 2.0 | 1492 | $2,450 | $1.64 | 4d | 1 | 1.02mi |
| 10410 Fairy Moss Ln Riverview, FL | 4.0 | 2.0 | 1817 | $2,299 | $1.27 | 17d | 1 | 1.14mi |
| 11424 Sage Canyon Dr Riverview, FL | 3.0 | 2.0 | 1461 | $2,300 | $1.57 | 24d | 1 | 1.18mi |
| 10619 Sage Canyon Dr Riverview, FL | 4.0 | 2.5 | 1742 | $2,350 | $1.35 | 17d | 1 | 1.20mi |
| 11436 Ivy Flower Loop Riverview, FL | 3.0 | 2.0 | 1341 | $2,170 | $1.62 | 4d | 1 | 1.22mi |
| 11702 Miracle Mile Dr Riverview, FL | 3.0 | 2.0 | 1405 | $2,105 | $1.50 | 4d | 1 | 1.24mi |
| 10976 Verawood Dr Unit Lake Riverview, FL | 3.0 | 2.5 | 1536 | $2,149 | $1.40 | 4d | 1 | 1.26mi |
| 10976 Verawood Dr Riverview, FL | 3.0 | 2.5 | 1536 | $2,149 | $1.40 | 14d | 1 | 1.26mi |
| 10115 Newel Valley Loop Riverview, FL | 3.0 | 2.5 | 1716 | $2,275 | $1.33 | 17d | 1 | 1.26mi |
| 10540 Whispering Hammock Dr Riverview, FL | 3.0 | 2.0 | 1535 | $2,180 | $1.42 | 2d | 1 | 1.28mi |
| 10710 Verawood Dr Riverview, FL | 3.0 | 2.5 | 1818 | $1,300 | $0.72 | 14d | 1 | 1.31mi |
| 10231 Opaline Sky Pl Riverview, FL | 3.0 | 2.0 | 1496 | $2,400 | $1.60 | 17d | 1 | 1.32mi |
| 10903 Verawood Dr Riverview, FL | 3.0 | 2.5 | 1536 | $2,000 | $1.30 | 20d | 1 | 1.35mi |
| 10965 Quickwater Ct Riverview, FL | 3.0 | 2.5 | 1679 | $2,480 | $1.48 | 24d | 1 | 1.40mi |
| 11313 Andy Dr Riverview, FL | 3.0 | 2.0 | 1811 | $2,750 | $1.52 | 24d | 1 | 1.41mi |
| 12214 Legacy Bright St Riverview, FL | 3.0 | 2.0 | 1844 | $2,400 | $1.30 | 24d | 1 | 1.46mi |
HOA detail
- Monthly dues
- $33 · $396/yr
Listing history 7 events
-
2026-06-18days on market $300,000 Active 8 DOM
-
2026-06-17days on market $300,000 Active 7 DOM
-
2026-06-16days on market $300,000 Active 6 DOM
-
2026-06-15days on market $300,000 Active 5 DOM
-
2026-06-13days on market $300,000 Active 3 DOM
-
2026-06-13remarks 699-char remark
-
2026-06-13$300,000 Active 2 DOM
ⓘ Source: listings_history table (triggers on properties + properties_extension) + one-shot
backfill from property_details.listing_events for pre-trigger history.
Tax reassessment forecast FL · Resets to sale price
- Current annual tax
- $3,025 · $252/mo
- Projected year-2 tax
- $3,025 · $252/mo
- Expected delta
- $0/yr ($0/mo · 0.0%)
ⓘ Screening estimate from a state-policy table — verify with the county assessor before closing.
Climate risk First Street
- Flood 1/10 Low FEMA zone X (unshaded) · 0% chance over 30 yrs
- Wildfire 3/10 Moderate
- Heat 10/10 Extreme 7 d/yr ≥109°F today · 25 d/yr by 30 yrs out
- Wind 9/10 Extreme 99% chance of damaging wind over 30 yrs
- Air quality 3/10 Moderate 3 unhealthy d/yr today · 3 by 30 yrs out
Nearby sold comps map
Loading sold comps map…
Walkable amenities ~0.75 mi
Loading nearby amenities…
Taxation est. · year 1
- Rental income
- $28,630
- − Mortgage interest
- −$16,805
- − Property taxes
- −$3,025
- − Insurance
- −$1,500
- − Repairs & maintenance
- −$2,290
- − Management
- −$2,290
- − HOA
- −$396
- − Depreciation
- −$8,727
- Taxable loss
- −$6,404
- Est. tax savings @ 24.0%
- +$1,537
- After-tax cash flow
- $355/yr
For passive investors: Depreciation is non-cash, so a rental often shows a tax loss while cash-flowing — sheltering income. Rental losses are passive: they offset passive income freely, and up to $25,000/yr can offset ordinary (W-2) income if you actively participate and your MAGI is under $100k (phasing out to $0 by $150k); unused losses carry forward. On sale, claimed depreciation is recaptured at up to 25%, and gains may owe capital-gains tax (a 1031 exchange can defer both). Figures are a year-1 estimate at your 24.0% rate — not tax advice; consult a CPA.
Schools (NCES district)
- District
- Hillsborough
- NCES district ID
- 1200870
- Math proficiency
- 47% ▼ -8.00%
- Reading proficiency
- 50% ▼ -4.00%
- Median HH income
- $50,622
- Composite
- 41.6/100
- National rank
- #3435
- State rank
- #41 of 73 in FL
Livability — Riverview
- Score
- 79/100
- State rank
- #134
- US rank
- #2000
Category grades
Schools grade is shown separately in the Schools card above.
Census & demographics
- Census place
- Riverview, FL
- County
- Hillsborough County · 1,540,968 people
- City population
- 137,988
- Metro
- Tampa-St. Petersburg-Clearwater, FL
- Population (ZIP)
- 27,867
- Household income
- $105,275
- Rent vs Own
- Severe rent burden
- 562.0
Population outlook (Hillsborough County) Hauer SSP2
- Today (2025)
- 1,607,022 people
- By 2030
- 1,733,968 · +7.9%
- By 2040
- 1,979,565 · +23.2%
- By 2050
- 2,203,427 · +37.1%
- By 2075
- 2,667,893 · +66.0%
- By 2100
- 2,891,558 · +79.9%
Race, ethnicity, and origin ACS 2023
- Neighborhood character
- Diverse neighborhood (Simpson 0.60)
- Race & ethnicity
- White 58% Hispanic / Latino 21% Black 12% Two or more races 11% Asian 5%
- Hispanic origin (detail)
- Mexican 3% Puerto Rican 5% Cuban 5% Dominican 3%
- Common ancestry
- Romanian 2% Iranian 1% Lithuanian 1%
- Foreign-born
- 15% · Canada, Jamaica
- Languages at home
- 78% English-only · Spanish 14% Other Indo-European 3% Other Asian/Pacific 1%
Political lean MEDSL · Hillsborough
- 2024 margin
- Toss-up / Even · D 47.8% · R 50.9% · Other 1.3%
- 2008→2024 swing
- -10.2pp toward R · 2008: 7.1pp · 2024: -3.1pp
- All cycles
- 2024: R+3.1 2020: D+6.9 2016: D+6.8 2012: D+6.7 2008: D+7.1
Not yet ingested
- Civics
- —
Market trends
- HPI YoY
- ▼ -59.47%
- Current HPI
- 296.9169
- Rent YoY
- ▲ 2.00%
- Metro
- Tampa-St. Petersburg-Clearwater, FL
- State GDP YoY
- ▲ 3.28%
- F500 in state
- 36
Industry mix (Fortune 500 HQ in FL)
| Industry | F500 HQs | Revenue |
|---|---|---|
| Industrial Technology | 2 | $29B |
|
||
| Insurance | 2 | $17B |
|
||
| Retail | 1 | $60B |
|
||
| Technology Distribution | 1 | $58B |
|
||
| Homebuilding | 1 | $35B |
|
||
| Technology Manufacturing | 1 | $35B |
|
||
Price history
+100.0% since first listed12 events — show timeline
- 2026-06-10 Listed $300,000 Stellar MLS as Distributed by MLS Grid
- 2018-04-23 Sold (Public Records) $178,000 Public Records
- 2018-04-20 Sold (MLS) $178,000 Stellar MLS as Distributed by MLS Grid
- 2018-04-14 Pending — Stellar MLS as Distributed by MLS Grid
- 2018-03-23 Pending — Stellar MLS as Distributed by MLS Grid
- 2018-03-19 Listed $174,900 Stellar MLS as Distributed by MLS Grid
- 2015-07-31 Sold (Public Records) $143,000 Public Records
- 2015-07-24 Sold (MLS) $143,000 Stellar MLS as Distributed by MLS Grid
- 2015-06-24 Pending — Stellar MLS as Distributed by MLS Grid
- 2015-06-21 Listing Removed — Stellar MLS as Distributed by MLS Grid
- 2015-06-11 Pending — Stellar MLS as Distributed by MLS Grid
- 2015-06-03 Listed $150,000 Stellar MLS as Distributed by MLS Grid
Property tax history
+6.7%/yrLatest (2025): $3,025 · +8.0% YoY. Source: county tax records.
Cash-flow waterfall
monthlySold comps — $/sqft
last 12 mo · ≤1 miLoading sold comps…