150 W 51st St #1126 · New York, NY
Flood risk No data
- FEMA flood zone
- —
- Chance of flooding over 30 yrs
- —
- Est. flood insurance / yr
- —
Fire risk No data
- Est. fire insurance / yr
- —
Heat risk No data
- Hot days now (above threshold)
- —
- Hot days in 30 yrs
- —
Wind risk No data
- Chance of severe wind over 30 yrs
- —
Air-quality risk No data
- Unhealthy air days now
- —
- Unhealthy air days in 30 yrs
- —
Risk factors via First Street. Map © Google.
Why this score? — see what drove the D grade
The composite is a weighted blend of 9 inputs, each scored 0–100. Each bar is that input's sub-score; the figure is the points it added to the 100-point composite (weight × sub-score).
- ARV discount +7.5/15.0
- Cash flow +7.1/30.0
- Appreciation +6.8/10.0
- Schools +5.0/10.0
- 1% rule +3.8/10.0
- Livability +3.8/5.0
- Condition / age +3.8/5.0
- Rent growth +3.6/5.0
- DSCR +1.3/10.0
$649,000
🖨 Deal sheet 📄 Offer letter ✓ Due diligence
Listing remarks
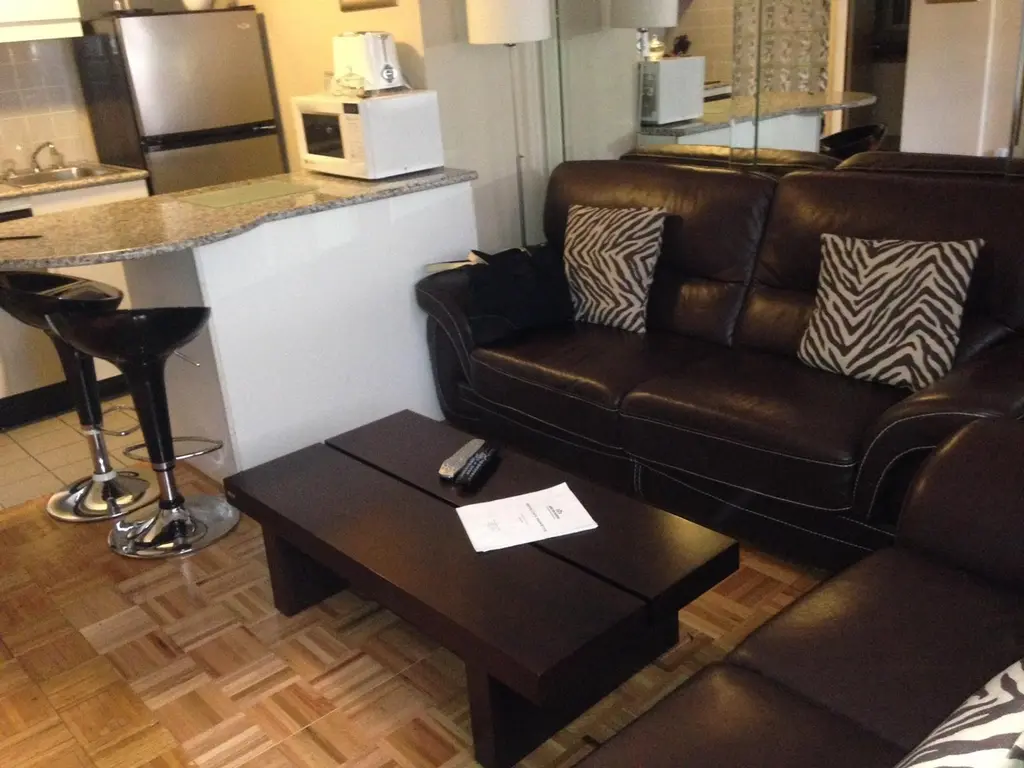
Exceptional one bedroom apartment in iconic Executive Plaza. Enjoy life in the heart of midtown Manhattan just one block from Rockefeller Center and adjacent to the Theater District. Executive Plaza features 24 hour doorman, fitness center, roof deck, laundry and dry cleaner. Outstanding Pied a terre opportunity. Enjoy a true Manhattan lifestyle!!
Key facts
- Fitness center
- Dry cleaner
- Roof deck
Tags
Property features AI
Finance
- Other: Elevator in building; Pets not allowed in building
- HOA & community: Monthly association fee of $965
Exterior
- Home design: 20-story building
- Exterior features: Building storage; Building roof deck; North exposure; Entry on 11th level
Interior
- Bathrooms: One full bathroom
- Interior features: Has a view; Total of 2 rooms
- Laundry & utility: Common area laundry
Neighborhood map
What this means for you Summary
Snapshot
- This is a 1-bed/1.0-bath single-family listed at $649k. Condition is rated good.
Deal economics
- At list price, monthly cash flow is $-916 ($-11k/yr) — negative.
- To cash-flow at today's rent, offer at most $516k (20.4% below list).
- To meet the 1% rule (rent ≥ 1% of price), the offer needs to be $574k (11.6% below list).
- Recommended offer: $516k (20.4% below list) — sets the bar for cash-flow.
- Cap rate 4.6% vs local median 2.6% in New York — top-decile yield for the area; either an underpriced asset or a hidden risk that comps aren't pricing in. Stress-test before assuming the spread holds.
Location & tenants
- Location reads 75/100 on livability (#268 in NY, #4,188 nationally) — a middle-class / working-renter tenant base. Strengths: amenities A+, commute A+, health & safety A; Watch: crime F, cost of living F.
- Market conditions: Rents rising fast (+4.2%/yr); 538 active listings in the ZIP; 40 comparable units currently listed for rent nearby; rentals leasing fast (median 8d on market — plan ~1-2 weeks tenant-placement turnaround); high-income renter base; 4,467 units permitted in New York County in 2024 (4,463 in 5+ unit buildings).
- At $5,740/mo this rent would consume 54% of the median local household income ($129k/yr) (locally 3795% of renters already pay >50% of income on rent) — very limited rent-growth headroom before tenants either downsize or default.
Forward outlook
- In year one you build about $28k of equity ($4k loan paydown + $23k appreciation (3.6% local appreciation)).
- New York County population projected at +21% by 2050 — long-run rental-demand tailwind backs the buy-and-hold thesis.
- By year 2, paydown + projected appreciation supports a ~$45k cash-out refi (75% LTV) — recoverable capital for the next deal without selling this one.
Negotiation context
- It's been on market 86 days — a 6% lower offer ($610k) is reasonable based on typical stale-listing flexibility.
- 2 sale attempts with the ask held roughly flat each time — persistent listings suggest the price (not the market) is what's stuck; bring a comps-based counter.
Risks & watch-outs
- Watch-outs: built in 1926 — expect roof / HVAC / electrical / plumbing capex.
Questions for the listing agent
- What do current leases actually rent for vs. the listed asking? Can we see a recent rent roll and the last 12 months of T-12 income?
- It's been on market 86 days. Have you received any prior offers? Is the seller open to a 20% concession, seller financing, or rate buy-down credit?
- Built in 1926 — when were the roof, HVAC, electrical panel, plumbing, and water heater last replaced?
- What does the HOA fee cover, when was the last increase, and are there any pending special assessments or reserve-fund shortfalls?
- Why hasn't it sold? Are there any deal-killer items the seller is aware of (foundation, flood, title, zoning, code violations)?
- Is there a deadline driving the sale (1031 exchange, divorce, estate, relocation)? That informs how much negotiation room exists.
- Schools are B-rated — typically a magnet for longer-tenancy family renters. What's the average tenant stay here, and is there a school-zone premium baked into asking?
- Crime grade is F in this area — have there been break-ins, vandalism, or insurance claims at this property in the last 3 years? What carrier currently insures it and at what premium?
- The area grade is low — what's the realistic commute time and amenity access for the typical tenant pool here? Any planned neighborhood developments (good or bad) we should know about?
- What's the average days-on-market for RENTAL listings here right now (not sales)? A rising rental-DOM trend means longer vacancies and softer asking-rent achievability than the comps imply.
- What's the recent tenant-quality profile in this submarket — average credit score on applications, eviction rate, late-payment / NSF rate, and stable-employment percentage? A property-management company in the area should have these aggregated.
- How much new for-sale + rental construction is in the pipeline within 1–3 miles? Heavy new supply typically softens prices + rents 12–24 months out; constrained supply supports both.
Investment metrics
- 1% rule
- 0.88% ✗
- Cap rate
- 4.60%
- Cash-on-cash
- -6.05%
- DSCR
- 0.73
- GRM
- 9.4
CMA / ARV
No comps found within radius.
Projected returns pro-forma
3.61% appreciation · 4.25% rent growth · sell at horizon
- IRR
- 4.5%
- Equity multiple
- 1.27×
- Total profit
- $48,951
- Equity at exit
- $314,277
- IRR
- 8.1%
- Equity multiple
- 2.34×
- Total profit
- $242,677
- Equity at exit
- $502,575
Cash invested: $181,720 (down + closing). Projections, not guarantees.
Landlord ↔ Tenant lean methodology
- Overall (CITY)
- 0 Strongly Tenant-Friendly
- State New York
- 15 Strongly Tenant-Friendly · D+10
- County
- — inherits STATE
- City New York
- 0 Strongly Tenant-Friendly · D+34
ZIP-level market 10019
- Home prices YoY
- 1.5%
- Rents YoY
- 4.2%
- Active inventory
- 538
- Price-to-rent
- 9.4×
Monthly cashflow live
- Estimated rent
- $5,740 high interval (Pro) →
- Mortgage (P&I)
- −$3,403
- Tax est. 1.5%
- −$811 /mo · $9,735/yr
- Insurance
- −$270
- HOA
- −$965
- Vacancy / Maint / Mgmt
- −$1,205
- Net cashflow
- $-916
Break-even live
UW: 25.0% down · 7.5% · 30yr · 1.5% tax · 5.0% vac · 8.0% maint · 8.0% mgmt
Financing live
Cash to close
- Down payment
- $162,250
- Closing costs
- $19,470
- Reserves months
- —
- Total cash needed
- —
Loan-product check · same deal, 3 products live
Conventional
25% down · 7.5% · 30yr
- Down + closing
- —
- Monthly P&I
- —
- Monthly cashflow
- —
- DSCR
- —
- Eligible?
- —
Personal DTI + credit; lowest rate.
DSCR
20% down · 8.5% · 30yr
- Down + closing
- —
- Monthly P&I
- —
- Monthly cashflow
- —
- DSCR
- —
- Eligible?
- —
No personal income docs; deal must DSCR.
Hard money
10% down · 12.0% · 12mo
- Down + closing
- —
- Monthly P&I
- —
- Monthly cashflow
- —
- DSCR
- —
- Eligible?
- —
Short-term bridge; refi at stabilization.
Rent comps 40 comps
| Address | Beds | Baths | Sqft | Rent | $/sqft | DOM | Units | Dist |
|---|---|---|---|---|---|---|---|---|
| 18 W 48th St Unit 670 New York, NY | 1.0 | 1.0 | 631 | $7,730 | $12.25 | 7d | 1 | 0.17mi |
| 15 W 55th St #736 New York, NY | 2.0–3.0 | 1.0–2.0 | 1250 | $8,550 | $6.84 | 1d | 2 | 0.20mi |
| 77 W 55th St Unit 15H New York, NY | 1.0 | 1.0 | 750 | $4,900 | $6.53 | 21d | 1 | 0.21mi |
| 70 W 45th St #1131 New York, NY | 1.0–2.0 | 1.0–2.0 | 902 | $5,990 | $6.64 | 7d | 2 | 0.34mi |
| 123 E 54th St #1251 New York, NY | 1.0–2.0 | 1.0 | 600 | $5,210 | $8.68 | 1d | 2 | 0.36mi |
| 235 W 48th St #1400 New York, NY | 2.0 | 1.0–2.0 | 687 | $6,270 | $9.12 | 7d | 3 | 0.42mi |
| 254 W 54th St Unit 1026635P New York, NY | 1.0–2.0 | 1.0–2.0 | 860 | $8,040 | $9.34 | 7d | 2 | 0.43mi |
| 160 Central Park S New York, NY | 1.0–3.0 | 1.0–3.5 | 1550 | $9,250 | $5.97 | 7d | 9 | 0.43mi |
| 160 Central Park S New York, NY | 1.0–3.0 | 1.0–3.5 | 1550 | $7,500 | $4.84 | 7d | 10 | 0.43mi |
| 250 W 50th St New York, NY | 2.0 | 1.0–2.0 | 784 | $5,866 | $7.48 | 7d | 1 | 0.43mi |
| 117 E 57th St New York, NY | 1.0 | 1.0 | 732 | $5,975 | $8.16 | 4d | 2 | 0.44mi |
| 135 E 47th St New York, NY | 1.0 | 1.0 | 572 | $6,600 | $11.53 | 6d | 1 | 0.45mi |
| 135 E 47th St Unit 22F New York, NY | 1.0 | 1.0 | 700 | $7,500 | $10.71 | 21d | 1 | 0.47mi |
| 160 E 48th St New York, NY | 3.0 | 1.0–2.0 | 878 | $6,993 | $7.96 | 3d | 9 | 0.48mi |
| 150 E 57th St New York, NY | 5.0 | 1.0–7.5 | 2750 | $10,504 | $3.82 | 1d | 5 | 0.49mi |
| 311 W 50th St #228 New York, NY | 2.0 | 1.0–2.0 | 669 | $6,470 | $9.67 | 7d | 3 | 0.51mi |
| 220 E 49th St Unit 1021974P New York, NY | 2.0 | 1.0 | 742 | $5,190 | $6.99 | 14d | 1 | 0.54mi |
| 235 E 55th St Unit 36B New York, NY | 1.0 | 1.0 | 650 | $4,800 | $7.38 | 24d | 1 | 0.59mi |
| 754 9th Ave Unit 1017471P New York, NY | 1.0 | 1.0 | 538 | $7,284 | $13.54 | 7d | 1 | 0.60mi |
| 300 E 51st St New York, NY | 2.0 | 1.0–2.0 | 875 | $6,365 | $7.27 | 2d | 3 | 0.63mi |
| 301 E 47th St #1737 New York, NY | 2.0 | 1.0 | 600 | $5,380 | $8.97 | 20d | 1 | 0.66mi |
| 227 E 59th St #635 New York, NY | 2.0 | 1.0 | 500 | $6,240 | $12.48 | 16d | 2 | 0.67mi |
| 230 E 44th St #2165 New York, NY | 1.0–2.0 | 1.0 | 568 | $3,150 | $5.54 | 24d | 2 | 0.67mi |
| 151 E 62nd St Unit 1021834P New York, NY | 1.0 | 1.0 | 398 | $6,812 | $17.12 | 7d | 1 | 0.68mi |
| 149 E 62nd St Unit 1021871P New York, NY | — | 1.0 | 398 | $5,344 | $13.43 | 7d | 1 | 0.68mi |
| 149 E 62nd St Unit 1021838P New York, NY | — | 1.0 | 398 | $4,518 | $11.35 | 2d | 1 | 0.68mi |
| 340 E 51st St New York, NY | 2.0 | 1.0–2.0 | 791 | $6,250 | $7.90 | 3d | 3 | 0.69mi |
| 300 E 46th St New York, NY | 2.0–3.0 | 1.0 | 716 | $4,300 | $6.00 | 24d | 2 | 0.69mi |
| 333 E 52nd St Unit 2177 New York, NY | 2.0 | 1.0 | 600 | $4,900 | $8.17 | 21d | 1 | 0.69mi |
| 340 E 52nd St #1527 New York, NY | 1.0 | 1.0 | 575 | $8,080 | $14.05 | 1d | 2 | 0.70mi |
| 959 1st Ave Unit 6X New York, NY | 1.0 | 1.0 | 739 | $6,000 | $8.12 | 24d | 1 | 0.74mi |
| 330 E 46th St #1794 New York, NY | 1.0 | 1.0 | 489 | $4,990 | $10.19 | 24d | 2 | 0.75mi |
| 252 E 61st St #638 New York, NY | 1.0 | 1.0 | 666 | $5,530 | $8.30 | 1d | 2 | 0.75mi |
| 329 E 58th St #807 New York, NY | 2.0 | 1.0 | 650 | $5,860 | $9.02 | 7d | 1 | 0.76mi |
| 940 1st Ave Unit 2040 New York, NY | 2.0 | 1.5 | 600 | $7,500 | $12.50 | 1d | 1 | 0.76mi |
| 138 E 38th St New York, NY | 3.0 | 1.0–2.0 | 750 | $4,510 | $6.01 | 24d | 4 | 0.78mi |
| 41 Park Ave New York, NY | 2.0 | 1.0–2.0 | 815 | $6,555 | $8.04 | 7d | 3 | 0.80mi |
| 225 E 63rd St #1675 New York, NY | 1.0 | 1.0 | 627 | $5,230 | $8.34 | 24d | 2 | 0.81mi |
| 400 E 57th St #2106 New York, NY | 2.0 | 1.0–2.0 | 903 | $6,610 | $7.32 | 3d | 3 | 0.81mi |
| 420 E 54th St New York, NY | 3.0 | 1.0–2.5 | 1104 | $7,261 | $6.57 | 1d | 14 | 0.82mi |
HOA detail
- Monthly dues
- $965 · $11,580/yr
- Likely covers
- gymdoorman
Listing history 14 events
-
2026-06-18days on market $649,000 Active 86 DOM
-
2026-06-17days on market $649,000 Active 85 DOM
-
2026-06-15days on market $649,000 Active 83 DOM
-
2026-06-13days on market $649,000 Active 81 DOM
-
2026-06-10days on market $649,000 Active 77 DOM
-
2026-06-08days on market $649,000 Active 76 DOM
-
2026-06-08pricedays on market $649,000 Active 75 DOM
-
2026-06-04days on market $670,000 Active 72 DOM
-
2026-06-03days on market $670,000 Active 71 DOM
-
2026-06-01days on market $670,000 Active 69 DOM
-
2026-05-31days on market $670,000 Active 68 DOM
-
2026-05-07status Active
-
2026-03-18$670,000 Active
-
2024-07-08price $690,000
ⓘ Source: listings_history table (triggers on properties + properties_extension) + one-shot
backfill from property_details.listing_events for pre-trigger history.
Nearby sold comps map
Loading sold comps map…
Walkable amenities ~0.75 mi
Loading nearby amenities…
Taxation est. · year 1
- Rental income
- $68,875
- − Mortgage interest
- −$36,354
- − Property taxes
- −$9,735
- − Insurance
- −$3,245
- − Repairs & maintenance
- −$5,510
- − Management
- −$5,510
- − HOA
- −$11,580
- − Depreciation
- −$18,880
- Taxable loss
- −$21,939
- Est. tax savings @ 24.0%
- +$5,265
- After-tax cash flow
- $-5,725/yr
For passive investors: Depreciation is non-cash, so a rental often shows a tax loss while cash-flowing — sheltering income. Rental losses are passive: they offset passive income freely, and up to $25,000/yr can offset ordinary (W-2) income if you actively participate and your MAGI is under $100k (phasing out to $0 by $150k); unused losses carry forward. On sale, claimed depreciation is recaptured at up to 25%, and gains may owe capital-gains tax (a 1031 exchange can defer both). Figures are a year-1 estimate at your 24.0% rate — not tax advice; consult a CPA.
Condition & rehab AI · 8 photos
This one-bedroom apartment in Executive Plaza is in good condition with minimal repairs needed. A fresh coat of paint and some minor updates can significantly enhance its value.
Value-add opportunities
- Both Paint the interior walls — Fresh paint enhances curb appeal and interior aesthetics
- Both Replace the kitchen faucet — A new faucet can improve functionality and appearance
- Both Install new window treatments — New curtains or blinds can improve privacy and aesthetics
Renovation cost estimate screening
Value-add ROI direction
- Both Paint the interior walls — Fresh paint enhances curb appeal and interior aesthetics ↑
- Both Replace the kitchen faucet — A new faucet can improve functionality and appearance ↑
- Both Install new window treatments — New curtains or blinds can improve privacy and aesthetics ↑
ⓘ Cost ranges are severity-bucket heuristics (US national rule-of-thumb). Get contractor quotes + a written scope before underwriting a rehab budget.
Schools (NCES district)
No district data.
Livability — New York
- Score
- 75/100
- State rank
- #268
- US rank
- #4188
Category grades
Schools grade is shown separately in the Schools card above.
Census & demographics
- Census place
- New York, NY
- County
- New York County · 1,599,927 people
- City population
- 7,731,280
- Metro
- New York-Newark-Jersey City, NY-NJ-PA
- Population (ZIP)
- 44,942
- Household income
- $128,559
- Rent vs Own
- Severe rent burden
- 3795.0
Population outlook (New York County) Hauer SSP2
- Today (2025)
- 1,825,725 people
- By 2030
- 1,904,611 · +4.3%
- By 2040
- 2,052,719 · +12.4%
- By 2050
- 2,206,601 · +20.9%
- By 2075
- 2,509,427 · +37.4%
- By 2100
- 2,702,933 · +48.0%
Race, ethnicity, and origin ACS 2023
- Neighborhood character
- Diverse neighborhood (Simpson 0.63)
- Race & ethnicity
- White 55% Asian 18% Hispanic / Latino 17% Two or more races 10% Black 5%
- Hispanic origin (detail)
- Mexican 2% Puerto Rican 3% Dominican 4%
- Common ancestry
- Romanian 4% Lithuanian 4% Scotch-Irish 4%
- Foreign-born
- 34% · Canada, China, South Korea
- Languages at home
- 66% English-only · Spanish 12% Other Indo-European 6% Chinese 5%
Political lean MEDSL · New York
- 2024 margin
- Solid D (+64.8) · D 82.4% · R 17.6%
- 2008→2024 swing
- -7.4pp toward R · 2008: 72.2pp · 2024: 64.8pp
- All cycles
- 2024: D+64.8 2020: D+74.5 2016: D+77.2 2012: D+69.6 2008: D+72.2
Not yet ingested
- Civics
- —
Market trends
- HPI YoY
- ▲ 3.61%
- Current HPI
- 245.1226
- Rent YoY
- ▲ 4.25%
- Metro
- New York-Newark-Jersey City, NY-NJ-PA
- State GDP YoY
- ▲ 2.60%
- F500 in state
- 92
Industry mix (Fortune 500 HQ in NY)
| Industry | F500 HQs | Revenue |
|---|---|---|
| Financial Services | 10 | $950B |
|
||
| Consumer Goods | 9 | $162B |
|
||
| Insurance | 4 | $225B |
|
||
| Telecommunications | 2 | $144B |
|
||
| Pharmaceuticals | 2 | $112B |
|
||
| Media / Entertainment | 2 | $69B |
|
||
Price history
-2.9% since first listed3 events — show timeline
- 2026-05-07 Relisted — RLS at REBNY
- 2026-03-18 Listed $670,000 RLS at REBNY
- 2024-07-08 Price Changed $690,000 RLS at REBNY
Cash-flow waterfall
monthlySold comps — $/sqft
last 12 mo · ≤1 miLoading sold comps…