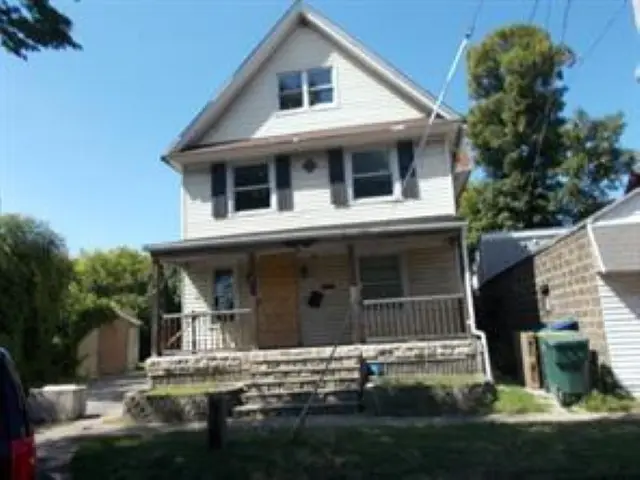
1 Denning St · Rochester, NY
Flood risk 1/10 · Minimal
- FEMA flood zone
- X (unshaded)
- Chance of flooding over 30 yrs
- 0.0%
- Est. flood insurance / yr
- $473 – $860
Fire risk 1/10 · Minimal
- Est. fire insurance / yr
- $691 – $1,283
Heat risk 2/10 · Minimal
- Hot days now (above 96°F)
- 7 days/yr
- Hot days in 30 yrs
- 15 days/yr
Wind risk 1/10 · Minimal
- Chance of severe wind over 30 yrs
- —
Air-quality risk 2/10 · Minimal
- Unhealthy air days now
- 1 days/yr
- Unhealthy air days in 30 yrs
- 1 days/yr
Risk factors via First Street. Map © Google.
Why this score? — see what drove the B+ grade
The composite is a weighted blend of 9 inputs, each scored 0–100. Each bar is that input's sub-score; the figure is the points it added to the 100-point composite (weight × sub-score).
- Cash flow +30.0/30.0
- ARV discount +15.0/15.0
- DSCR +10.0/10.0
- 1% rule +9.0/10.0
- Livability +3.8/5.0
- Rent growth +3.7/5.0
- Condition / age +2.5/5.0
- Schools +1.9/10.0
- Appreciation +0.0/10.0
$150,100
🖨 Deal sheet 📄 Offer letter ✓ Due diligence
Listing remarks MLS
Sale subject to approval by seller's lender as a short sale. Property is being sold in "as-is" condition. Needs re-hab. Estate will not pay for instrument survey, abstract, or transfer fees.
Key facts
- Office
- Large dining room
- Lots of storage
Tags
Property features AI
Exterior
- Parking: No garage
- Utilities: Public water connected; Sewer connected
- Home design: Two-story building; Resale property; Corner, irregular lot; lot dimensions approximately 34 x 111
- Construction: Aluminum siding; Vinyl siding; See remarks regarding construction details
- Exterior features: See remarks
Interior
- Kitchen: Second kitchen; Refrigerator
- Bedrooms: One main-level bedroom; Total rooms include multiple bedrooms
- Flooring: Vinyl; Varies
- Bathrooms: Two full bathrooms; One main-level bathroom
- Heating & cooling: Forced air heating; Heating present (see remarks)
- Interior features: Den; Separate/formal living room; Home office; Second kitchen; Bedroom on main level; Full basement
- Laundry & utility: Laundry in basement; Gas water heater
Neighborhood map
What this means for you Summary
Snapshot
- This is a 3-bed/2.0-bath single-family listed at $150k.
Deal economics
- At list price, monthly cash flow is $641 ($8k/yr) — positive.
- The deal already cash-flows at list — no discount required.
- Meets the 1% rule at list price ($2k rent vs $150k).
- Recommended offer: $146k (3.0% below list) — sets the bar for market timing.
- Cap rate 11.4% vs local median 9.3% in Rochester — meaningfully above typical; check what's discounted (condition, days-on-market, listing class) to confirm the premium yield is real.
Location & tenants
- Location reads 76/100 on livability (#222 in NY, #3,482 nationally) — a middle-class / working-renter tenant base. Strengths: commute A+, cost of living A+, housing A+; Watch: schools D+, crime F, employment F.
- Rochester City School District (urban): math 21% / reading 26% proficiency, ranked #589 of 590 in NY (top 100%) — low school quality limits family demand, transient renter base, plan for 1-2y turnover; 82% free/reduced lunch — lower-income household profile, screen leases tightly.
- Market conditions: Rents rising fast (+4.6%/yr); 56 active listings in the ZIP; 20 comparable units currently listed for rent nearby; rentals at typical pace (median 24d on market — plan ~3-4 weeks tenant-placement turnaround); 40% of comp listings sitting > 30 days — soft ceiling on asking rent; 1,169 units permitted in Monroe County in 2024 (591 in 5+ unit buildings).
- This rent runs 42% of the median local income ($60k/yr) — at the standard rent-burdened threshold; future hikes will face affordability resistance.
Forward outlook
- Local home prices are declining (-3.0%/yr); year-one equity from $1k of loan paydown is wiped out by about $5k of value loss. Plan a longer hold.
- Monroe County population projected to shrink 6% by 2050 — rents likely to lag national; underwrite the cash flow, not the appreciation.
- At projected returns (-3.0% appreciation + 4.6% rent growth), your $42k cash investment doubles in ~6 years — after that, you're playing with house money.
Negotiation context
- It's been on market 33 days — a 3% lower offer ($146k) is reasonable based on typical stale-listing flexibility.
- 4 sale attempts since 13y ago with the ask held roughly flat each time — persistent listings suggest the price (not the market) is what's stuck; bring a comps-based counter.
- Current owner paid $48k; list at $150k implies a 213% gain — meaningful room to come down on a strong offer.
Risks & watch-outs
- Watch-outs: built in 1889 — expect roof / HVAC / electrical / plumbing capex.
Questions for the listing agent
- It's been on market 33 days. Have you received any prior offers? Is the seller open to a 3% concession, seller financing, or rate buy-down credit?
- Built in 1889 — when were the roof, HVAC, electrical panel, plumbing, and water heater last replaced?
- Is there a deadline driving the sale (1031 exchange, divorce, estate, relocation)? That informs how much negotiation room exists.
- Schools are D-rated, which usually means shorter tenancies and higher turnover. Who's the typical renter profile here, and what's been the actual vacancy rate?
- Crime grade is F in this area — have there been break-ins, vandalism, or insurance claims at this property in the last 3 years? What carrier currently insures it and at what premium?
- What's the average days-on-market for RENTAL listings here right now (not sales)? A rising rental-DOM trend means longer vacancies and softer asking-rent achievability than the comps imply.
- What's the recent tenant-quality profile in this submarket — average credit score on applications, eviction rate, late-payment / NSF rate, and stable-employment percentage? A property-management company in the area should have these aggregated.
- How much new for-sale + rental construction is in the pipeline within 1–3 miles? Heavy new supply typically softens prices + rents 12–24 months out; constrained supply supports both.
Investment metrics
- 1% rule
- 1.40% ✓
- Cap rate
- 11.42%
- Cash-on-cash
- 18.30%
- DSCR
- 1.81
- GRM
- 5.9
CMA / ARV
- ARV (median comp)
- $271,215
- List price
- $150,100
- Delta
- -44.66%
- Verdict
- UNDERPRICED
- Comps
- 20 within 1.0 mi
Show comp detail 12 sales within ~0.75 mi
| Address | Dist | Beds/Ba | Sqft | Sold | Price | $/sf | Match |
|---|---|---|---|---|---|---|---|
| 130 East Ave Unit UN440 | 0.54mi | 2/2.5 (-1) | 2,246 (+2%) | 1mo | $605,000 | $269 | 64 |
| 567 Averill Ave | 0.37mi | 4/2.0 (+1) | 2,170 (-2%) | 17mo | $173,000 | $80 | 60 |
| 227 S Fitzhugh St | 0.59mi | 3/2.5 | 2,023 (-8%) | 2mo | $400,000 | $198 | 55 |
| 17 Selden St St | 0.73mi | 3/3.5 | 2,110 (-4%) | 8mo | $602,000 | $285 | 47 |
| 50 Brighton St | 0.68mi | 4/2.5 (+1) | 2,390 (+8%) | 7mo | $615,000 | $257 | 41 |
| 44 Elmhurst St | 0.41mi | 4/1.0 (+1) | 1,977 (-10%) | 17mo | $235,000 | $119 | 41 |
| 47 Wilmer St | 0.68mi | 4/2.5 (+1) | 2,333 (+6%) | 15mo | $351,547 | $151 | 39 |
| 55 Harlem St | 0.70mi | 3/2.0 | 2,019 (-8%) | 19mo | $265,000 | $131 | 38 |
| 43 Amherst St | 0.62mi | 4/2.0 (+1) | 1,909 (-13%) | 8mo | $327,540 | $172 | 37 |
| 20 Wellesley St | 0.72mi | 4/1.0 (+1) | 2,048 (-7%) | 13mo | $300,000 | $146 | 35 |
| 42 Wilmer St | 0.70mi | 4/2.5 (+1) | 1,879 (-15%) | 4mo | $349,900 | $186 | 32 |
| 215 Cypress St | 0.72mi | 4/1.5 (+1) | 1,922 (-13%) | 13mo | $347,800 | $181 | 27 |
Match score weights: distance 35% · size 25% · config 20% · recency 20%. Top-matched comps best support the ARV.
Projected returns pro-forma
-3.0% appreciation · 4.6% rent growth · sell at horizon
- IRR
- 11.7%
- Equity multiple
- 1.48×
- Total profit
- $19,968
- Equity at exit
- $22,380
- IRR
- 22.0%
- Equity multiple
- 3.01×
- Total profit
- $84,636
- Equity at exit
- $12,978
Cash invested: $42,028 (down + closing). Projections, not guarantees.
Landlord ↔ Tenant lean methodology
- Overall (STATE)
- 15 Strongly Tenant-Friendly
- State New York
- 15 Strongly Tenant-Friendly · D+10
- County
- — inherits STATE
- City
- — inherits STATE
ZIP-level market 14607
- Home prices YoY
- -10.7%
- Rents YoY
- 4.6%
- Active inventory
- 56
- Price-to-rent
- 5.9×
Monthly cashflow live
- Estimated rent
- $2,104 high interval (Pro) →
- Mortgage (P&I)
- −$787
- Tax from tax record
- −$171 /mo · $2,057/yr
- Insurance
- −$63
- HOA
- −$0
- Vacancy / Maint / Mgmt
- −$442
- Net cashflow
- $641
Break-even live
Sensitivity live
| Price | -10% $726 | -5% $684 | +0% $641 | +5% $599 | +10% $556 |
|---|---|---|---|---|---|
| Rent | -10% $475 | -5% $558 | +0% $641 | +5% $724 | +10% $807 |
| Rate | -1.0pp $717 | -0.5pp $679 | base $641 | +0.5pp $602 | +1.0pp $563 |
UW: 25.0% down · 7.5% · 30yr · 1.5% tax · 5.0% vac · 8.0% maint · 8.0% mgmt
Financing live
Cash to close
- Down payment
- $37,525
- Closing costs
- $4,503
- Reserves months
- —
- Total cash needed
- —
Loan-product check · same deal, 3 products live
Conventional
25% down · 7.5% · 30yr
- Down + closing
- —
- Monthly P&I
- —
- Monthly cashflow
- —
- DSCR
- —
- Eligible?
- —
Personal DTI + credit; lowest rate.
DSCR
20% down · 8.5% · 30yr
- Down + closing
- —
- Monthly P&I
- —
- Monthly cashflow
- —
- DSCR
- —
- Eligible?
- —
No personal income docs; deal must DSCR.
Hard money
10% down · 12.0% · 12mo
- Down + closing
- —
- Monthly P&I
- —
- Monthly cashflow
- —
- DSCR
- —
- Eligible?
- —
Short-term bridge; refi at stabilization.
Rent comps 20 comps
| Address | Beds | Baths | Sqft | Rent | $/sqft | DOM | Units | Dist |
|---|---|---|---|---|---|---|---|---|
| 507 Meigs St Rochester, NY | 3.0 | 1.0 | 1577 | $1,650 | $1.05 | 44d | 1 | 0.45mi |
| 183 E Main St Rochester, NY | 1.0–2.0 | 1.0 | 1142 | $2,870 | $2.51 | 11d | 28 | 0.54mi |
| 106 Gregory St Rochester, NY | 3.0 | 1.5 | 1680 | $1,995 | $1.19 | 24d | 1 | 0.59mi |
| 260 E Main St Rochester, NY | 3.0 | 1.0–2.0 | 1144 | $2,999 | $2.62 | 3d | 14 | 0.62mi |
| 209 S Goodman St Rochester, NY | 2.0 | 2.0 | 1500 | $1,700 | $1.13 | 44d | 1 | 0.62mi |
| 14 Franklin St Rochester, NY | 2.0 | 1.0–2.0 | 1345 | $3,477 | $2.59 | 3d | 8 | 0.63mi |
| 80 St Paul St Rochester, NY | 1.0–2.0 | 1.5–2.5 | 1024 | $1,935 | $1.89 | 3d | 3 | 0.72mi |
| 39 State St Rochester, NY | 1.0–2.0 | 1.0–2.5 | 1154 | $3,500 | $3.03 | 3d | 8 | 0.74mi |
| 500 Oxford St #1 Rochester, NY | 2.0 | 2.0 | 1400 | $1,800 | $1.29 | 44d | 1 | 0.78mi |
| 42 Wilcox St Rochester, NY | 3.0 | 1.0 | 2184 | $1,695 | $0.78 | 44d | 1 | 0.80mi |
| 260 Oxford St Unit UP Rochester, NY | 2.0 | 1.0 | 1850 | $2,600 | $1.41 | 44d | 1 | 0.87mi |
| 256 Oxford St Unit 1 Rochester, NY | 3.0 | 1.0 | 2050 | $3,000 | $1.46 | 15d | 1 | 0.87mi |
| 15 Vick Park B Unit A Rochester, NY | 2.0 | 1.5 | 1616 | $2,350 | $1.45 | 24d | 1 | 1.04mi |
| 733 University Ave #3 Rochester, NY | 3.0 | 1.5 | 1400 | $1,850 | $1.32 | 44d | 1 | 1.09mi |
| 1 Champeney Ter Rochester, NY | 3.0 | 1.0 | 1936 | $1,650 | $0.85 | 15d | 1 | 1.14mi |
| 34 Shepard St Rochester, NY | 4.0 | 1.5 | 2347 | $800 | $0.34 | 44d | 1 | 1.18mi |
| 478 Tremont St Rochester, NY | 3.0 | 2.0 | 1424 | $1,500 | $1.05 | 44d | 1 | 1.29mi |
| 933 University Ave Rochester, NY | 1.0–2.0 | 1.0–2.0 | 1295 | $3,815 | $2.94 | 3d | 12 | 1.30mi |
| 249 1/2 Columbia Ave #249 Rochester, NY | 3.0 | 1.0 | 1600 | $1,300 | $0.81 | 15d | 1 | 1.33mi |
| 36 Morningside Park Rochester, NY | 4.0 | 1.0 | 1446 | $2,400 | $1.66 | 3d | 1 | 1.37mi |
Listing history 11 events
-
2026-04-24$150,100 Active 265-char remark
-
2026-04-19historical
-
2026-04-16status Active
-
2026-03-26status Pending
-
2026-03-07price $150,100
-
2025-12-23price $158,000
-
2025-11-20price $165,900
-
2025-08-21$171,000 Active
-
2013-03-14soldstatus $48,000
Show marketing remark (200 chars)
Sale subject to approval by seller's lender as a short sale. Property is being sold in "as-is" condition. Needs re-hab. Estate will not pay for instrument survey, abstract, or transfer fees.
-
2013-03-14soldstatus $48,000
Show marketing remark (200 chars)
Sale subject to approval by seller's lender as a short sale. Property is being sold in "as-is" condition. Needs re-hab. Estate will not pay for instrument survey, abstract, or transfer fees.
-
2013-01-03$62,000
Show marketing remark (200 chars)
Sale subject to approval by seller's lender as a short sale. Property is being sold in "as-is" condition. Needs re-hab. Estate will not pay for instrument survey, abstract, or transfer fees.
ⓘ Source: listings_history table (triggers on properties + properties_extension) + one-shot
backfill from property_details.listing_events for pre-trigger history.
Tax reassessment forecast NY · Partial reset (capped growth)
- Current annual tax
- $2,057 · $171/mo
- Projected year-2 tax
- $2,297 · $191/mo
- Expected delta
- +$240/yr (+$20/mo · 11.7%)
ⓘ Screening estimate from a state-policy table — verify with the county assessor before closing.
Climate risk First Street
- Flood 1/10 Low FEMA zone X (unshaded) · 0% chance over 30 yrs
- Wildfire 1/10 Low
- Heat 2/10 Low 7 d/yr ≥96°F today · 15 d/yr by 30 yrs out
- Wind 1/10 Low
- Air quality 2/10 Low 1 unhealthy d/yr today · 1 by 30 yrs out
Nearby sold comps map
Loading sold comps map…
Walkable amenities ~0.75 mi
Loading nearby amenities…
Taxation est. · year 1
- Rental income
- $25,247
- − Mortgage interest
- −$8,408
- − Property taxes
- −$2,057
- − Insurance
- −$750
- − Repairs & maintenance
- −$2,020
- − Management
- −$2,020
- − Depreciation
- −$4,367
- Taxable income
- $5,626
- Est. tax owed @ 24.0%
- −$1,350
- After-tax cash flow
- $6,342/yr
For passive investors: Depreciation is non-cash, so a rental often shows a tax loss while cash-flowing — sheltering income. Rental losses are passive: they offset passive income freely, and up to $25,000/yr can offset ordinary (W-2) income if you actively participate and your MAGI is under $100k (phasing out to $0 by $150k); unused losses carry forward. On sale, claimed depreciation is recaptured at up to 25%, and gains may owe capital-gains tax (a 1031 exchange can defer both). Figures are a year-1 estimate at your 24.0% rate — not tax advice; consult a CPA.
Schools (NCES district)
- District
- Rochester City School District
- NCES district ID
- 3624750
- Math proficiency
- 21% ▬ 0.00%
- Reading proficiency
- 26% ▲ 4.00%
- Median HH income
- $30,923
- Composite
- 18.98/100
- National rank
- #8850
- State rank
- #589 of 590 in NY
Livability — Rochester
- Score
- 76/100
- State rank
- #222
- US rank
- #3482
Category grades
Schools grade is shown separately in the Schools card above.
Census & demographics
- Census place
- Rochester, NY
- County
- Monroe County · 674,131 people
- City population
- 432,803
- Metro
- Rochester, NY
- Population (ZIP)
- 17,891
- Household income
- $59,787
- Rent vs Own
- Severe rent burden
- 2034.0
Population outlook (Monroe County) Hauer SSP2
- Today (2025)
- 759,460 people
- By 2030
- 757,154 · -0.3%
- By 2040
- 740,644 · -2.5%
- By 2050
- 714,443 · -5.9%
- By 2075
- 645,883 · -15.0%
- By 2100
- 547,084 · -28.0%
Race, ethnicity, and origin ACS 2023
- Neighborhood character
- Predominantly White (78%)
- Race & ethnicity
- White 78% Black 8% Two or more races 7% Hispanic / Latino 6% Asian 2%
- Hispanic origin (detail)
- Puerto Rican 2%
- Common ancestry
- Romanian 5% Slovak 4% Scotch-Irish 2%
- Foreign-born
- 7% · Canada, South Korea
- Languages at home
- 90% English-only · Spanish 5% Other Indo-European 1% Russian/Polish/Slavic 1%
Political lean MEDSL · Monroe
- 2024 margin
- D (+19.1) · D 59.5% · R 40.5%
- 2008→2024 swing
- +1.4pp toward D · 2008: 17.7pp · 2024: 19.1pp
- All cycles
- 2024: D+19.1 2020: D+21.0 2016: D+14.1 2012: D+17.4 2008: D+17.7
Not yet ingested
- Civics
- —
Market trends
- HPI YoY
- ▼ -35.72%
- Current HPI
- 297.8107
- Rent YoY
- ▲ 4.60%
- Metro
- Rochester, NY
- State GDP YoY
- ▲ 2.60%
- F500 in state
- 92
Industry mix (Fortune 500 HQ in NY)
| Industry | F500 HQs | Revenue |
|---|---|---|
| Financial Services | 10 | $950B |
|
||
| Consumer Goods | 9 | $162B |
|
||
| Insurance | 4 | $225B |
|
||
| Telecommunications | 2 | $144B |
|
||
| Pharmaceuticals | 2 | $112B |
|
||
| Media / Entertainment | 2 | $69B |
|
||
Price history
+142.1% since first listed12 events — show timeline
- 2026-05-27 Listing Removed — UNYREIS
- 2026-04-24 Listed $150,100 UNYREIS
- 2026-04-19 Listing Removed — UNYREIS
- 2026-04-16 Relisted — UNYREIS
- 2026-03-26 Pending — UNYREIS
- 2026-03-07 Price Changed $150,100 UNYREIS
- 2025-12-23 Price Changed $158,000 UNYREIS
- 2025-11-20 Price Changed $165,900 UNYREIS
- 2025-08-21 Listed $171,000 UNYREIS
- 2013-03-14 Sold (Public Records) $48,000 Public Records
- 2013-03-14 Sold (MLS) $48,000 UNYREIS
- 2013-01-03 Listed $62,000 UNYREIS
Property tax history
+9.3%/yrLatest (2025): $2,057 · -20.7% YoY. Source: county tax records.
Cash-flow waterfall
monthlySold comps — $/sqft
last 12 mo · ≤1 miLoading sold comps…