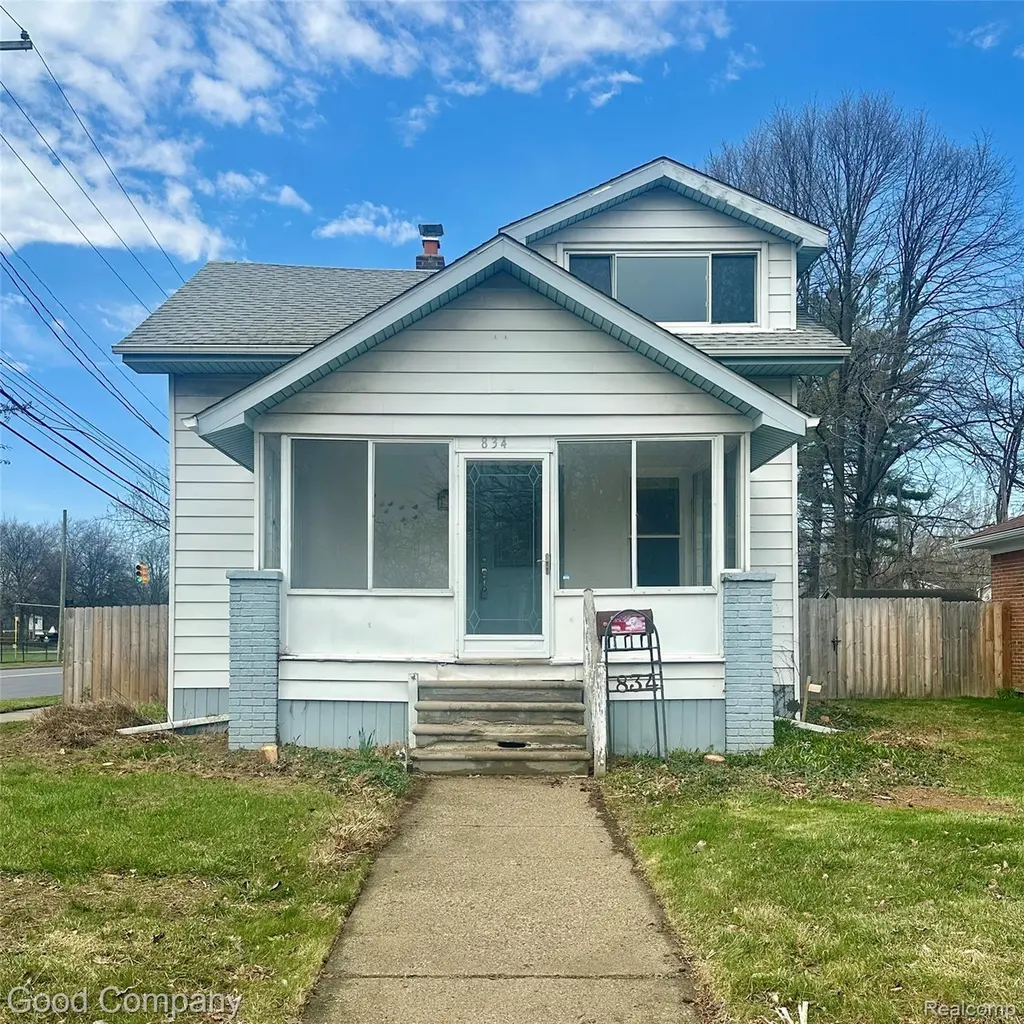
834 W Houstonia Ave · Royal Oak, MI
Flood risk 1/10 · Minimal
- FEMA flood zone
- X (unshaded)
- Chance of flooding over 30 yrs
- 0.0%
- Est. flood insurance / yr
- $507 – $1,088
Fire risk 1/10 · Minimal
- Est. fire insurance / yr
- $784 – $1,456
Heat risk 2/10 · Minimal
- Hot days now (above 97°F)
- 7 days/yr
- Hot days in 30 yrs
- 15 days/yr
Wind risk 2/10 · Minimal
- Chance of severe wind over 30 yrs
- —
Air-quality risk 4/10 · Minor
- Unhealthy air days now
- 3 days/yr
- Unhealthy air days in 30 yrs
- 6 days/yr
Risk factors via First Street. Map © Google.
Why this score? — see what drove the D grade
The composite is a weighted blend of 9 inputs, each scored 0–100. Each bar is that input's sub-score; the figure is the points it added to the 100-point composite (weight × sub-score).
- ARV discount +15.0/15.0
- Cash flow +8.4/30.0
- Schools +4.4/10.0
- Livability +4.2/5.0
- Rent growth +3.1/5.0
- 1% rule +2.6/10.0
- Condition / age +2.5/5.0
- DSCR +2.3/10.0
- Appreciation +0.0/10.0
$229,900
🖨 Deal sheet (PDF) 📄 Offer letter ✓ Due diligence
Listing remarks MLS
MAKE THIS YOUR STARTER HOME, OR BRING YOUR PLANS TO BUILD YOUR DREAM HOME, EXTRA LARGE (50 X150) LOT, GREAT LOCATION, TWO BEDROOMS BUNGALOW, TWO FULL BATHS, 2+ CAR GARAGE, NICE RESIDENTIONAL AREA, CLOSE TO DOWNTOWN SHOPPING AND RESUARUNTS.
Key facts
- Great location
- Extra large lot
- Close to downtown
Tags
Property features AI
Exterior
- Parking: Detached 2-car garage
- Utilities: Public water; Public sewer
- Home design: Single-family residence; One and one half stories; Ground-level entry with steps
- Construction: Aluminum and vinyl siding; Block foundation
- Exterior features: Paved road access; Asphalt roof; Lot approximately 50 x 150 (0.17 acres); No pool
Interior
- Kitchen: Free-standing gas range; Free-standing refrigerator
- Bathrooms: 2 full bathrooms
- Heating & cooling: Forced air heating (natural gas); Central air conditioning
- Interior features: Dishwasher; Disposal; Microwave; Range hood; Unfinished basement
- Laundry & utility: Washer; Dryer
Neighborhood map
What this means for you Summary
Snapshot
- This is a 3-bed/1.0-bath single-family listed at $230k.
Deal economics
- At list price, monthly cash flow is $-207 ($-2k/yr) — negative.
- To cash-flow at today's rent, offer at most $193k (15.9% below list).
- To meet the 1% rule (rent ≥ 1% of price), the offer needs to be $175k (23.7% below list).
- Recommended offer: $175k (23.7% below list) — sets the bar for 1% rule.
- Cap rate 5.2% vs local median 3.7% in Royal Oak — top-decile yield for the area; either an underpriced asset or a hidden risk that comps aren't pricing in. Stress-test before assuming the spread holds.
Location & tenants
- Location reads 83/100 on livability (#50 in MI, #1,020 nationally) — a professional / high-income tenant draw. Strengths: crime A+, commute A+, employment A+; Watch: amenities D+.
- Royal Oak Schools (suburban): math 41% / reading 59% proficiency, ranked #89 of 540 in MI (top 16%) — acceptable for families but not a draw, mixed tenant base, ~2y average lease; only 20% free/reduced lunch — higher-income household profile.
- Zoned schools: Northwood Elementary School (math 68% / reading 71%, grade A-, #74 of 1,397 statewide, top 7%, 449 students, 12% FRL); Royal Oak Middle School (math 35% / reading 56%, grade D+, #161 of 493 statewide, top 33%, 1,060 students, 28% FRL); Royal Oak High School (math 49% / reading 75%, grade B-, #58 of 713 statewide, top 9%, 1,341 students, 26% FRL) — zoned schools at 22% FRL track the district average.
- Market conditions: Rents rising (+2.4%/yr); 259 active listings in the ZIP; 26 comparable units currently listed for rent nearby; rentals at typical pace (median 22d on market — plan ~3-4 weeks tenant-placement turnaround); solid renter incomes; 2,614 units permitted in Oakland County in 2024 (721 in 5+ unit buildings).
Forward outlook
- Local home prices are declining (-3.0%/yr); year-one equity from $2k of loan paydown is wiped out by about $7k of value loss. Plan a longer hold.
- Oakland County population projected at +10% by 2050 — modest demand growth; plan on rents tracking national, not racing it.
Negotiation context
- It's been on market 23 days — a 2% lower offer ($226k) is reasonable based on typical stale-listing flexibility.
- 4 sale attempts; this cycle's ask has dropped $30k (12%) from the opening price — seller is motivated, your offer sets the floor, not the list.
Risks & watch-outs
- Watch-outs: built in 1923 — expect roof / HVAC / electrical / plumbing capex.
Questions for the listing agent
- What do current leases actually rent for vs. the listed asking? Can we see a recent rent roll and the last 12 months of T-12 income?
- Built in 1923 — when were the roof, HVAC, electrical panel, plumbing, and water heater last replaced?
- Is there a deadline driving the sale (1031 exchange, divorce, estate, relocation)? That informs how much negotiation room exists.
- Schools are B-rated — typically a magnet for longer-tenancy family renters. What's the average tenant stay here, and is there a school-zone premium baked into asking?
- The area grade is low — what's the realistic commute time and amenity access for the typical tenant pool here? Any planned neighborhood developments (good or bad) we should know about?
- What's the average days-on-market for RENTAL listings here right now (not sales)? A rising rental-DOM trend means longer vacancies and softer asking-rent achievability than the comps imply.
- What's the recent tenant-quality profile in this submarket — average credit score on applications, eviction rate, late-payment / NSF rate, and stable-employment percentage? A property-management company in the area should have these aggregated.
- How much new for-sale + rental construction is in the pipeline within 1–3 miles? Heavy new supply typically softens prices + rents 12–24 months out; constrained supply supports both.
Investment metrics
- 1% rule
- 0.76% ✗
- Cap rate
- 5.21%
- Cash-on-cash
- -3.86%
- DSCR
- 0.83
- GRM
- 10.9
CMA / ARV
- ARV (median comp)
- $285,156
- List price
- $229,900
- Delta
- -9.17%
- Verdict
- FAIR
- Comps
- 20 within 1.0 mi
Show comp detail 10 sales within ~0.75 mi
| Address | Dist | Beds/Ba | Sqft | Sold | Price | $/sf | Match |
|---|---|---|---|---|---|---|---|
| 404 LA Plaza Ct | 0.30mi | 2/1.0 (-1) | 918 (0%) | 14mo | $232,500 | $253 | 69 |
| 912 Cedarhill Dr | 0.26mi | 2/2.0 (-1) | 976 (+6%) | 5mo | $350,000 | $359 | 64 |
| 922 Cedarhill | 0.26mi | 2/1.0 (-1) | 1,048 (+14%) | 2mo | $316,000 | $302 | 58 |
| 316 W 12 Mile Rd | 0.38mi | 3/1.0 | 960 (+5%) | 21mo | $260,000 | $271 | 57 |
| 1634 Crooks Rd | 0.39mi | 3/2.0 | 1,038 (+13%) | 4mo | $275,000 | $265 | 52 |
| 1829 N Washington Ave | 0.38mi | 3/2.5 | 1,001 (+9%) | 12mo | $265,000 | $265 | 51 |
| 911 Mayfield Dr | 0.57mi | 2/1.5 (-1) | 888 (-3%) | 14mo | $300,000 | $338 | 49 |
| 218 E 12 Mile Rd | 0.66mi | 2/1.0 (-1) | 804 (-12%) | 9mo | $230,000 | $286 | 36 |
| 1306 Edgewood Dr | 0.52mi | 2/1.0 (-1) | 1,040 (+13%) | 18mo | $331,000 | $318 | 33 |
| 1312 Catalpa Dr | 0.72mi | 3/1.5 | 1,050 (+14%) | 11mo | $332,000 | $316 | 31 |
Match score weights: distance 35% · size 25% · config 20% · recency 20%. Top-matched comps best support the ARV.
Projected returns pro-forma
-3.0% appreciation · 2.36% rent growth · sell at horizon
- IRR
- -23.5%
- Equity multiple
- 0.20×
- Total profit
- $-51,544
- Equity at exit
- $34,279
- IRR
- -20.1%
- Equity multiple
- -0.03×
- Total profit
- $-66,306
- Equity at exit
- $19,878
Cash invested: $64,372 (down + closing). Projections, not guarantees.
Landlord ↔ Tenant lean methodology
- Overall (STATE)
- 62 Landlord-Friendly
- State Michigan
- 62 Landlord-Friendly · EVEN
- County
- — inherits STATE
- City
- — inherits STATE
ZIP-level market 48073
- Rents YoY
- 2.4%
- Active inventory
- 259
- Price-to-rent
- 10.9×
Monthly cashflow live
- Estimated rent
- $1,754 high interval (Pro) →
- Mortgage (P&I)
- −$1,206
- Tax from tax record
- −$291 /mo · $3,497/yr
- Insurance
- −$96
- HOA
- −$0
- Vacancy / Maint / Mgmt
- −$368
- Net cashflow
- $-207
Break-even live
Sensitivity live
| Price | -10% $-77 | -5% $-142 | +0% $-207 | +5% $-272 | +10% $-337 |
|---|---|---|---|---|---|
| Rent | -10% $-346 | -5% $-276 | +0% $-207 | +5% $-138 | +10% $-69 |
| Rate | -1.0pp $-91 | -0.5pp $-149 | base $-207 | +0.5pp $-267 | +1.0pp $-327 |
UW: 25.0% down · 7.5% · 30yr · 1.5% tax · 5.0% vac · 8.0% maint · 8.0% mgmt
Financing live
Cash to close
- Down payment
- $57,475
- Closing costs
- $6,897
- Reserves months
- —
- Total cash needed
- —
Loan-product check · same deal, 3 products live
Conventional
25% down · 7.5% · 30yr
- Down + closing
- —
- Monthly P&I
- —
- Monthly cashflow
- —
- DSCR
- —
- Eligible?
- —
Personal DTI + credit; lowest rate.
DSCR
20% down · 8.5% · 30yr
- Down + closing
- —
- Monthly P&I
- —
- Monthly cashflow
- —
- DSCR
- —
- Eligible?
- —
No personal income docs; deal must DSCR.
Hard money
10% down · 12.0% · 12mo
- Down + closing
- —
- Monthly P&I
- —
- Monthly cashflow
- —
- DSCR
- —
- Eligible?
- —
Short-term bridge; refi at stabilization.
Rent comps 26 comps
| Address | Beds | Baths | Sqft | Rent | $/sqft | DOM | Units | Dist |
|---|---|---|---|---|---|---|---|---|
| 1923 Crooks Rd Unit 1923-18 Royal Oak, MI | 2.0 | 1.0 | 1000 | $1,350 | $1.35 | 26d | 1 | 0.14mi |
| 308 W Twelve Mile Rd Unit 4/D Royal Oak, MI | 3.0 | 1.0 | 1000 | $2,200 | $2.20 | 21d | 1 | 0.41mi |
| 122 W Houstonia Ave Royal Oak, MI | 2.0 | 1.0 | 800 | $1,350 | $1.69 | 26d | 1 | 0.46mi |
| 122 W Houstonia Ave Unit B Royal Oak, MI | 2.0 | 1.0 | 800 | $1,350 | $1.69 | 22d | 1 | 0.46mi |
| 1814 N Center St Royal Oak, MI | 3.0 | 1.5 | 1072 | $1,790 | $1.67 | 5d | 1 | 0.50mi |
| 1880 Rochester Rd Royal Oak, MI | 1.0–2.0 | 1.0 | 900 | $1,550 | $1.72 | 23d | 1 | 0.67mi |
| 1607 Catalpa Dr Unit 1607 Catalpa Royal Oak, MI | 2.0 | 1.0 | 950 | $2,100 | $2.21 | 26d | 1 | 0.80mi |
| 3115 Evergreen Dr Royal Oak, MI | 1.0–2.0 | 1.0 | 887 | $1,630 | $1.84 | 7d | 8 | 0.82mi |
| 418 Austin Ave Royal Oak, MI | 3.0 | 1.0 | 946 | $2,200 | $2.33 | 5d | 1 | 0.85mi |
| 429 Linden Ave Royal Oak, MI | 3.0 | 1.0 | 909 | $1,995 | $2.19 | 26d | 1 | 0.96mi |
| 222 E Thirteen Mile Rd Unit 2 Royal Oak, MI | 2.0 | 1.0 | 900 | $1,900 | $2.11 | 26d | 1 | 1.03mi |
| 480 N Main St Royal Oak, MI | 1.0–2.0 | 1.0–2.0 | 1045 | $4,645 | $4.44 | 0d | 6 | 1.14mi |
| 201 N Lafayette Ave Royal Oak, MI | 1.0–2.0 | 1.0 | 755 | $1,587 | $2.10 | 1d | 5 | 1.17mi |
| 3807 Crooks Rd Royal Oak, MI | 2.0 | 1.0 | 549 | $1,315 | $2.40 | 1d | 7 | 1.19mi |
| 3406 Elmhurst Ave Royal Oak, MI | 2.0 | 1.0 | 950 | $1,800 | $1.89 | 26d | 1 | 1.19mi |
| 232 Woodlawn Ave Royal Oak, MI | 4.0 | 2.0 | 1000 | $4,500 | $4.50 | 0d | 1 | 1.20mi |
| 350 N Main St #806 Royal Oak, MI | 2.0 | 2.0 | 1100 | $2,400 | $2.18 | 26d | 1 | 1.24mi |
| 3225 Benjamin Ave #2 Royal Oak, MI | 2.0 | 1.0 | 800 | $1,525 | $1.91 | 7d | 1 | 1.25mi |
| 3220 Shenandoah Dr #12 Royal Oak, MI | 2.0 | 1.0 | 688 | $1,250 | $1.82 | 26d | 1 | 1.27mi |
| 118 N Main St Royal Oak, MI | 3.0 | 1.0–3.0 | 1432 | $6,200 | $4.33 | 0d | 4 | 1.29mi |
| 1007 Gardenia Ave Unit 1009 Royal Oak, MI | 2.0 | 1.0 | 1000 | $1,400 | $1.40 | 26d | 1 | 1.30mi |
| 4031 Crooks Rd Unit 4061-212 Royal Oak, MI | 2.0 | 1.0 | 1066 | $1,795 | $1.68 | 7d | 1 | 1.32mi |
| 3011 Ferris Ave Royal Oak, MI | 3.0 | 2.0 | 1018 | $2,400 | $2.36 | 0d | 1 | 1.34mi |
| 155 Amelia St Royal Oak, MI | 1.0–4.0 | 1.0–2.5 | 971 | $1,770 | $1.82 | 5d | 7 | 1.42mi |
| 2817 W 13 Mile Rd Royal Oak, MI | 2.0 | 1.0 | 688 | $1,250 | $1.82 | 26d | 1 | 1.43mi |
| 609 E Eleven Mile Rd Royal Oak, MI | 1.0–2.0 | 1.0 | 925 | $1,375 | $1.49 | 26d | 1 | 1.46mi |
Listing history 22 events
-
2026-06-21days on market $229,900 Active 23 DOM
-
2026-06-18days on market $229,900 Active 20 DOM
-
2026-06-17days on market $229,900 Active 19 DOM
-
2026-06-16days on market $229,900 Active 18 DOM
-
2026-06-15pricedays on market $229,900 Active 17 DOM
-
2026-06-13days on market $249,900 Active 15 DOM
Show marketing remark (239 chars)
MAKE THIS YOUR STARTER HOME, OR BRING YOUR PLANS TO BUILD YOUR DREAM HOME, EXTRA LARGE (50 X150) LOT, GREAT LOCATION, TWO BEDROOMS BUNGALOW, TWO FULL BATHS, 2+ CAR GARAGE, NICE RESIDENTIONAL AREA, CLOSE TO DOWNTOWN SHOPPING AND RESUARUNTS.
-
2026-06-09days on market $249,900 Active 11 DOM
Show marketing remark (239 chars)
MAKE THIS YOUR STARTER HOME, OR BRING YOUR PLANS TO BUILD YOUR DREAM HOME, EXTRA LARGE (50 X150) LOT, GREAT LOCATION, TWO BEDROOMS BUNGALOW, TWO FULL BATHS, 2+ CAR GARAGE, NICE RESIDENTIONAL AREA, CLOSE TO DOWNTOWN SHOPPING AND RESUARUNTS.
-
2026-06-08pricedays on market $249,900 Active 10 DOM
-
2026-06-07days on market $259,900 Active 9 DOM
-
2026-06-04days on market $259,900 Active 6 DOM
-
2026-06-03days on market $259,900 Active 5 DOM
-
2026-06-02days on market $259,900 Active 4 DOM
-
2026-06-01days on market $259,900 Active 3 DOM
-
2026-05-31days on market $259,900 Active 2 DOM
-
2026-05-18price $259,000 763-char remark
-
2026-05-18price $259,000 763-char remark
-
2026-05-10price $269,000 763-char remark
-
2026-05-10price $269,000 763-char remark
-
2026-04-16price $276,000 763-char remark
-
2026-04-16price $276,000 763-char remark
-
2026-03-05$279,000 Active 763-char remark
-
2026-03-05$279,000 Active 763-char remark
ⓘ Source: listings_history table (triggers on properties + properties_extension) + one-shot
backfill from property_details.listing_events for pre-trigger history.
Tax reassessment forecast MI · Partial reset (capped growth)
- Current annual tax
- $3,497 · $291/mo
- Projected year-2 tax
- $3,519 · $293/mo
- Expected delta
- +$22/yr (+$2/mo · 0.6%)
ⓘ Screening estimate from a state-policy table — verify with the county assessor before closing.
Climate risk First Street
- Flood 1/10 Low FEMA zone X (unshaded) · 0% chance over 30 yrs
- Wildfire 1/10 Low
- Heat 2/10 Low 7 d/yr ≥97°F today · 15 d/yr by 30 yrs out
- Wind 2/10 Low
- Air quality 4/10 Moderate 3 unhealthy d/yr today · 6 by 30 yrs out
Nearby sold comps map
Loading sold comps map…
Walkable amenities ~0.75 mi
Loading nearby amenities…
Taxation est. · year 1
- Rental income
- $21,048
- − Mortgage interest
- −$12,878
- − Property taxes
- −$3,497
- − Insurance
- −$1,150
- − Repairs & maintenance
- −$1,684
- − Management
- −$1,684
- − Depreciation
- −$6,688
- Taxable loss
- −$6,533
- Est. tax savings @ 24.0%
- +$1,568
- After-tax cash flow
- $-919/yr
For passive investors: Depreciation is non-cash, so a rental often shows a tax loss while cash-flowing — sheltering income. Rental losses are passive: they offset passive income freely, and up to $25,000/yr can offset ordinary (W-2) income if you actively participate and your MAGI is under $100k (phasing out to $0 by $150k); unused losses carry forward. On sale, claimed depreciation is recaptured at up to 25%, and gains may owe capital-gains tax (a 1031 exchange can defer both). Figures are a year-1 estimate at your 24.0% rate — not tax advice; consult a CPA.
Schools (NCES district)
- District
- Royal Oak Schools
- NCES district ID
- 2630300
- Math proficiency
- 41% ▼ -10.00%
- Reading proficiency
- 59% ▼ -3.00%
- Median HH income
- $65,456
- Composite
- 44.19/100
- National rank
- #2853
- State rank
- #89 of 540 in MI
Livability — Royal Oak
- Score
- 83/100
- State rank
- #50
- US rank
- #1020
Category grades
Schools grade is shown separately in the Schools card above.
Census & demographics
- Census place
- Royal Oak, MI
- County
- Oakland County · 1,009,092 people
- City population
- 57,974
- Metro
- Detroit-Warren-Dearborn, MI
- Population (ZIP)
- 33,106
- Household income
- $91,627
- Rent vs Own
- Severe rent burden
- 718.0
Population outlook (Oakland County) Hauer SSP2
- Today (2025)
- 1,335,747 people
- By 2030
- 1,375,100 · +2.9%
- By 2040
- 1,435,385 · +7.5%
- By 2050
- 1,469,250 · +10.0%
- By 2075
- 1,531,946 · +14.7%
- By 2100
- 1,450,485 · +8.6%
Race, ethnicity, and origin ACS 2023
- Neighborhood character
- Predominantly White (80%)
- Race & ethnicity
- White 80% Black 8% Two or more races 6% Asian 4% Hispanic / Latino 3%
- Common ancestry
- Romanian 13% Lithuanian 4% Slovak 3%
- Foreign-born
- 7% · Canada, China
- Languages at home
- 94% English-only · Spanish 1% Chinese 1% Other Indo-European 1%
Political lean MEDSL · Oakland
- 2024 margin
- D (+10.6) · D 54.4% · R 43.8% · Other 1.9%
- 2008→2024 swing
- -3.9pp toward R · 2008: 14.5pp · 2024: 10.6pp
- All cycles
- 2024: D+10.6 2020: D+14.1 2016: D+8.1 2012: D+8.1 2008: D+14.5
Not yet ingested
- Civics
- —
Market trends
- HPI YoY
- ▼ -479.60%
- Current HPI
- 215.8425
- Rent YoY
- ▲ 2.36%
- Metro
- Detroit-Warren-Dearborn, MI
- State GDP YoY
- ▲ 1.37%
- F500 in state
- 28
Industry mix (Fortune 500 HQ in MI)
| Industry | F500 HQs | Revenue |
|---|---|---|
| Automotive Parts | 3 | $48B |
|
||
| Automotive | 2 | $372B |
|
||
| Chemicals | 1 | $45B |
|
||
| Automotive Retail | 1 | $29B |
|
||
| Healthcare / Medical Devices | 1 | $23B |
|
||
| Automotive Technology | 1 | $20B |
|
||
Price history
-17.6% since first listed16 events — show timeline
- 2026-06-14 Price Changed $229,900 REALCOMP
- 2026-06-13 Price Changed $229,900 MiRealSource-MiMLS
- 2026-06-09 Price Changed $249,900 MiRealSource-MiMLS
- 2026-06-08 Price Changed $249,900 REALCOMP
- 2026-05-29 Listed $259,900 MiRealSource-MiMLS
- 2026-05-29 Listed $259,900 REALCOMP
- 2026-05-26 Listing Removed — MiRealSource-MiMLS
- 2026-05-26 Listing Removed — REALCOMP
- 2026-05-18 Price Changed $259,000 MiRealSource-MiMLS
- 2026-05-18 Price Changed $259,000 REALCOMP
- 2026-05-10 Price Changed $269,000 MiRealSource-MiMLS
- 2026-05-10 Price Changed $269,000 REALCOMP
- 2026-04-16 Price Changed $276,000 MiRealSource-MiMLS
- 2026-04-16 Price Changed $276,000 REALCOMP
- 2026-03-05 Listed $279,000 MiRealSource-MiMLS
- 2026-03-05 Listed $279,000 REALCOMP
Property tax history
+4.9%/yrLatest (2025): $3,497 · +48.1% YoY. Source: county tax records.
Cash-flow waterfall
monthlySold comps — $/sqft
last 12 mo · ≤1 miLoading sold comps…