 🏷️ Likely Rental
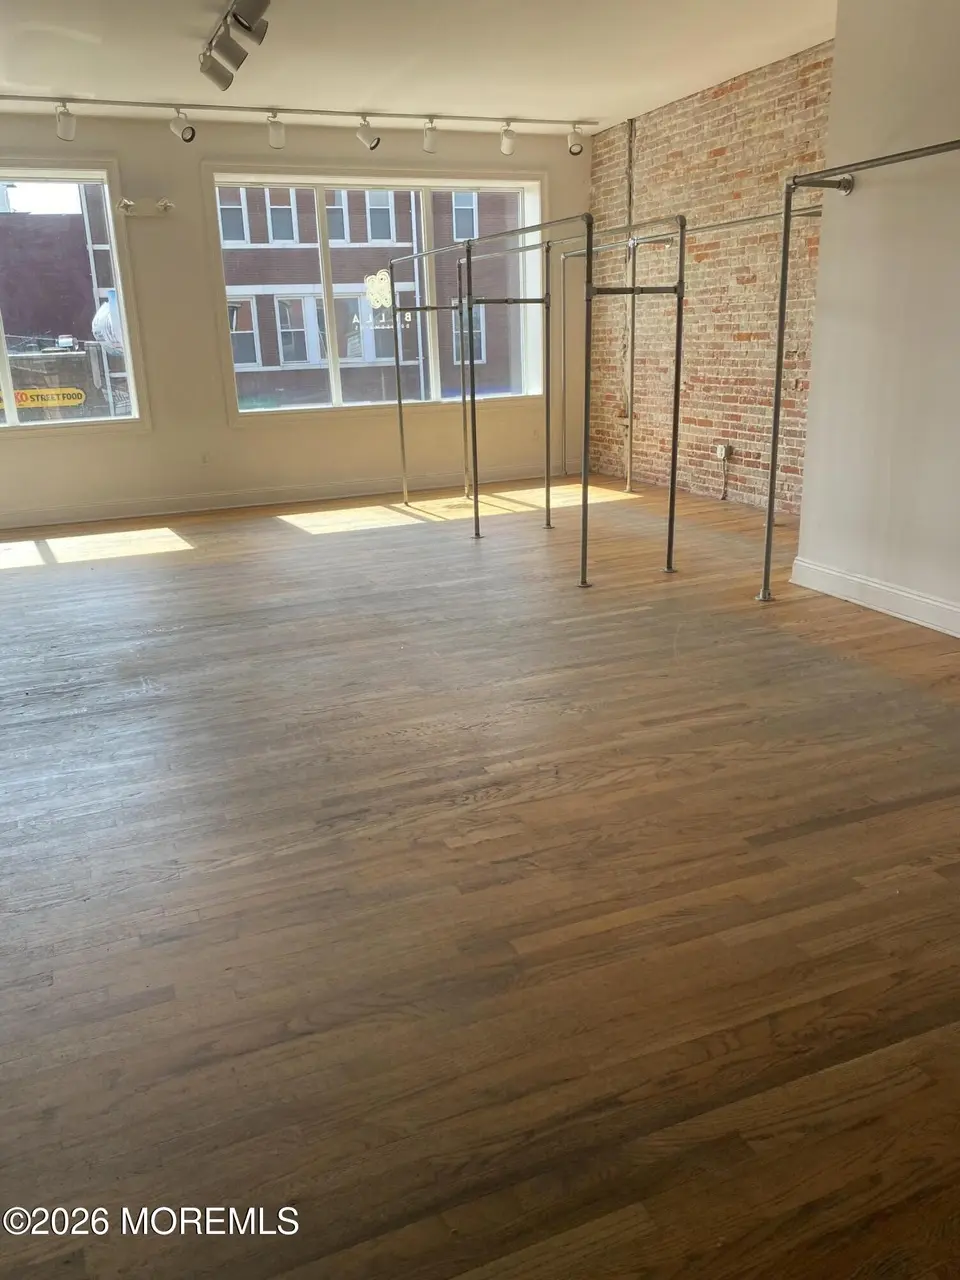
5 W Main St · Freehold, NJ
Flood risk No data
- FEMA flood zone
- —
- Chance of flooding over 30 yrs
- —
- Est. flood insurance / yr
- —
Fire risk No data
- Est. fire insurance / yr
- —
Heat risk No data
- Hot days now (above threshold)
- —
- Hot days in 30 yrs
- —
Wind risk No data
- Chance of severe wind over 30 yrs
- —
Air-quality risk No data
- Unhealthy air days now
- —
- Unhealthy air days in 30 yrs
- —
Risk factors via First Street. Map © Google.
Why this score? — see what drove the D grade
The composite is a weighted blend of 9 inputs, each scored 0–100. Each bar is that input's sub-score; the figure is the points it added to the 100-point composite (weight × sub-score).
- Cash flow +15.0/30.0
- ARV discount +7.5/15.0
- 1% rule +5.0/10.0
- DSCR +5.0/10.0
- Livability +3.1/5.0
- Rent growth +2.8/5.0
- Condition / age +2.5/5.0
- Schools +2.0/10.0
- Appreciation +0.0/10.0
$4,000
🖨 Deal sheet 📄 Offer letter ✓ Due diligence
Multi-family units
County records classify this as Multi-Family (2-4 Unit). Listing-text estimate: 1 unit. estimate disagrees with records
Key facts
- Listed 13 days
Property features AI
Exterior
- Parking: No garage
- Utilities: Public sewer; Septic tank
- Home design: Corporate ownership
- Exterior features: Located in Freehold Borough area
Interior
- Bathrooms: No bathrooms
- Heating & cooling: Central air conditioning
- Interior features: No fireplaces; Basement: Other
Neighborhood map
What this means for you Summary
Snapshot
- This is a multifamily listed at $4k.
Deal economics
- At list price, monthly cash flow is $3k ($39k/yr) — positive.
- The deal already cash-flows at list — no discount required.
- Meets the 1% rule at list price ($4k rent vs $4k).
- Cap rate 981.5% vs local median 2.9% in Freehold — top-decile yield for the area; either an underpriced asset or a hidden risk that comps aren't pricing in. Stress-test before assuming the spread holds.
Location & tenants
- Location reads 61/100 on livability (#465 in NJ) — a middle-class / working-renter tenant base. Strengths: crime B, housing B; Watch: schools C-, amenities F, commute D-.
- Freehold Borough School District (suburban): math 12% / reading 31% proficiency, ranked #416 of 472 in NJ (top 88%) — low school quality limits family demand, transient renter base, plan for 1-2y turnover; 63% free/reduced lunch — lower-income household profile, screen leases tightly.
- Market conditions: Rents rising (+1.2%/yr); 321 active listings in the ZIP; 7 comparable units currently listed for rent nearby; rentals leasing fast (median 2d on market — plan ~1-2 weeks tenant-placement turnaround); high-income renter base; 2,840 units permitted in Monmouth County in 2024 (484 in 5+ unit buildings).
- This rent runs 44% of the median local income ($114k/yr) — at the standard rent-burdened threshold; future hikes will face affordability resistance.
Forward outlook
- Local home prices are declining (-3.0%/yr); year-one equity from $28 of loan paydown is wiped out by about $120 of value loss. Plan a longer hold.
- Monmouth County population projected at -11% by 2050 — secular population decline; favor cash flow + early exit over multi-decade hold.
- At projected returns (-3.0% appreciation + 1.2% rent growth), your $1k cash investment doubles in ~1 year — after that, you're playing with house money.
Negotiation context
- Only 13 days on market — expect competitive offers; lowballing is unlikely to land.
- 2 sale attempts with the ask held roughly flat each time — persistent listings suggest the price (not the market) is what's stuck; bring a comps-based counter.
Questions for the listing agent
- Is there a deadline driving the sale (1031 exchange, divorce, estate, relocation)? That informs how much negotiation room exists.
- The area grade is low — what's the realistic commute time and amenity access for the typical tenant pool here? Any planned neighborhood developments (good or bad) we should know about?
- What's the average days-on-market for RENTAL listings here right now (not sales)? A rising rental-DOM trend means longer vacancies and softer asking-rent achievability than the comps imply.
- What's the recent tenant-quality profile in this submarket — average credit score on applications, eviction rate, late-payment / NSF rate, and stable-employment percentage? A property-management company in the area should have these aggregated.
- How much new apartment / multifamily construction is in the pipeline within 1–3 miles? Heavy new supply (>2% of stock underway) typically softens rents 12–24 months out; light construction supports rent growth.
Investment metrics
- 1% rule
- 103.75% ✓
- Cap rate
- 981.55%
- Cash-on-cash
- 3483.06%
- DSCR
- 155.98
- GRM
- 0.1
CMA / ARV
- ARV (on-the-fly)
- $711,000
- Comps found
- 3
Show comp detail 3 sales within ~0.75 mi
| Address | Dist | Beds/Ba | Sqft | Sold | Price | $/sf | Match |
|---|---|---|---|---|---|---|---|
| 21 Broadway Rd | 0.31mi | 5/2.0 | 1,583 (+6%) | 2mo | $750,000 | $474 | 75 |
| 26 Ford Ave | 0.49mi | 4/2.0 | 1,632 (+9%) | 17mo | $551,000 | $338 | 48 |
| 35 Stokes St Unit 32 Bowne | 0.43mi | 6/2.0 | 1,284 (-14%) | 14mo | $770,000 | $600 | 45 |
Match score weights: distance 35% · size 25% · config 20% · recency 20%. Top-matched comps best support the ARV.
Projected returns pro-forma
-3.0% appreciation · 1.25% rent growth · sell at horizon
- IRR
- —
- Equity multiple
- 178.93×
- Total profit
- $199,281
- Equity at exit
- $596
- IRR
- —
- Equity multiple
- 368.80×
- Total profit
- $411,939
- Equity at exit
- $346
Cash invested: $1,120 (down + closing). Projections, not guarantees.
Landlord ↔ Tenant lean methodology
- Overall (STATE)
- 21 Tenant-Leaning
- State New Jersey
- 21 Tenant-Leaning · D+6
- County
- — inherits STATE
- City
- — inherits STATE
ZIP-level market 07728
- Rents YoY
- 1.2%
- Active inventory
- 321
- Price-to-rent
- 0.2×
Monthly cashflow live
- Estimated rent
- $4,150 high interval (Pro) →
- Mortgage (P&I)
- −$21
- Tax est. 1.5%
- −$5 /mo · $60/yr
- Insurance
- −$2
- HOA
- −$0
- Vacancy / Maint / Mgmt
- −$872
- Net cashflow
- $3,251
Break-even live
2-unit breakdown (identical units grouped — click to expand)
| Units | Beds | Baths | Est. rent |
|---|---|---|---|
| 2× units | 1 | 1 | $4,150 |
| #1 | 1 | 1 | $2,075 |
| #2 | 1 | 1 | $2,075 |
| Total (2 units) | $4,150 | ||
UW: 25.0% down · 7.5% · 30yr · 1.5% tax · 5.0% vac · 8.0% maint · 8.0% mgmt
Financing live
Cash to close
- Down payment
- $1,000
- Closing costs
- $120
- Reserves months
- —
- Total cash needed
- —
Loan-product check · same deal, 3 products live
Conventional
25% down · 7.5% · 30yr
- Down + closing
- —
- Monthly P&I
- —
- Monthly cashflow
- —
- DSCR
- —
- Eligible?
- —
Personal DTI + credit; lowest rate.
DSCR
20% down · 8.5% · 30yr
- Down + closing
- —
- Monthly P&I
- —
- Monthly cashflow
- —
- DSCR
- —
- Eligible?
- —
No personal income docs; deal must DSCR.
Hard money
10% down · 12.0% · 12mo
- Down + closing
- —
- Monthly P&I
- —
- Monthly cashflow
- —
- DSCR
- —
- Eligible?
- —
Short-term bridge; refi at stabilization.
Rent comps 7 comps
| Address | Beds | Baths | Sqft | Rent | $/sqft | DOM | Units | Dist |
|---|---|---|---|---|---|---|---|---|
| 15 Center St Freehold, NJ | 3.0 | 1.0 | 1200 | $2,695 | $2.25 | 1d | 1 | 0.23mi |
| 81 South St Freehold, NJ | 2.0 | 1.5 | 1125 | $2,325 | $2.07 | 22d | 1 | 0.32mi |
| 43 Parker St Unit B Freehold, NJ | 1.0 | 1.0 | 1658 | $2,000 | $1.21 | 1d | 1 | 0.39mi |
| 709 Zlotkin Cir #5 Freehold, NJ | 2.0 | 1.5 | 1311 | $2,650 | $2.02 | 1d | 1 | 0.62mi |
| 3 Whistler Dr #3 Freehold, NJ | 2.0 | 2.5 | 1346 | $2,950 | $2.19 | 1d | 1 | 0.90mi |
| 35 Whistler Dr #1 Freehold, NJ | 3.0 | 1.5 | 1362 | $3,100 | $2.28 | 17d | 1 | 0.92mi |
| 100 Lambert Way Freehold, NJ | 1.0–2.0 | 1.0–2.0 | 1008 | $3,235 | $3.21 | 1d | 16 | 0.99mi |
Listing history 9 events
-
2026-06-18days on market $4,000 Active 13 DOM
-
2026-06-17days on market $4,000 Active 12 DOM
-
2026-06-16days on market $4,000 Active 11 DOM
-
2026-06-15days on market $4,000 Active 10 DOM
-
2026-06-13days on market $4,000 Active 8 DOM
-
2026-06-13days on market $4,000 Active 7 DOM
-
2026-06-09days on market $4,000 Active 4 DOM
-
2026-06-08days on market $4,000 Active 3 DOM
-
2026-06-07$4,000 Active 2 DOM
ⓘ Source: listings_history table (triggers on properties + properties_extension) + one-shot
backfill from property_details.listing_events for pre-trigger history.
Nearby sold comps map
Loading sold comps map…
Walkable amenities ~0.75 mi
Loading nearby amenities…
Taxation est. · year 1
- Rental income
- $49,800
- − Mortgage interest
- −$224
- − Property taxes
- −$60
- − Insurance
- −$20
- − Repairs & maintenance
- −$3,984
- − Management
- −$3,984
- − Depreciation
- −$116
- Taxable income
- $41,412
- Est. tax owed @ 24.0%
- −$9,939
- After-tax cash flow
- $29,072/yr
For passive investors: Depreciation is non-cash, so a rental often shows a tax loss while cash-flowing — sheltering income. Rental losses are passive: they offset passive income freely, and up to $25,000/yr can offset ordinary (W-2) income if you actively participate and your MAGI is under $100k (phasing out to $0 by $150k); unused losses carry forward. On sale, claimed depreciation is recaptured at up to 25%, and gains may owe capital-gains tax (a 1031 exchange can defer both). Figures are a year-1 estimate at your 24.0% rate — not tax advice; consult a CPA.
Schools (NCES district)
- District
- Freehold Borough School District
- NCES district ID
- 3405580
- Math proficiency
- 12% ▼ -27.00%
- Reading proficiency
- 31% ▼ -18.00%
- Median HH income
- $54,353
- Composite
- 19.5/100
- National rank
- #8771
- State rank
- #416 of 472 in NJ
Livability — Freehold
- Score
- 61/100
- State rank
- #465
- US rank
- #17777
Category grades
Schools grade is shown separately in the Schools card above.
Census & demographics
- Census place
- Freehold, NJ
- County
- Monmouth County · 505,557 people
- City population
- 55,984
- Metro
- New York-Newark-Jersey City, NY-NJ-PA
- Population (ZIP)
- 55,984
- Household income
- $114,072
- Rent vs Own
- Severe rent burden
- 1278.0
Population outlook (Monmouth County) Hauer SSP2
- Today (2025)
- 620,308 people
- By 2030
- 612,309 · -1.3%
- By 2040
- 587,297 · -5.3%
- By 2050
- 551,342 · -11.1%
- By 2075
- 472,934 · -23.8%
- By 2100
- 381,534 · -38.5%
Race, ethnicity, and origin ACS 2023
- Neighborhood character
- Predominantly White (67%)
- Race & ethnicity
- White 67% Hispanic / Latino 20% Two or more races 7% Asian 6% Black 4%
- Hispanic origin (detail)
- Mexican 8% Puerto Rican 5% Dominican 1%
- Common ancestry
- Romanian 5% Scotch-Irish 2% Italian 1%
- Foreign-born
- 16% · Canada, China, Jamaica
- Languages at home
- 76% English-only · Spanish 14% Other Indo-European 4% Russian/Polish/Slavic 2%
Political lean MEDSL · Monmouth
- 2024 margin
- R (+11.4) · D 43.4% · R 54.8% · Other 1.8%
- 2008→2024 swing
- -7.7pp toward R · 2008: -3.7pp · 2024: -11.4pp
- All cycles
- 2024: R+11.4 2020: R+2.8 2016: R+9.5 2012: R+5.5 2008: R+3.7
Not yet ingested
- Civics
- —
Market trends
- HPI YoY
- ▼ -442.26%
- Current HPI
- 319.7562
- Rent YoY
- ▲ 1.25%
- Metro
- New York-Newark-Jersey City, NY-NJ-PA
- State GDP YoY
- ▲ 2.05%
- F500 in state
- 34
Industry mix (Fortune 500 HQ in NJ)
| Industry | F500 HQs | Revenue |
|---|---|---|
| Consumer Goods | 3 | $31B |
|
||
| Pharmaceuticals | 2 | $153B |
|
||
| Technology | 2 | $21B |
|
||
| Insurance | 2 | $20B |
|
||
| Healthcare | 2 | $19B |
|
||
| Financial Services | 1 | $70B |
|
||
Price history
+0.0% since first listed2 events — show timeline
- 2026-06-05 Listed $4,000 MOMLS
- 2026-04-18 Listed $4,000 MOMLS
Cash-flow waterfall
monthlySold comps — $/sqft
last 12 mo · ≤1 miLoading sold comps…