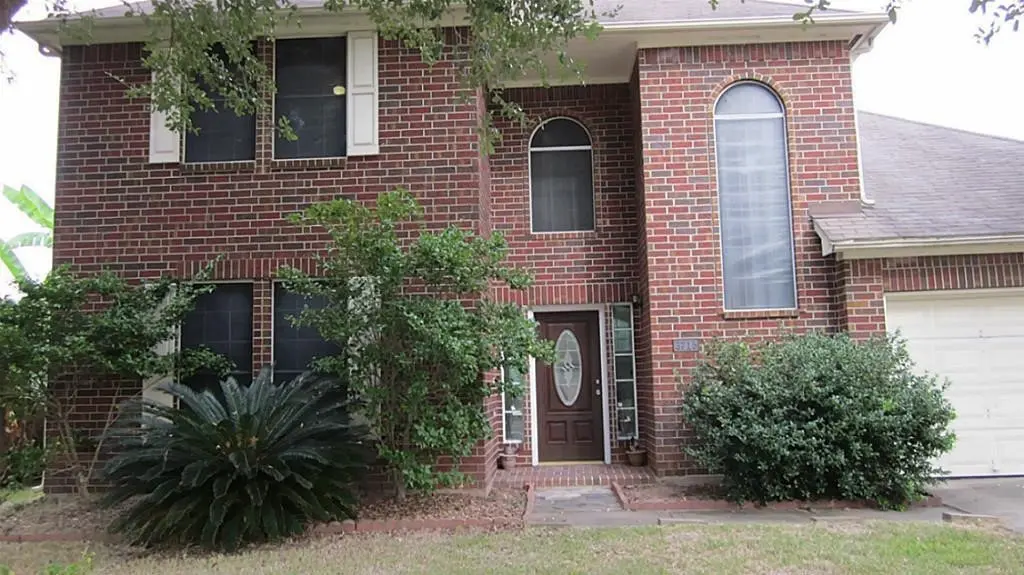
3715 Mission Valley Dr · Missouri City, TX
Flood risk 1/10 · Minimal
- FEMA flood zone
- X (unshaded)
- Chance of flooding over 30 yrs
- 0.0%
- Est. flood insurance / yr
- $507 – $1,088
Fire risk 2/10 · Minimal
- Est. fire insurance / yr
- $1,222 – $2,270
Heat risk 9/10 · Severe
- Hot days now (above 110°F)
- 7 days/yr
- Hot days in 30 yrs
- 23 days/yr
Wind risk 9/10 · Severe
- Chance of severe wind over 30 yrs
- 99.0%
Air-quality risk 3/10 · Minor
- Unhealthy air days now
- 2 days/yr
- Unhealthy air days in 30 yrs
- 3 days/yr
Risk factors via First Street. Map © Google.
Why this score? — see what drove the D- grade
The composite is a weighted blend of 9 inputs, each scored 0–100. Each bar is that input's sub-score; the figure is the points it added to the 100-point composite (weight × sub-score).
- Cash flow +9.4/30.0
- ARV discount +5.7/15.0
- Schools +4.5/10.0
- Appreciation +4.2/10.0
- 1% rule +4.0/10.0
- Livability +3.4/5.0
- DSCR +2.6/10.0
- Rent growth +2.5/5.0
- Condition / age +2.5/5.0
$295,000
🖨 Deal sheet 📄 Offer letter ✓ Due diligence
Listing remarks MLS
Beautiful spacious home located in a desirable master planned neighborhood with golf course. Home features granite counter tops, undermount sink, an island in the kitchen. Wood, tiles, and laminate thru out except for the 3 bedrooms upstairs but has with built ins in 2 of them. Master down with great size closet, and huge game room up. Decent sized backyard with a storage shed, and so much more, too much to list. Schedule your showing today and make this your new home.
Key facts
- Great size closet
- Undermount sink
- Built ins
Tags
Neighborhood map
What this means for you Summary
Snapshot
- This is a 4-bed/3.0-bath single-family listed at $295k.
Deal economics
- At list price, monthly cash flow is $-210 ($-3k/yr) — negative.
- To cash-flow at today's rent, offer at most $258k (12.5% below list).
- To meet the 1% rule (rent ≥ 1% of price), the offer needs to be $265k (10.2% below list).
- Recommended offer: $258k (12.5% below list) — sets the bar for cash-flow.
- Cap rate 5.4% vs local median 3.5% in Missouri City — top-decile yield for the area; either an underpriced asset or a hidden risk that comps aren't pricing in. Stress-test before assuming the spread holds.
Location & tenants
- Location reads 67/100 on livability (#526 in TX) — a middle-class / working-renter tenant base. Strengths: housing A+, crime A, employment A; Watch: amenities F, commute F, health & safety F.
- Fort Bend ISD (suburban): math 44% / reading 53% proficiency, ranked #140 of 826 in TX (top 17%) — families likely to look elsewhere, expect single-tenant / working-renter base with shorter leases.
- Market conditions: Rents soft (-0.1%/yr); 1215 active listings in the ZIP; 12 comparable units currently listed for rent nearby; rentals lingering (median 44d on market — plan ~5-8 weeks vacancy on turnover, expect pricing pressure); 50% of comp listings sitting > 30 days — soft ceiling on asking rent; high-income renter base; 12,093 units permitted in Fort Bend County in 2024 (815 in 5+ unit buildings).
Forward outlook
- Local home prices are declining (-1.7%/yr); year-one equity from $2k of loan paydown is wiped out by about $5k of value loss. Plan a longer hold.
- Fort Bend County population projected at +75% by 2050 — long-run rental-demand tailwind backs the buy-and-hold thesis.
Negotiation context
- It's been on market 89 days — a 6% lower offer ($277k) is reasonable based on typical stale-listing flexibility.
- 11 sale attempts since 20y ago with the ask held roughly flat each time — persistent listings suggest the price (not the market) is what's stuck; bring a comps-based counter.
Risks & watch-outs
- Climate carrying-cost: severe wind risk, 99% chance of damaging wind over 30y; extreme-heat days projected 7→23/yr by 2055 (HVAC capex compounding) — expect insurance premiums to compound above CPI over the hold.
Questions for the listing agent
- What do current leases actually rent for vs. the listed asking? Can we see a recent rent roll and the last 12 months of T-12 income?
- It's been on market 89 days. Have you received any prior offers? Is the seller open to a 13% concession, seller financing, or rate buy-down credit?
- What does the HOA fee cover, when was the last increase, and are there any pending special assessments or reserve-fund shortfalls?
- Why hasn't it sold? Are there any deal-killer items the seller is aware of (foundation, flood, title, zoning, code violations)?
- Is there a deadline driving the sale (1031 exchange, divorce, estate, relocation)? That informs how much negotiation room exists.
- Schools are B-rated — typically a magnet for longer-tenancy family renters. What's the average tenant stay here, and is there a school-zone premium baked into asking?
- The area grade is low — what's the realistic commute time and amenity access for the typical tenant pool here? Any planned neighborhood developments (good or bad) we should know about?
- What's the average days-on-market for RENTAL listings here right now (not sales)? A rising rental-DOM trend means longer vacancies and softer asking-rent achievability than the comps imply.
- What's the recent tenant-quality profile in this submarket — average credit score on applications, eviction rate, late-payment / NSF rate, and stable-employment percentage? A property-management company in the area should have these aggregated.
- How much new for-sale + rental construction is in the pipeline within 1–3 miles? Heavy new supply typically softens prices + rents 12–24 months out; constrained supply supports both.
Investment metrics
- 1% rule
- 0.90% ✗
- Cap rate
- 5.44%
- Cash-on-cash
- -3.04%
- DSCR
- 0.86
- GRM
- 9.3
CMA / ARV
- ARV (median comp)
- $283,590
- List price
- $295,000
- Delta
- 4.02%
- Verdict
- FAIR
- Comps
- 20 within 1.0 mi
Show comp detail 12 sales within ~0.75 mi
| Address | Dist | Beds/Ba | Sqft | Sold | Price | $/sf | Match |
|---|---|---|---|---|---|---|---|
| 3607 Point Clear Dr | 0.24mi | 4/3.0 | 2,467 (-4%) | 0mo | $369,900 | $150 | 81 |
| 2026 Point Clear Ct | 0.27mi | 4/2.5 | 2,647 (+3%) | 1mo | $325,000 | $123 | 80 |
| 4014 S Sandy Ct | 0.22mi | 4/2.5 | 2,367 (-8%) | 0mo | $299,900 | $127 | 74 |
| 3603 Point Clear Dr | 0.23mi | 4/2.5 | 2,743 (+7%) | 4mo | $345,000 | $126 | 73 |
| 3815 Lamplighter Cir | 0.20mi | 4/2.5 | 2,343 (-9%) | 4mo | $300,000 | $128 | 71 |
| 4026 Greenbriar Dr | 0.32mi | 3/2.5 (-1) | 2,689 (+4%) | 0mo | $390,000 | $145 | 70 |
| 3923 Kiamesha Dr | 0.54mi | 4/2.5 | 2,589 (+1%) | 2mo | $399,000 | $154 | 70 |
| 2123 N Fountain Valley Dr | 0.39mi | 4/2.5 | 2,750 (+7%) | 2mo | $369,000 | $134 | 66 |
| 3626 Telford Ln | 0.42mi | 4/3.0 | 2,330 (-9%) | 0mo | $365,000 | $157 | 64 |
| 3951 Aspen Landing Ln | 0.73mi | 4/3.0 | 2,645 (+3%) | 1mo | $415,000 | $157 | 60 |
| 3234 Cherry Springs Dr | 0.66mi | 4/2.5 | 2,292 (-11%) | 4mo | $238,500 | $104 | 46 |
| 3534 Lake Landing Ln | 0.64mi | 4/2.5 | 2,918 (+13%) | 3mo | $409,900 | $140 | 44 |
Match score weights: distance 35% · size 25% · config 20% · recency 20%. Top-matched comps best support the ARV.
Projected returns pro-forma
-1.67% appreciation · 0.0% rent growth · sell at horizon
- IRR
- -16.0%
- Equity multiple
- 0.37×
- Total profit
- $-51,898
- Equity at exit
- $61,870
- IRR
- -13.2%
- Equity multiple
- 0.08×
- Total profit
- $-76,304
- Equity at exit
- $57,307
Cash invested: $82,600 (down + closing). Projections, not guarantees.
Landlord ↔ Tenant lean methodology
- Overall (STATE)
- 87 Strongly Landlord-Friendly
- State Texas
- 87 Strongly Landlord-Friendly · R+5
- County
- — inherits STATE
- City
- — inherits STATE
ZIP-level market 77459
- Home prices YoY
- -0.8%
- Rents YoY
- -0.1%
- Active inventory
- 1215
- Price-to-rent
- 9.3×
Monthly cashflow live
- Estimated rent
- $2,649 high interval (Pro) →
- Mortgage (P&I)
- −$1,547
- Tax from tax record
- −$594 /mo · $7,132/yr
- Insurance
- −$123
- HOA
- −$38
- Vacancy / Maint / Mgmt
- −$556
- Net cashflow
- $-210
Break-even live
UW: 25.0% down · 7.5% · 30yr · 1.5% tax · 5.0% vac · 8.0% maint · 8.0% mgmt
Financing live
Cash to close
- Down payment
- $73,750
- Closing costs
- $8,850
- Reserves months
- —
- Total cash needed
- —
Loan-product check · same deal, 3 products live
Conventional
25% down · 7.5% · 30yr
- Down + closing
- —
- Monthly P&I
- —
- Monthly cashflow
- —
- DSCR
- —
- Eligible?
- —
Personal DTI + credit; lowest rate.
DSCR
20% down · 8.5% · 30yr
- Down + closing
- —
- Monthly P&I
- —
- Monthly cashflow
- —
- DSCR
- —
- Eligible?
- —
No personal income docs; deal must DSCR.
Hard money
10% down · 12.0% · 12mo
- Down + closing
- —
- Monthly P&I
- —
- Monthly cashflow
- —
- DSCR
- —
- Eligible?
- —
Short-term bridge; refi at stabilization.
Rent comps 12 comps
| Address | Beds | Baths | Sqft | Rent | $/sqft | DOM | Units | Dist |
|---|---|---|---|---|---|---|---|---|
| 4039 Mission Valley Dr Missouri City, TX | 4.0 | 2.5 | 2364 | $2,495 | $1.06 | 22d | 1 | 0.30mi |
| 2010 Quail Valley East Dr Missouri City, TX | 5.0 | 3.0 | 2651 | $2,695 | $1.02 | 43d | 1 | 0.52mi |
| 3907 Kiamesha Dr Missouri City, TX | 4.0 | 2.5 | 2896 | $2,750 | $0.95 | 17d | 1 | 0.55mi |
| 1323 Park Crest Dr Missouri City, TX | 5.0 | 3.0 | 2607 | $2,600 | $1.00 | 43d | 1 | 0.55mi |
| 2319 Quail Valley East Dr Missouri City, TX | 5.0 | 3.0 | 2235 | $2,000 | $0.89 | 43d | 1 | 0.74mi |
| 1714 Mustang Xing Missouri City, TX | 4.0 | 3.5 | 3065 | $2,436 | $0.79 | 43d | 1 | 0.75mi |
| 1109 Lakes Edge Ln Missouri City, TX | 4.0 | 3.0 | 2847 | $2,800 | $0.98 | 20d | 1 | 0.80mi |
| 2307 Hilton Head Dr Missouri City, TX | 4.0 | 2.0 | 2606 | $2,239 | $0.86 | 16d | 1 | 0.81mi |
| 2910 Fawn Ct Missouri City, TX | 4.0 | 2.5 | 2330 | $2,220 | $0.95 | 43d | 1 | 1.13mi |
| 3912 Cedar Valley Dr Missouri City, TX | 3.0 | 2.0 | 2151 | $2,200 | $1.02 | 20d | 1 | 1.15mi |
| 2235 Argos Dr Missouri City, TX | 4.0 | 3.5 | 2838 | $2,550 | $0.90 | 20d | 1 | 1.38mi |
| 3947 Amalfi Shores Ct Missouri City, TX | 4.0 | 2.5 | 2409 | $3,500 | $1.45 | 43d | 1 | 1.49mi |
HOA detail
- Monthly dues
- $38 · $456/yr
Listing history 37 events
-
2026-06-18days on market $295,000 Active 89 DOM
-
2026-06-17days on market $295,000 Active 88 DOM
-
2026-06-16days on market $295,000 Active 87 DOM
-
2026-06-15days on market $295,000 Active 86 DOM
-
2026-06-13days on market $295,000 Active 84 DOM
-
2026-06-09days on market $295,000 Active 80 DOM
-
2026-06-07days on market $295,000 Active 78 DOM
-
2026-06-04days on market $295,000 Active 75 DOM
-
2026-06-03days on market $295,000 Active 74 DOM
-
2026-06-02days on market $295,000 Active 73 DOM
-
2026-06-01days on market $295,000 Active 72 DOM
-
2026-05-31days on market $295,000 Active 71 DOM
-
2026-03-21$295,000 Active 473-char remark
Show marketing remark (473 chars)
Beautiful spacious home located in a desirable master planned neighborhood with golf course. Home features granite counter tops, undermount sink, an island in the kitchen. Wood, tiles, and laminate thru out except for the 3 bedrooms upstairs but has with built ins in 2 of them. Master down with great size closet, and huge game room up. Decent sized backyard with a storage shed, and so much more, too much to list. Schedule your showing today and make this your new home.
-
2025-12-16historical
-
2025-08-03$349,000 Active
-
2024-04-29historical
-
2023-11-01$349,000 Active
-
2023-04-05historical
-
2023-01-02$299,900 Active
-
2022-12-05historical
-
2022-09-19$325,000 Active
-
2022-09-18historical
-
2022-09-02price $349,000
-
2022-07-07$359,000 Active
-
2015-11-12historical
-
2015-11-05price $219,900
-
2015-10-20$225,000 Active
-
2011-03-02historical
-
2011-02-18$165,000
-
2011-02-18historical
-
2010-11-09$165,000
-
2010-09-29soldstatus
-
2010-09-28historical
-
2010-04-22$117,000
-
2006-11-07historical
-
2006-06-23$179,900
-
2000-07-20soldstatus
ⓘ Source: listings_history table (triggers on properties + properties_extension) + one-shot
backfill from property_details.listing_events for pre-trigger history.
Tax reassessment forecast TX · Resets to sale price
- Current annual tax
- $7,132 · $594/mo
- Projected year-2 tax
- $7,132 · $594/mo
- Expected delta
- $0/yr ($0/mo · 0.0%)
ⓘ Screening estimate from a state-policy table — verify with the county assessor before closing.
Climate risk First Street
- Flood 1/10 Low FEMA zone X (unshaded) · 0% chance over 30 yrs
- Wildfire 2/10 Low
- Heat 9/10 Extreme 7 d/yr ≥110°F today · 23 d/yr by 30 yrs out
- Wind 9/10 Extreme 99% chance of damaging wind over 30 yrs
- Air quality 3/10 Moderate 2 unhealthy d/yr today · 3 by 30 yrs out
Nearby sold comps map
Loading sold comps map…
Walkable amenities ~0.75 mi
Loading nearby amenities…
Taxation est. · year 1
- Rental income
- $31,788
- − Mortgage interest
- −$16,525
- − Property taxes
- −$7,132
- − Insurance
- −$1,475
- − Repairs & maintenance
- −$2,543
- − Management
- −$2,543
- − HOA
- −$456
- − Depreciation
- −$8,582
- Taxable loss
- −$7,467
- Est. tax savings @ 24.0%
- +$1,792
- After-tax cash flow
- $-722/yr
For passive investors: Depreciation is non-cash, so a rental often shows a tax loss while cash-flowing — sheltering income. Rental losses are passive: they offset passive income freely, and up to $25,000/yr can offset ordinary (W-2) income if you actively participate and your MAGI is under $100k (phasing out to $0 by $150k); unused losses carry forward. On sale, claimed depreciation is recaptured at up to 25%, and gains may owe capital-gains tax (a 1031 exchange can defer both). Figures are a year-1 estimate at your 24.0% rate — not tax advice; consult a CPA.
Schools (NCES district)
- District
- Fort Bend ISD
- NCES district ID
- 4819650
- Math proficiency
- 44% ▼ -15.00%
- Reading proficiency
- 53% ▼ -4.00%
- Median HH income
- $82,360
- Composite
- 44.61/100
- National rank
- #2779
- State rank
- #140 of 826 in TX
Livability — Missouri City
- Score
- 67/100
- State rank
- #526
- US rank
- #10308
Category grades
Schools grade is shown separately in the Schools card above.
Census & demographics
- Census place
- Missouri City, TX
- County
- Fort Bend County · 836,777 people
- Metro
- Houston-The Woodlands-Sugar Land, TX
- Population (ZIP)
- 84,221
- Household income
- $129,151
- Rent vs Own
- Severe rent burden
- 1004.0
Population outlook (Fort Bend County) Hauer SSP2
- Today (2025)
- 1,004,526 people
- By 2030
- 1,153,104 · +14.8%
- By 2040
- 1,453,718 · +44.7%
- By 2050
- 1,753,781 · +74.6%
- By 2075
- 2,455,772 · +144.5%
- By 2100
- 2,930,528 · +191.7%
Race, ethnicity, and origin ACS 2023
- Neighborhood character
- Highly diverse neighborhood (Simpson 0.75)
- Race & ethnicity
- White 34% Black 26% Asian 22% Hispanic / Latino 13% Two or more races 10%
- Hispanic origin (detail)
- Mexican 7%
- Common ancestry
- Lithuanian 2% Slovak 1% Italian 1%
- Foreign-born
- 21% · Canada, China, Vietnam
- Languages at home
- 73% English-only · Other Asian/Pacific 8% Spanish 7% Other Indo-European 5%
Political lean MEDSL · Fort Bend
- 2024 margin
- Toss-up / Even · D 49.5% · R 47.9% · Other 2.6%
- 2008→2024 swing
- +4.0pp toward D · 2008: -2.4pp · 2024: 1.6pp
- All cycles
- 2024: D+1.6 2020: D+10.6 2016: D+6.6 2012: R+6.8 2008: R+2.4
Not yet ingested
- Civics
- —
Market trends
- HPI YoY
- ▼ -1.67%
- Current HPI
- 212.3573
- Rent YoY
- ▼ -0.15%
- Metro
- Houston-The Woodlands-Sugar Land, TX
- State GDP YoY
- ▲ 3.95%
- F500 in state
- 110
Industry mix (Fortune 500 HQ in TX)
| Industry | F500 HQs | Revenue |
|---|---|---|
| Energy | 16 | $1,198B |
|
||
| Technology | 5 | $198B |
|
||
| Engineering / Construction | 4 | $72B |
|
||
| Energy Services | 3 | $60B |
|
||
| Utilities | 3 | $41B |
|
||
| Healthcare | 2 | $330B |
|
||
Price history
+64.0% since first listed25 events — show timeline
- 2026-03-21 Listed $295,000 HARMLS
- 2025-12-16 Listing Removed — HARMLS
- 2025-08-03 Listed $349,000 HARMLS
- 2024-04-29 Listing Removed — HARMLS
- 2023-11-01 Listed $349,000 HARMLS
- 2023-04-05 Listing Removed — HARMLS
- 2023-01-02 Listed $299,900 HARMLS
- 2022-12-05 Listing Removed — HARMLS
- 2022-09-19 Listed $325,000 HARMLS
- 2022-09-18 Listing Removed — HARMLS
- 2022-09-02 Price Changed $349,000 HARMLS
- 2022-07-07 Listed $359,000 HARMLS
- 2015-11-12 Listing Removed — HARMLS
- 2015-11-05 Price Changed $219,900 HARMLS
- 2015-10-20 Listed $225,000 HARMLS
- 2011-03-02 Listing Removed — HARMLS
- 2011-02-18 Listing Removed — HARMLS
- 2011-02-18 Listed $165,000 HARMLS
- 2010-11-09 Listed $165,000 HARMLS
- 2010-09-29 Sold (MLS) — HARMLS
- 2010-09-28 Listing Removed — HARMLS
- 2010-04-22 Listed $117,000 HARMLS
- 2006-11-07 Listing Removed — HARMLS
- 2006-06-23 Listed $179,900 HARMLS
- 2000-07-20 Sold (Public Records) — Public Records
Property tax history
+3.7%/yrLatest (2025): $7,132 · -10.3% YoY. Source: county tax records.
Cash-flow waterfall
monthlySold comps — $/sqft
last 12 mo · ≤1 miLoading sold comps…