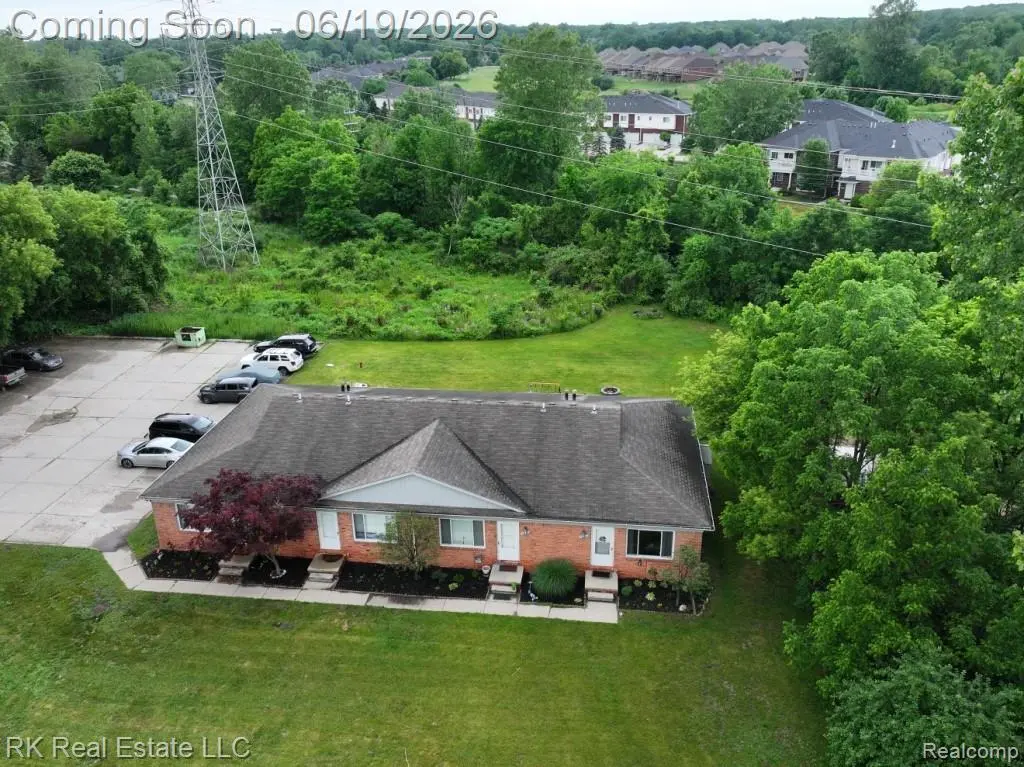
58629 Wallington · Rochester Hills, MI
Flood risk 1/10 · Minimal
- FEMA flood zone
- X (unshaded)
- Chance of flooding over 30 yrs
- 0.0%
- Est. flood insurance / yr
- $507 – $1,088
Fire risk 3/10 · Minor
- Est. fire insurance / yr
- $784 – $1,456
Heat risk 2/10 · Minimal
- Hot days now (above 97°F)
- 7 days/yr
- Hot days in 30 yrs
- 15 days/yr
Wind risk 1/10 · Minimal
- Chance of severe wind over 30 yrs
- —
Air-quality risk 3/10 · Minor
- Unhealthy air days now
- 3 days/yr
- Unhealthy air days in 30 yrs
- 3 days/yr
Risk factors via First Street. Map © Google.
Why this score? — see what drove the F grade
The composite is a weighted blend of 9 inputs, each scored 0–100. Each bar is that input's sub-score; the figure is the points it added to the 100-point composite (weight × sub-score).
- Appreciation +5.0/10.0
- Schools +4.2/10.0
- Livability +3.9/5.0
- Rent growth +2.5/5.0
- Condition / age +2.5/5.0
- Cash flow +0.0/30.0
- 1% rule +0.0/10.0
- DSCR +0.0/10.0
- ARV discount +0.0/15.0
$650,000
🖨 Deal sheet 📄 Offer letter ✓ Due diligence
Listing remarks
Apartment style quadplex featuring four ranch style units. Each unit offers 2 bedrooms, 1 bathroom, a private entrance, and access to an unfinished basement for additional storage. The property sits on a large 1-acre parcel and includes a dedicated parking lot with 10 spaces. Occupied: Currently generating steady income with a mix of month-to-month and 12-month lease terms. Tenants pay for their own metered gas and electricity. The property utilizes well water, eliminating water bills for tenants. Owner covers sewer, lawn care, and snow removal. Sits on a spacious 1-acre lot, providing long term value and curb appeal. The tenants are currently unaware that the property is for sale. For this
Key facts
- Large parcel
- Unfinished basement
- Spacious lot
Tags
Property features AI
Finance
- Financial info: Property has a lease; water is included; Net operating income reported at $50,000
Exterior
- Utilities: Private well water
- Home design: Multi-family property; Ranch style, 1-story; Built in 1978; Facing/frontage approximately 338 feet
- Construction: Basement foundation
- Exterior features: Patio; Paved street frontage
Interior
- Bathrooms: 4 full bathrooms
- Heating & cooling: Forced air heating; Central A/C; Natural gas fuel; Gas water heater
- Interior features: Poured basement
Neighborhood map
What this means for you Summary
Snapshot
- This is a ?-bed/16.0-bath single-family listed at $650k.
Deal economics
- At list price, monthly cash flow is $-4k ($-51k/yr) — negative.
- Rent doesn't cover operating costs at any purchase price — skip.
- Cap rate -1.6% vs local median 3.2% in Rochester Hills — below-typical yield; the buyer is paying a premium for something (appreciation thesis, condition, location) that the cap rate doesn't capture.
Location & tenants
- Location reads 77/100 on livability (#127 in MI, #3,163 nationally) — a middle-class / working-renter tenant base. Strengths: crime A+, employment A+, housing A+; Watch: health & safety D, amenities F, commute F.
- Romeo Community Schools (suburban): math 43% / reading 51% proficiency, ranked #102 of 540 in MI (top 19%) — families likely to look elsewhere, expect single-tenant / working-renter base with shorter leases.
- Market conditions: 1 active listings in the ZIP; 1,321 units permitted in Macomb County in 2024 (86 in 5+ unit buildings).
Forward outlook
- In year one you build about $24k of equity ($4k loan paydown + $20k appreciation (3.0% local appreciation)).
- Macomb County population projected at +9% by 2050 — modest demand growth; plan on rents tracking national, not racing it.
- By year 2, paydown + projected appreciation supports a ~$39k cash-out refi (75% LTV) — recoverable capital for the next deal without selling this one.
Negotiation context
- Only 3 days on market — expect competitive offers; lowballing is unlikely to land.
- 22 sale attempts since 19y ago; this cycle's ask is 46329% above the opening price — seller raised mid-cycle; expect resistance to lowballs.
- Current owner paid $256k; list at $650k implies a 154% gain — meaningful room to come down on a strong offer.
Questions for the listing agent
- What do current leases actually rent for vs. the listed asking? Can we see a recent rent roll and the last 12 months of T-12 income?
- Built in 1978 — when were the roof, HVAC, electrical panel, plumbing, and water heater last replaced?
- Is there a deadline driving the sale (1031 exchange, divorce, estate, relocation)? That informs how much negotiation room exists.
- Schools are A-rated — typically a magnet for longer-tenancy family renters. What's the average tenant stay here, and is there a school-zone premium baked into asking?
- The area grade is low — what's the realistic commute time and amenity access for the typical tenant pool here? Any planned neighborhood developments (good or bad) we should know about?
- What's the average days-on-market for RENTAL listings here right now (not sales)? A rising rental-DOM trend means longer vacancies and softer asking-rent achievability than the comps imply.
- What's the recent tenant-quality profile in this submarket — average credit score on applications, eviction rate, late-payment / NSF rate, and stable-employment percentage? A property-management company in the area should have these aggregated.
- How much new for-sale + rental construction is in the pipeline within 1–3 miles? Heavy new supply typically softens prices + rents 12–24 months out; constrained supply supports both.
Investment metrics
- 1% rule
- 0.00% ✗
- Cap rate
- -1.60%
- Cash-on-cash
- -28.20%
- DSCR
- -0.25
- GRM
- 0.0
CMA / ARV
- ARV (on-the-fly)
- $554,400
- Comps found
- 12
Show comp detail 12 sales within ~0.75 mi
| Address | Dist | Beds/Ba | Sqft | Sold | Price | $/sf | Match |
|---|---|---|---|---|---|---|---|
| 7070 Venturi Dr | 0.27mi | 3/3.5 | 3,786 (+2%) | 7mo | $725,000 | $191 | 57 |
| 5933 Lakepoint Ct | 0.65mi | 4/3.5 | 3,587 (-3%) | 0mo | $890,000 | $248 | 44 |
| 59779 Glacier Spring Dr S | 0.52mi | 3/4.5 | 3,492 (-6%) | 3mo | $521,000 | $149 | 44 |
| 6962 Rawling Dr | 0.34mi | 3/3.5 | 3,500 (-5%) | 14mo | $650,000 | $186 | 44 |
| 6111 West Rd | 0.51mi | 3/3.5 | 3,494 (-6%) | 16mo | $688,500 | $197 | 34 |
| 57595 Yorkshire Dr | 0.54mi | 4/2.5 | 3,223 (-13%) | 0mo | $475,000 | $147 | 33 |
| 6443 Copper Creek Dr | 0.64mi | 3/3.0 | 3,702 (+0%) | 20mo | $466,800 | $126 | 33 |
| 6303 Woodcock Ct | 0.69mi | 4/3.0 | 3,740 (+1%) | 21mo | $545,000 | $146 | 29 |
| 7640 Garland | 0.68mi | 4/2.0 | 3,162 (-14%) | 3mo | $308,000 | $97 | 22 |
| 6004 Hickory Ln | 0.68mi | 3/2.5 | 3,268 (-12%) | 10mo | $490,000 | $150 | 21 |
| 59014 Williams Lane Ln | 0.56mi | 4/2.5 | 3,252 (-12%) | 16mo | $368,000 | $113 | 20 |
| 8460 Frederick Dr | 0.64mi | 4/2.5 | 3,200 (-13%) | 16mo | $515,000 | $161 | 14 |
Match score weights: distance 35% · size 25% · config 20% · recency 20%. Top-matched comps best support the ARV.
Projected returns pro-forma
3.0% appreciation · 3.0% rent growth · sell at horizon
- IRR
- -18.3%
- Equity multiple
- -0.07×
- Total profit
- $-194,238
- Equity at exit
- $292,268
- IRR
- -10.5%
- Equity multiple
- -0.70×
- Total profit
- $-309,779
- Equity at exit
- $450,420
Cash invested: $182,000 (down + closing). Projections, not guarantees.
Landlord ↔ Tenant lean methodology
- Overall (STATE)
- 62 Landlord-Friendly
- State Michigan
- 62 Landlord-Friendly · EVEN
- County
- — inherits STATE
- City
- — inherits STATE
ZIP-level market 48094 2779
- Active inventory
- 1
Monthly cashflow live
- Estimated rent
- $0 none
- Mortgage (P&I)
- −$3,409
- Tax from tax record
- −$598 /mo · $7,171/yr
- Insurance
- −$271
- HOA
- −$0
- Vacancy / Maint / Mgmt
- −$0
- Net cashflow
- $-4,277
Break-even live
UW: 25.0% down · 7.5% · 30yr · 1.5% tax · 5.0% vac · 8.0% maint · 8.0% mgmt
Financing live
Cash to close
- Down payment
- $162,500
- Closing costs
- $19,500
- Reserves months
- —
- Total cash needed
- —
Loan-product check · same deal, 3 products live
Conventional
25% down · 7.5% · 30yr
- Down + closing
- —
- Monthly P&I
- —
- Monthly cashflow
- —
- DSCR
- —
- Eligible?
- —
Personal DTI + credit; lowest rate.
DSCR
20% down · 8.5% · 30yr
- Down + closing
- —
- Monthly P&I
- —
- Monthly cashflow
- —
- DSCR
- —
- Eligible?
- —
No personal income docs; deal must DSCR.
Hard money
10% down · 12.0% · 12mo
- Down + closing
- —
- Monthly P&I
- —
- Monthly cashflow
- —
- DSCR
- —
- Eligible?
- —
Short-term bridge; refi at stabilization.
Listing history 3 events
-
2026-06-15days on market $650,000 Coming Soon 3 DOM
-
2026-06-13remarks 699-char remark
-
2026-06-13$650,000 Coming Soon 1 DOM
ⓘ Source: listings_history table (triggers on properties + properties_extension) + one-shot
backfill from property_details.listing_events for pre-trigger history.
Tax reassessment forecast MI · Partial reset (capped growth)
- Current annual tax
- $7,171 · $598/mo
- Projected year-2 tax
- $8,590 · $716/mo
- Expected delta
- +$1,420/yr (+$118/mo · 19.8%)
ⓘ Screening estimate from a state-policy table — verify with the county assessor before closing.
Climate risk First Street
- Flood 1/10 Low FEMA zone X (unshaded) · 0% chance over 30 yrs
- Wildfire 3/10 Moderate
- Heat 2/10 Low 7 d/yr ≥97°F today · 15 d/yr by 30 yrs out
- Wind 1/10 Low
- Air quality 3/10 Moderate 3 unhealthy d/yr today · 3 by 30 yrs out
Nearby sold comps map
Loading sold comps map…
Walkable amenities ~0.75 mi
Loading nearby amenities…
Taxation est. · year 1
- Rental income
- $0
- − Mortgage interest
- −$36,410
- − Property taxes
- −$7,171
- − Insurance
- −$3,250
- − Repairs & maintenance
- −$0
- − Management
- −$0
- − Depreciation
- −$18,909
- Taxable loss
- −$65,740
- Est. tax savings @ 24.0%
- +$15,778
- After-tax cash flow
- $-35,547/yr
For passive investors: Depreciation is non-cash, so a rental often shows a tax loss while cash-flowing — sheltering income. Rental losses are passive: they offset passive income freely, and up to $25,000/yr can offset ordinary (W-2) income if you actively participate and your MAGI is under $100k (phasing out to $0 by $150k); unused losses carry forward. On sale, claimed depreciation is recaptured at up to 25%, and gains may owe capital-gains tax (a 1031 exchange can defer both). Figures are a year-1 estimate at your 24.0% rate — not tax advice; consult a CPA.
Schools (NCES district)
- District
- Romeo Community Schools
- NCES district ID
- 2630090
- Math proficiency
- 43% ▼ -5.00%
- Reading proficiency
- 51% ▼ -8.00%
- Median HH income
- $73,121
- Composite
- 42.48/100
- National rank
- #3212
- State rank
- #102 of 540 in MI
Livability — Rochester Hills
- Score
- 77/100
- State rank
- #127
- US rank
- #3163
Category grades
Schools grade is shown separately in the Schools card above.
Census & demographics
No demographic data for this ZIP.
Market trends
- HPI YoY
- —
- Current HPI
- —
- Rent YoY
- —
- Metro
- —
- State GDP YoY
- ▲ 1.37%
- F500 in state
- 28
Industry mix (Fortune 500 HQ in MI)
| Industry | F500 HQs | Revenue |
|---|---|---|
| Automotive Parts | 3 | $48B |
|
||
| Automotive | 2 | $372B |
|
||
| Chemicals | 1 | $45B |
|
||
| Automotive Retail | 1 | $29B |
|
||
| Healthcare / Medical Devices | 1 | $23B |
|
||
| Automotive Technology | 1 | $20B |
|
||
Price history
+62.5% since first listed51 events — show timeline
- 2026-06-12 Coming Soon $650,000 MiRealSource-MiMLS
- 2026-01-20 Rental Removed $1,400 REALSOURCE
- 2025-12-17 Listed for Rent $1,400 REALSOURCE
- 2018-04-18 Listing Removed — REALCOMP
- 2018-04-18 Listing Removed — MiRealSource-MiMLS
- 2018-04-13 Listed $590,000 MiRealSource-MiMLS
- 2018-04-13 Listed $590,000 REALCOMP
- 2018-03-22 Listing Removed — REALCOMP
- 2018-03-21 Listing Removed — MiRealSource-MiMLS
- 2018-03-18 Price Changed $649,000 MiRealSource-MiMLS
- 2018-03-18 Price Changed $649,000 REALCOMP
- 2018-01-27 Listed $1,200 MiRealSource-MiMLS
- 2018-01-27 Listed $1,200 REALCOMP
- 2017-12-17 Listing Removed — REALCOMP
- 2017-12-17 Listing Removed — MiRealSource-MiMLS
- 2017-12-08 Listed $780,000 MiRealSource-MiMLS
- 2017-12-08 Listed $780,000 REALCOMP
- 2017-07-12 Sold (Public Records) $256,000 Public Records
- 2017-07-07 Sold (MLS) $256,000 MiRealSource-MiMLS
- 2017-07-07 Sold (MLS) $256,000 REALCOMP
- 2017-06-16 Pending — MiRealSource-MiMLS
- 2017-06-16 Pending — REALCOMP
- 2017-06-06 Listed $289,900 MiRealSource-MiMLS
- 2017-06-06 Listed $289,900 REALCOMP
- 2016-11-04 Listing Removed — REALCOMP
- 2016-11-04 Listing Removed — MiRealSource-MiMLS
- 2016-08-24 Relisted — MiRealSource-MiMLS
- 2016-08-24 Relisted — REALCOMP
- 2016-08-16 Pending — MiRealSource-MiMLS
- 2016-08-16 Pending — REALCOMP
- 2016-08-09 Relisted — MiRealSource-MiMLS
- 2016-08-09 Relisted — REALCOMP
- 2016-06-14 Pending — MiRealSource-MiMLS
- 2016-06-14 Pending — REALCOMP
- 2016-05-14 Listed $289,000 MiRealSource-MiMLS
- 2016-05-14 Listed $289,000 REALCOMP
- 2014-03-03 Sold (MLS) $225,000 REALCOMP
- 2014-03-03 Sold (MLS) $225,000 MiRealSource-MiMLS
- 2014-01-29 Listing Removed — MiRealSource-MiMLS
- 2013-02-22 Listed $279,900 REALCOMP
- 2013-02-22 Listed $279,999 MiRealSource-MiMLS
- 2012-12-01 Listing Removed — MiRealSource-MiMLS
- 2012-05-14 Listing Removed — MiRealSource-MiMLS
- 2012-05-14 Listed $299,000 MiRealSource-MiMLS
- 2011-11-30 Listing Removed — MiRealSource-MiMLS
- 2011-11-30 Listed $298,000 MiRealSource-MiMLS
- 2010-11-29 Listed $298,000 MiRealSource-MiMLS
- 2010-08-19 Listing Removed — MiRealSource-MiMLS
- 2010-04-16 Listed $298,000 MiRealSource-MiMLS
- 2007-07-02 Listing Removed — MiRealSource-MiMLS
- 2007-01-18 Listed $399,900 MiRealSource-MiMLS
Property tax history
+3.2%/yrLatest (2025): $7,171 · -0.3% YoY. Source: county tax records.
Cash-flow waterfall
monthlySold comps — $/sqft
last 12 mo · ≤1 miLoading sold comps…