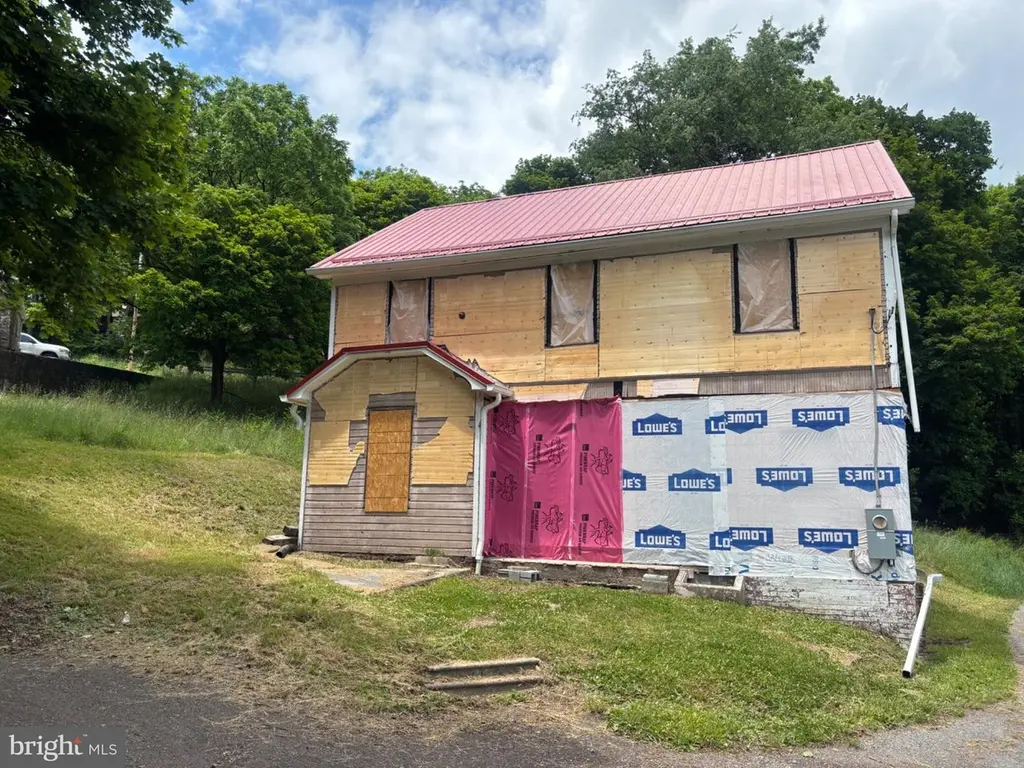
72 Mount Savage Rd NW · Frostburg, MD
Flood risk 1/10 · Minimal
- FEMA flood zone
- X (unshaded)
- Chance of flooding over 30 yrs
- 0.0%
- Est. flood insurance / yr
- $473 – $860
Fire risk 1/10 · Minimal
- Est. fire insurance / yr
- $755 – $1,403
Heat risk 2/10 · Minimal
- Hot days now (above 91°F)
- 7 days/yr
- Hot days in 30 yrs
- 17 days/yr
Wind risk 2/10 · Minimal
- Chance of severe wind over 30 yrs
- 0.0%
Air-quality risk 2/10 · Minimal
- Unhealthy air days now
- 0 days/yr
- Unhealthy air days in 30 yrs
- 1 days/yr
Risk factors via First Street. Map © Google.
Why this score? — see what drove the B- grade
The composite is a weighted blend of 9 inputs, each scored 0–100. Each bar is that input's sub-score; the figure is the points it added to the 100-point composite (weight × sub-score).
- Cash flow +30.0/30.0
- DSCR +10.0/10.0
- 1% rule +8.3/10.0
- ARV discount +7.5/15.0
- Livability +4.4/5.0
- Rent growth +2.5/5.0
- Condition / age +2.5/5.0
- Schools +1.9/10.0
- Appreciation +0.0/10.0
$75,000
🖨 Deal sheet 📄 Offer letter ✓ Due diligence
Listing remarks MLS
MAJOR PRICE DECREASE. The property needs renovated is being offered AS-IS. The utilities have been turned off. Close proximity to Downtown Frostburg and the Great Allegheny Passage's Trailhead. So much potential in this 3 bedroom and 1 full bathroom house. Don't miss this opportunity! Priced to sell. Bring offers. Schedule your appointment online.
Key facts
- 0.44 acre lot
- Built 1920
- Listed 6 days
Property features AI
Finance
- Other: Fee simple ownership
Exterior
- Parking: Off-street parking
- Utilities: Public water; Public sewer
- Home design: Detached property; Estimated year built; Property in need of major rehab
- Construction: Stone foundation; Metal roof; Above-grade and below-grade structures noted
- Exterior features: Paved road access; Located within city limits
Interior
- Bedrooms: 3 bedrooms on main level
- Bathrooms: 2 full bathrooms on main level
- Heating & cooling: Oil heating; Electric hot water
- Interior features: Full basement
Neighborhood map
What this means for you Summary
Snapshot
- This is a 3-bed/1.0-bath single-family listed at $75k.
Deal economics
- At list price, monthly cash flow is $310 ($4k/yr) — positive.
- The deal already cash-flows at list — no discount required.
- Meets the 1% rule at list price ($1k rent vs $75k).
- Cap rate 11.3% vs local median 4.2% in Frostburg — top-decile yield for the area; either an underpriced asset or a hidden risk that comps aren't pricing in. Stress-test before assuming the spread holds.
Location & tenants
- Location reads 87/100 on livability (#7 in MD, #287 nationally) — a professional / high-income tenant draw. Strengths: crime A+, amenities A+, cost of living A+; Watch: employment F.
- Allegany County Public Schools (other): math 15% / reading 30% proficiency, ranked #18 of 24 in MD (top 75%) — low school quality limits family demand, transient renter base, plan for 1-2y turnover.
- Zoned schools: Mount Savage Middle (math 15% / reading 38%, grade F, #86 of 225 statewide, top 40%, 425 students, 54% FRL); Mountain Ridge High School (math 32% / reading 72%, grade D+, #100 of 222 statewide, top 47%, 736 students, 48% FRL) — zoned schools at 51% FRL track the district average.
- Zoned-school proficiency averages 39% at this address vs 22% district-wide (+17 pts) — the actual schools serving this property are materially stronger than the Allegany County Public Schools average implies; a family-tenant draw the district grade alone would hide.
- Market conditions: 102 active listings in the ZIP; 1 comparable units currently listed for rent nearby; 24 units permitted in Allegany County in 2024 (0 in 5+ unit buildings).
Forward outlook
- Local home prices are declining (-3.0%/yr); year-one equity from $519 of loan paydown is wiped out by about $2k of value loss. Plan a longer hold.
- Allegany County population projected at -14% by 2050 — secular population decline; favor cash flow + early exit over multi-decade hold.
- At projected returns (-3.0% appreciation + 3.0% rent growth), your $21k cash investment doubles in ~7 years — after that, you're playing with house money.
Negotiation context
- Only 7 days on market — expect competitive offers; lowballing is unlikely to land.
- 4 sale attempts since 4y ago with the ask held roughly flat each time — persistent listings suggest the price (not the market) is what's stuck; bring a comps-based counter.
- Current owner paid $25k; list at $75k implies a 200% gain — meaningful room to come down on a strong offer.
Risks & watch-outs
- Watch-outs: built in 1920 — expect roof / HVAC / electrical / plumbing capex.
Questions for the listing agent
- Built in 1920 — when were the roof, HVAC, electrical panel, plumbing, and water heater last replaced?
- Is there a deadline driving the sale (1031 exchange, divorce, estate, relocation)? That informs how much negotiation room exists.
- What's the average days-on-market for RENTAL listings here right now (not sales)? A rising rental-DOM trend means longer vacancies and softer asking-rent achievability than the comps imply.
- What's the recent tenant-quality profile in this submarket — average credit score on applications, eviction rate, late-payment / NSF rate, and stable-employment percentage? A property-management company in the area should have these aggregated.
- How much new for-sale + rental construction is in the pipeline within 1–3 miles? Heavy new supply typically softens prices + rents 12–24 months out; constrained supply supports both.
Investment metrics
- 1% rule
- 1.33% ✓
- Cap rate
- 11.26%
- Cash-on-cash
- 17.73%
- DSCR
- 1.79
- GRM
- 6.2
CMA / ARV
- ARV (on-the-fly)
- $187,733
- Comps found
- 10
Show comp detail 10 sales within ~0.75 mi
| Address | Dist | Beds/Ba | Sqft | Sold | Price | $/sf | Match |
|---|---|---|---|---|---|---|---|
| 93 Washington St | 0.58mi | 3/1.5 | 2,080 (+1%) | 2mo | $180,000 | $87 | 68 |
| 256 E Main St | 0.58mi | 3/1.0 | 1,916 (-7%) | 3mo | $199,900 | $104 | 58 |
| 108 Wood St | 0.36mi | 4/1.5 (+1) | 2,303 (+12%) | 7mo | $185,000 | $80 | 51 |
| 76 Spring St | 0.74mi | 3/1.5 | 1,820 (-12%) | 0mo | $182,000 | $100 | 44 |
| 98-100 Bowery St | 0.55mi | 3/1.0 | 2,240 (+9%) | 21mo | $157,500 | $70 | 43 |
| 214 Albert Ave | 0.64mi | 4/2.0 (+1) | 1,806 (-12%) | 6mo | $191,000 | $106 | 36 |
| 73 Hill St | 0.65mi | 4/2.0 (+1) | 2,342 (+14%) | 8mo | $110,000 | $47 | 32 |
| 128 Center St | 0.43mi | 4/2.5 (+1) | 1,800 (-13%) | 20mo | $164,000 | $91 | 31 |
| 103 Frost Ave | 0.45mi | 4/3.0 (+1) | 2,330 (+13%) | 21mo | $382,000 | $164 | 27 |
| 11 High St | 0.63mi | 4/2.0 (+1) | 2,304 (+12%) | 22mo | $115,000 | $50 | 24 |
Match score weights: distance 35% · size 25% · config 20% · recency 20%. Top-matched comps best support the ARV.
Projected returns pro-forma
-3.0% appreciation · 3.0% rent growth · sell at horizon
- IRR
- 9.2%
- Equity multiple
- 1.36×
- Total profit
- $7,595
- Equity at exit
- $11,183
- IRR
- 18.4%
- Equity multiple
- 2.52×
- Total profit
- $32,018
- Equity at exit
- $6,485
Cash invested: $21,000 (down + closing). Projections, not guarantees.
Landlord ↔ Tenant lean methodology
- Overall (STATE)
- 27 Tenant-Leaning
- State Maryland
- 27 Tenant-Leaning · D+14
- County
- — inherits STATE
- City
- — inherits STATE
ZIP-level market 21532
- Home prices YoY
- -24.2%
- Active inventory
- 102
- Price-to-rent
- 6.2×
Monthly cashflow live
- Estimated rent
- $1,000 medium interval (Pro) →
- Mortgage (P&I)
- −$393
- Tax from tax record
- −$55 /mo · $663/yr
- Insurance
- −$31
- HOA
- −$0
- Vacancy / Maint / Mgmt
- −$210
- Net cashflow
- $310
Break-even live
UW: 25.0% down · 7.5% · 30yr · 1.5% tax · 5.0% vac · 8.0% maint · 8.0% mgmt
Financing live
Cash to close
- Down payment
- $18,750
- Closing costs
- $2,250
- Reserves months
- —
- Total cash needed
- —
Loan-product check · same deal, 3 products live
Conventional
25% down · 7.5% · 30yr
- Down + closing
- —
- Monthly P&I
- —
- Monthly cashflow
- —
- DSCR
- —
- Eligible?
- —
Personal DTI + credit; lowest rate.
DSCR
20% down · 8.5% · 30yr
- Down + closing
- —
- Monthly P&I
- —
- Monthly cashflow
- —
- DSCR
- —
- Eligible?
- —
No personal income docs; deal must DSCR.
Hard money
10% down · 12.0% · 12mo
- Down + closing
- —
- Monthly P&I
- —
- Monthly cashflow
- —
- DSCR
- —
- Eligible?
- —
Short-term bridge; refi at stabilization.
Rent comps 1 comps
| Address | Beds | Baths | Sqft | Rent | $/sqft | DOM | Units | Dist |
|---|---|---|---|---|---|---|---|---|
| 2 Bob Cat Ct Frostburg, MD | 2.0–4.0 | 1.0–2.0 | 965 | $1,000 | $1.04 | 43d | 6 | 0.75mi |
Listing history 7 events
-
2026-06-19days on market $75,000 Active 7 DOM
-
2026-06-18days on market $75,000 Active 6 DOM
-
2026-06-17days on market $75,000 Active 5 DOM
-
2026-06-16days on market $75,000 Active 4 DOM
-
2026-06-15days on market $75,000 Active 3 DOM
-
2026-06-13remarks 591-char remark
-
2026-06-13$75,000 Active 1 DOM
ⓘ Source: listings_history table (triggers on properties + properties_extension) + one-shot
backfill from property_details.listing_events for pre-trigger history.
Tax reassessment forecast MD · Partial reset (capped growth)
- Current annual tax
- $663 · $55/mo
- Projected year-2 tax
- $740 · $62/mo
- Expected delta
- +$77/yr (+$6/mo · 11.7%)
ⓘ Screening estimate from a state-policy table — verify with the county assessor before closing.
Climate risk First Street
- Flood 1/10 Low FEMA zone X (unshaded) · 0% chance over 30 yrs
- Wildfire 1/10 Low
- Heat 2/10 Low 7 d/yr ≥91°F today · 17 d/yr by 30 yrs out
- Wind 2/10 Low 0% chance of damaging wind over 30 yrs
- Air quality 2/10 Low 0 unhealthy d/yr today · 1 by 30 yrs out
Nearby sold comps map
Loading sold comps map…
Walkable amenities ~0.75 mi
Loading nearby amenities…
Taxation est. · year 1
- Rental income
- $12,000
- − Mortgage interest
- −$4,201
- − Property taxes
- −$663
- − Insurance
- −$375
- − Repairs & maintenance
- −$960
- − Management
- −$960
- − Depreciation
- −$2,182
- Taxable income
- $2,659
- Est. tax owed @ 24.0%
- −$638
- After-tax cash flow
- $3,084/yr
For passive investors: Depreciation is non-cash, so a rental often shows a tax loss while cash-flowing — sheltering income. Rental losses are passive: they offset passive income freely, and up to $25,000/yr can offset ordinary (W-2) income if you actively participate and your MAGI is under $100k (phasing out to $0 by $150k); unused losses carry forward. On sale, claimed depreciation is recaptured at up to 25%, and gains may owe capital-gains tax (a 1031 exchange can defer both). Figures are a year-1 estimate at your 24.0% rate — not tax advice; consult a CPA.
Schools (NCES district)
- District
- Allegany County Public Schools
- NCES district ID
- 2400030
- Math proficiency
- 15% ▼ -26.00%
- Reading proficiency
- 30% ▼ -20.00%
- Median HH income
- $39,760
- Composite
- 18.95/100
- National rank
- #8854
- State rank
- #18 of 24 in MD
Livability — Frostburg
- Score
- 87/100
- State rank
- #7
- US rank
- #287
Category grades
Schools grade is shown separately in the Schools card above.
Census & demographics
- Census place
- Frostburg, MD
- Population (ZIP)
- 13,123
Population outlook (Allegany County) Hauer SSP2
- Today (2025)
- 68,778 people
- By 2030
- 66,766 · -2.9%
- By 2040
- 62,784 · -8.7%
- By 2050
- 59,179 · -14.0%
- By 2075
- 50,732 · -26.2%
- By 2100
- 40,837 · -40.6%
Race, ethnicity, and origin ACS 2023
- Neighborhood character
- Predominantly White (89%)
- Race & ethnicity
- White 89% Black 6% Two or more races 2% Hispanic / Latino 2% Asian 2%
- Common ancestry
- Slovak 5% Romanian 2% Italian 1%
- Foreign-born
- 3% · Canada, China
- Languages at home
- 96% English-only · Spanish 2% Chinese 1%
Political lean MEDSL · Allegany
- 2024 margin
- Solid R (+40.3) · D 28.9% · R 69.2% · Other 2.0%
- 2008→2024 swing
- -14.4pp toward R · 2008: -25.9pp · 2024: -40.3pp
- All cycles
- 2024: R+40.3 2020: R+38.3 2016: R+48.0 2012: R+32.9 2008: R+25.9
Not yet ingested
- Civics
- —
Market trends
- HPI YoY
- ▼ -78.31%
- Current HPI
- 244.5937
- Rent YoY
- —
- Metro
- —
- State GDP YoY
- ▲ 2.97%
- F500 in state
- 12
Industry mix (Fortune 500 HQ in MD)
| Industry | F500 HQs | Revenue |
|---|---|---|
| Aerospace / Defense | 1 | $71B |
|
||
| Utilities | 1 | $25B |
|
||
| Hotels | 1 | $24B |
|
||
| Consumer Goods | 1 | $7B |
|
||
| Real Estate | 1 | $6B |
|
||
| Chemicals | 1 | $2B |
|
||
Price history
+127.3% since first listed14 events — show timeline
- 2026-06-12 Listed $75,000 BRIGHT MLS
- 2022-12-08 Sold (MLS) $25,000 BRIGHT MLS
- 2022-11-08 Contingent — BRIGHT MLS
- 2022-09-07 Price Changed $48,500 BRIGHT MLS
- 2022-08-11 Relisted — BRIGHT MLS
- 2022-08-08 Contingent — BRIGHT MLS
- 2022-07-17 Price Changed $54,900 BRIGHT MLS
- 2022-06-16 Price Changed $64,900 BRIGHT MLS
- 2022-05-12 Price Changed $89,900 BRIGHT MLS
- 2022-04-20 Relisted — BRIGHT MLS
- 2022-04-07 Contingent — BRIGHT MLS
- 2022-03-18 Listed $99,000 BRIGHT MLS
- 2011-03-03 Sold (Public Records) $42,000 Public Records
- 2002-02-04 Sold (Public Records) $33,000 Public Records
Property tax history
+2.2%/yrLatest (2025): $663 · -1.5% YoY. Source: county tax records.
Cash-flow waterfall
monthlySold comps — $/sqft
last 12 mo · ≤1 miLoading sold comps…