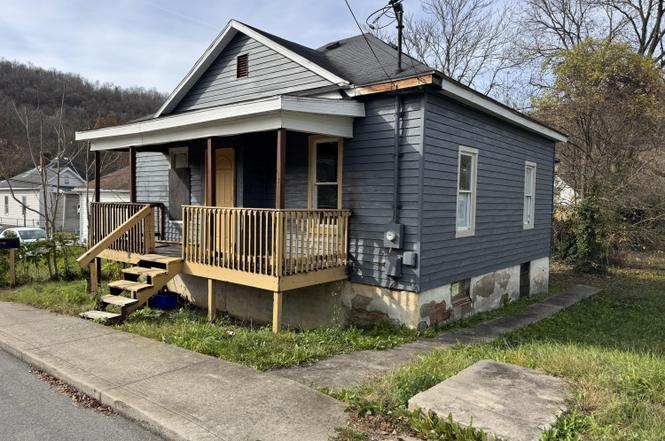
512 Jessie St · Clarksburg, WV
Flood risk 4/10 · Minor
- FEMA flood zone
- X (unshaded)
- Chance of flooding over 30 yrs
- 0.22%
- Est. flood insurance / yr
- $507 – $1,088
Fire risk 1/10 · Minimal
- Est. fire insurance / yr
- $787 – $1,461
Heat risk 4/10 · Minor
- Hot days now (above 97°F)
- 7 days/yr
- Hot days in 30 yrs
- 20 days/yr
Wind risk 1/10 · Minimal
- Chance of severe wind over 30 yrs
- 1.0%
Air-quality risk 2/10 · Minimal
- Unhealthy air days now
- 0 days/yr
- Unhealthy air days in 30 yrs
- 1 days/yr
Risk factors via First Street. Map © Google.
Why this score? — see what drove the D+ grade
The composite is a weighted blend of 9 inputs, each scored 0–100. Each bar is that input's sub-score; the figure is the points it added to the 100-point composite (weight × sub-score).
- Cash flow +15.0/30.0
- ARV discount +7.5/15.0
- 1% rule +5.0/10.0
- DSCR +5.0/10.0
- Livability +4.0/5.0
- Rent growth +3.4/5.0
- Schools +3.0/10.0
- Condition / age +2.5/5.0
- Appreciation +0.0/10.0
$15,900
🖨 Deal sheet 📄 Offer letter ✓ Due diligence
Listing remarks
Clarksburg, 2 bedroom 1 bath home, basement, needs rehab
Key facts
- Listed 283 days
Property features AI
Exterior
- Home design: Residential property
- Construction: Concrete perimeter foundation; Built with wood construction
- Exterior features: Wood and shingle roof
Interior
- Flooring: Hardwood
- Bathrooms: 1 full bathroom
- Heating & cooling: No heating; No cooling
- Interior features: Hardwood flooring; Total of 4 rooms
Neighborhood map
What this means for you Summary
Snapshot
- This is a 2-bed/1.0-bath single-family listed at $16k.
Deal economics
- At list price, monthly cash flow is $675 ($8k/yr) — positive.
- The deal already cash-flows at list — no discount required.
- Meets the 1% rule at list price ($993 rent vs $16k).
- Recommended offer: $14k (12.0% below list) — sets the bar for market timing.
- Cap rate 57.2% vs local median 6.8% in Clarksburg — top-decile yield for the area; either an underpriced asset or a hidden risk that comps aren't pricing in. Stress-test before assuming the spread holds.
Location & tenants
- Location reads 81/100 on livability (#11 in WV, #1,521 nationally) — a professional / high-income tenant draw. Strengths: commute A+, cost of living A+, housing A+; Watch: amenities C-, crime D+, schools F.
- Harrison County Schools (town): math 29% / reading 43% proficiency, ranked #12 of 55 in WV (top 22%) — families likely to look elsewhere, expect single-tenant / working-renter base with shorter leases.
- Market conditions: Rents rising (+3.6%/yr); 56 active listings in the ZIP; 84 units permitted in Harrison County in 2024 (5 in 5+ unit buildings).
Forward outlook
- Local home prices are declining (-3.0%/yr); year-one equity from $110 of loan paydown is wiped out by about $477 of value loss. Plan a longer hold.
- Harrison County population projected at -11% by 2050 — secular population decline; favor cash flow + early exit over multi-decade hold.
- At projected returns (-3.0% appreciation + 3.6% rent growth), your $4k cash investment doubles in ~1 year — after that, you're playing with house money.
Negotiation context
- It's been on market 284 days — a 12% lower offer ($14k) is reasonable based on typical stale-listing flexibility.
Risks & watch-outs
- Watch-outs: built in 1910 — expect roof / HVAC / electrical / plumbing capex.
Questions for the listing agent
- It's been on market 284 days. Have you received any prior offers? Is the seller open to a 12% concession, seller financing, or rate buy-down credit?
- Built in 1910 — when were the roof, HVAC, electrical panel, plumbing, and water heater last replaced?
- Why hasn't it sold? Are there any deal-killer items the seller is aware of (foundation, flood, title, zoning, code violations)?
- Is there a deadline driving the sale (1031 exchange, divorce, estate, relocation)? That informs how much negotiation room exists.
- Schools are F-rated, which usually means shorter tenancies and higher turnover. Who's the typical renter profile here, and what's been the actual vacancy rate?
- Crime grade is D in this area — have there been break-ins, vandalism, or insurance claims at this property in the last 3 years? What carrier currently insures it and at what premium?
- The area grade is low — what's the realistic commute time and amenity access for the typical tenant pool here? Any planned neighborhood developments (good or bad) we should know about?
- What's the average days-on-market for RENTAL listings here right now (not sales)? A rising rental-DOM trend means longer vacancies and softer asking-rent achievability than the comps imply.
- What's the recent tenant-quality profile in this submarket — average credit score on applications, eviction rate, late-payment / NSF rate, and stable-employment percentage? A property-management company in the area should have these aggregated.
- How much new for-sale + rental construction is in the pipeline within 1–3 miles? Heavy new supply typically softens prices + rents 12–24 months out; constrained supply supports both.
Investment metrics
- 1% rule
- 6.25% ✓
- Cap rate
- 57.24%
- Cash-on-cash
- 181.97%
- DSCR
- 9.10
- GRM
- 1.3
CMA / ARV
- ARV (on-the-fly)
- $98,624
- Comps found
- 6
Show comp detail 6 sales within ~0.75 mi
| Address | Dist | Beds/Ba | Sqft | Sold | Price | $/sf | Match |
|---|---|---|---|---|---|---|---|
| 138 Austin Ave | 0.24mi | 2/1.0 | 748 (+2%) | 3mo | $32,500 | $43 | 84 |
| 416 Haymond Hwy | 0.37mi | 2/1.0 | 732 (-0%) | 16mo | $98,000 | $134 | 68 |
| 128 Vermont Ave | 0.37mi | 2/1.0 | 798 (+8%) | 16mo | $120,000 | $150 | 55 |
| 213 Point St | 0.25mi | 3/1.0 (+1) | 816 (+11%) | 13mo | $104,900 | $129 | 54 |
| 132 Oakland Ave | 0.63mi | 3/1.0 (+1) | 768 (+4%) | 17mo | $120,000 | $156 | 45 |
| 607 S 5th St | 0.44mi | 2/1.0 | 824 (+12%) | 22mo | $62,000 | $75 | 41 |
Match score weights: distance 35% · size 25% · config 20% · recency 20%. Top-matched comps best support the ARV.
Projected returns pro-forma
-3.0% appreciation · 3.62% rent growth · sell at horizon
- IRR
- —
- Equity multiple
- 10.22×
- Total profit
- $41,059
- Equity at exit
- $2,371
- IRR
- —
- Equity multiple
- 22.06×
- Total profit
- $93,771
- Equity at exit
- $1,375
Cash invested: $4,452 (down + closing). Projections, not guarantees.
Landlord ↔ Tenant lean methodology
- Overall (STATE)
- 83 Strongly Landlord-Friendly
- State West Virginia
- 83 Strongly Landlord-Friendly · R+22
- County
- — inherits STATE
- City
- — inherits STATE
ZIP-level market 26301
- Home prices YoY
- -26.4%
- Rents YoY
- 3.6%
- Active inventory
- 56
- Price-to-rent
- 1.3×
Monthly cashflow live
- Estimated rent
- $993 medium interval (Pro) →
- Mortgage (P&I)
- −$83
- Tax from tax record
- −$20 /mo · $235/yr
- Insurance
- −$7
- HOA
- −$0
- Vacancy / Maint / Mgmt
- −$209
- Net cashflow
- $675
Break-even live
UW: 25.0% down · 7.5% · 30yr · 1.5% tax · 5.0% vac · 8.0% maint · 8.0% mgmt
Financing live
Cash to close
- Down payment
- $3,975
- Closing costs
- $477
- Reserves months
- —
- Total cash needed
- —
Loan-product check · same deal, 3 products live
Conventional
25% down · 7.5% · 30yr
- Down + closing
- —
- Monthly P&I
- —
- Monthly cashflow
- —
- DSCR
- —
- Eligible?
- —
Personal DTI + credit; lowest rate.
DSCR
20% down · 8.5% · 30yr
- Down + closing
- —
- Monthly P&I
- —
- Monthly cashflow
- —
- DSCR
- —
- Eligible?
- —
No personal income docs; deal must DSCR.
Hard money
10% down · 12.0% · 12mo
- Down + closing
- —
- Monthly P&I
- —
- Monthly cashflow
- —
- DSCR
- —
- Eligible?
- —
Short-term bridge; refi at stabilization.
Listing history 24 events
-
2026-06-19days on market $15,900 Active 284 DOM
-
2026-06-18days on market $15,900 Active 283 DOM
-
2026-06-17days on market $15,900 Active 282 DOM
-
2026-06-16days on market $15,900 Active 281 DOM
-
2026-06-15days on market $15,900 Active 280 DOM
-
2026-06-14days on market $15,900 Active 278 DOM
-
2026-06-12days on market $15,900 Active 277 DOM
-
2026-06-09days on market $15,900 Active 274 DOM
-
2026-06-08days on market $15,900 Active 273 DOM
-
2026-06-07days on market $15,900 Active 272 DOM
-
2026-06-05days on market $15,900 Active 269 DOM
-
2026-06-03days on market $15,900 Active 268 DOM
-
2026-06-02days on market $15,900 Active 267 DOM
-
2026-06-01days on market $15,900 Active 266 DOM
-
2026-05-31days on market $15,900 Active 265 DOM
-
2026-05-30days on market $15,900 Active 264 DOM
-
2026-04-30price $15,900
-
2026-03-21price $16,900
-
2026-02-13price $17,900
-
2026-01-01price $18,900
-
2025-12-09price $19,900
-
2025-11-10price $23,900
-
2025-09-25price $25,900
-
2025-09-08$29,900 Active
ⓘ Source: listings_history table (triggers on properties + properties_extension) + one-shot
backfill from property_details.listing_events for pre-trigger history.
Tax reassessment forecast WV · Resets to sale price
- Current annual tax
- $235 · $20/mo
- Projected year-2 tax
- $235 · $20/mo
- Expected delta
- $0/yr ($0/mo · 0.0%)
ⓘ Screening estimate from a state-policy table — verify with the county assessor before closing.
Climate risk First Street
- Flood 4/10 Moderate FEMA zone X (unshaded) · 22% chance over 30 yrs
- Wildfire 1/10 Low
- Heat 4/10 Moderate 7 d/yr ≥97°F today · 20 d/yr by 30 yrs out
- Wind 1/10 Low 100% chance of damaging wind over 30 yrs
- Air quality 2/10 Low 0 unhealthy d/yr today · 1 by 30 yrs out
Nearby sold comps map
Loading sold comps map…
Walkable amenities ~0.75 mi
Loading nearby amenities…
Taxation est. · year 1
- Rental income
- $11,919
- − Mortgage interest
- −$891
- − Property taxes
- −$235
- − Insurance
- −$80
- − Repairs & maintenance
- −$954
- − Management
- −$954
- − Depreciation
- −$463
- Taxable income
- $8,345
- Est. tax owed @ 24.0%
- −$2,003
- After-tax cash flow
- $6,099/yr
For passive investors: Depreciation is non-cash, so a rental often shows a tax loss while cash-flowing — sheltering income. Rental losses are passive: they offset passive income freely, and up to $25,000/yr can offset ordinary (W-2) income if you actively participate and your MAGI is under $100k (phasing out to $0 by $150k); unused losses carry forward. On sale, claimed depreciation is recaptured at up to 25%, and gains may owe capital-gains tax (a 1031 exchange can defer both). Figures are a year-1 estimate at your 24.0% rate — not tax advice; consult a CPA.
Schools (NCES district)
- District
- Harrison County Schools
- NCES district ID
- 5400510
- Math proficiency
- 29% ▼ -10.00%
- Reading proficiency
- 43% ▼ -3.00%
- Median HH income
- $43,269
- Composite
- 30.48/100
- National rank
- #6222
- State rank
- #12 of 55 in WV
Livability — Clarksburg
- Score
- 81/100
- State rank
- #11
- US rank
- #1521
Category grades
Schools grade is shown separately in the Schools card above.
Census & demographics
- Census place
- Clarksburg, WV
- County
- Harrison County · 44,316 people
- City population
- 28,716
- Metro
- Clarksburg, WV
- Population (ZIP)
- 28,716
- Household income
- $49,816
- Rent vs Own
- Severe rent burden
- 765.0
Population outlook (Harrison County) Hauer SSP2
- Today (2025)
- 67,273 people
- By 2030
- 65,963 · -1.9%
- By 2040
- 63,033 · -6.3%
- By 2050
- 59,999 · -10.8%
- By 2075
- 52,524 · -21.9%
- By 2100
- 42,654 · -36.6%
Race, ethnicity, and origin ACS 2023
- Neighborhood character
- Predominantly White (92%)
- Race & ethnicity
- White 92% Two or more races 5% Hispanic / Latino 2% Black 2%
- Common ancestry
- Slovak 2% Serbian 2% Lithuanian 1%
- Foreign-born
- 0%
- Languages at home
- 98% English-only · Other Indo-European 1%
Political lean MEDSL · Harrison
- 2024 margin
- Solid R (+41.0) · D 28.5% · R 69.4% · Other 2.1%
- 2008→2024 swing
- -27.6pp toward R · 2008: -13.3pp · 2024: -41.0pp
- All cycles
- 2024: R+41.0 2020: R+37.6 2016: R+39.5 2012: R+23.5 2008: R+13.3
Not yet ingested
- Civics
- —
Market trends
- HPI YoY
- ▼ -53.70%
- Current HPI
- 149.308
- Rent YoY
- ▲ 3.62%
- Metro
- Clarksburg, WV
- State GDP YoY
- —
- F500 in state
- 0
Price history
-46.8% since first listed8 events — show timeline
- 2026-04-30 Price Changed $15,900 GVBOR
- 2026-03-21 Price Changed $16,900 GVBOR
- 2026-02-13 Price Changed $17,900 GVBOR
- 2026-01-01 Price Changed $18,900 GVBOR
- 2025-12-09 Price Changed $19,900 GVBOR
- 2025-11-10 Price Changed $23,900 GVBOR
- 2025-09-25 Price Changed $25,900 GVBOR
- 2025-09-08 Listed $29,900 GVBOR
Property tax history
+20.6%/yrLatest (2025): $235 · +7.1% YoY. Source: county tax records.
Cash-flow waterfall
monthlySold comps — $/sqft
last 12 mo · ≤1 miLoading sold comps…