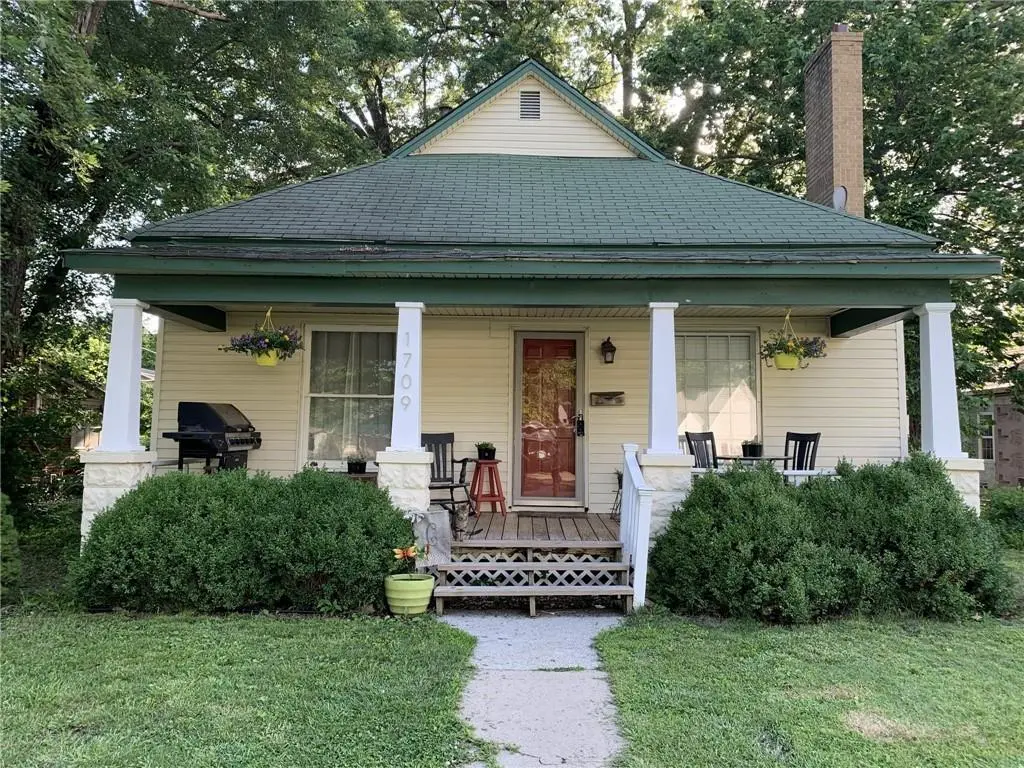
1709 N Joplin St · Pittsburg, KS
Flood risk 1/10 · Minimal
- FEMA flood zone
- X (unshaded)
- Chance of flooding over 30 yrs
- 0.0%
- Est. flood insurance / yr
- $507 – $1,088
Fire risk 3/10 · Minor
- Est. fire insurance / yr
- $1,154 – $2,142
Heat risk 5/10 · Moderate
- Hot days now (above 108°F)
- 7 days/yr
- Hot days in 30 yrs
- 19 days/yr
Wind risk 2/10 · Minimal
- Chance of severe wind over 30 yrs
- 2.0%
Air-quality risk 2/10 · Minimal
- Unhealthy air days now
- 1 days/yr
- Unhealthy air days in 30 yrs
- 1 days/yr
Risk factors via First Street. Map © Google.
Why this score? — see what drove the C grade
The composite is a weighted blend of 9 inputs, each scored 0–100. Each bar is that input's sub-score; the figure is the points it added to the 100-point composite (weight × sub-score).
- Cash flow +26.4/30.0
- DSCR +9.0/10.0
- 1% rule +6.4/10.0
- Rent growth +5.0/5.0
- Livability +3.3/5.0
- Schools +2.5/10.0
- Condition / age +2.5/5.0
- ARV discount +0.0/15.0
- Appreciation +0.0/10.0
$125,000
🖨 Deal sheet 📄 Offer letter ✓ Due diligence
Listing remarks MLS
Charming bungalow located close to schools and shopping. Recent updates include new windows, roof, water heater, some plumbing and electrical, kitchen flooring, ductwork, sump pump, and garage door opener. The kitchen and back porch were also upgraded. Original wood floors. Wood-burning fireplace. This home is move-in ready.
Key facts
- 0.23 acre lot
- 2 garage spots
- Built 1920
Neighborhood map
What this means for you Summary
Snapshot
- This is a 3-bed/1.0-bath single-family listed at $125k.
Deal economics
- At list price, monthly cash flow is $326 ($4k/yr) — positive.
- The deal already cash-flows at list — no discount required.
- Meets the 1% rule at list price ($1k rent vs $125k).
- Recommended offer: $118k (6.0% below list) — sets the bar for market timing.
- Cap rate 9.4% vs local median 5.4% in Pittsburg — top-decile yield for the area; either an underpriced asset or a hidden risk that comps aren't pricing in. Stress-test before assuming the spread holds.
Location & tenants
- Location reads 66/100 on livability (#270 in KS) — a middle-class / working-renter tenant base. Strengths: cost of living A+, housing A, health & safety A; Watch: schools D, crime F, amenities F.
- Pittsburg (town): math 29% / reading 31% proficiency, ranked #111 of 169 in KS (top 66%) — families likely to look elsewhere, expect single-tenant / working-renter base with shorter leases.
- Market conditions: Rents rising fast (+13.8%/yr); 139 active listings in the ZIP; 4 comparable units currently listed for rent nearby; rentals lingering (median 44d on market — plan ~5-8 weeks vacancy on turnover, expect pricing pressure); 100% of comp listings sitting > 30 days — soft ceiling on asking rent; 65 units permitted in Crawford County in 2024 (0 in 5+ unit buildings).
- This rent runs 34% of the median local income ($51k/yr) — at the standard rent-burdened threshold; future hikes will face affordability resistance.
Forward outlook
- Local home prices are declining (-3.0%/yr); year-one equity from $864 of loan paydown is wiped out by about $4k of value loss. Plan a longer hold.
- At projected returns (-3.0% appreciation + 8.0% rent growth), your $35k cash investment doubles in ~7 years — after that, you're playing with house money.
Negotiation context
- It's been on market 85 days — a 6% lower offer ($118k) is reasonable based on typical stale-listing flexibility.
- 2 sale attempts with the ask held roughly flat each time — persistent listings suggest the price (not the market) is what's stuck; bring a comps-based counter.
- Current owner paid $39k; list at $125k implies a 221% gain — meaningful room to come down on a strong offer.
Risks & watch-outs
- Watch-outs: built in 1920 — expect roof / HVAC / electrical / plumbing capex.
- Climate carrying-cost: extreme-heat days projected 7→19/yr by 2055 (HVAC capex compounding) — expect insurance premiums to compound above CPI over the hold.
Questions for the listing agent
- It's been on market 85 days. Have you received any prior offers? Is the seller open to a 6% concession, seller financing, or rate buy-down credit?
- Built in 1920 — when were the roof, HVAC, electrical panel, plumbing, and water heater last replaced?
- Why hasn't it sold? Are there any deal-killer items the seller is aware of (foundation, flood, title, zoning, code violations)?
- Is there a deadline driving the sale (1031 exchange, divorce, estate, relocation)? That informs how much negotiation room exists.
- Schools are D-rated, which usually means shorter tenancies and higher turnover. Who's the typical renter profile here, and what's been the actual vacancy rate?
- Crime grade is F in this area — have there been break-ins, vandalism, or insurance claims at this property in the last 3 years? What carrier currently insures it and at what premium?
- What's the average days-on-market for RENTAL listings here right now (not sales)? A rising rental-DOM trend means longer vacancies and softer asking-rent achievability than the comps imply.
- What's the recent tenant-quality profile in this submarket — average credit score on applications, eviction rate, late-payment / NSF rate, and stable-employment percentage? A property-management company in the area should have these aggregated.
- How much new for-sale + rental construction is in the pipeline within 1–3 miles? Heavy new supply typically softens prices + rents 12–24 months out; constrained supply supports both.
Investment metrics
- 1% rule
- 1.14% ✓
- Cap rate
- 9.42%
- Cash-on-cash
- 11.18%
- DSCR
- 1.50
- GRM
- 7.3
CMA / ARV
- ARV (median comp)
- $99,619
- List price
- $125,000
- Delta
- 25.48%
- Verdict
- OVERPRICED
- Comps
- 20 within 1.0 mi
Show comp detail 12 sales within ~0.75 mi
| Address | Dist | Beds/Ba | Sqft | Sold | Price | $/sf | Match |
|---|---|---|---|---|---|---|---|
| 1906 N Smelter St | 0.21mi | 3/1.0 | 1,120 (0%) | 1mo | $117,500 | $105 | 89 |
| 1811 N Michigan N/A | 0.23mi | 3/1.5 | 1,152 (+3%) | 2mo | $139,900 | $121 | 81 |
| 211 E 21st St | 0.23mi | 2/1.0 (-1) | 1,104 (-1%) | 4mo | $45,000 | $41 | 79 |
| 205 W 18th St | 0.35mi | 3/1.0 | 1,080 (-4%) | 1mo | $125,000 | $116 | 77 |
| 101 E 22nd St | 0.35mi | 3/2.0 | 1,085 (-3%) | 7mo | $68,000 | $63 | 68 |
| 409 E 8th St | 0.58mi | 3/1.0 | 1,088 (-3%) | 5mo | $115,000 | $106 | 64 |
| 801 E 9th St | 0.66mi | 3/1.0 | 1,152 (+3%) | 4mo | $62,500 | $54 | 61 |
| 406 E 8th St | 0.61mi | 2/1.0 (-1) | 1,131 (+1%) | 5mo | $79,900 | $71 | 61 |
| 210 E 21st St | 0.20mi | 2/2.0 (-1) | 1,237 (+10%) | 5mo | $93,000 | $75 | 60 |
| 909 E 13th St | 0.64mi | 2/2.0 (-1) | 1,224 (+9%) | 2mo | $120,000 | $98 | 44 |
| 1002 E 13th St | 0.74mi | 2/1.0 (-1) | 988 (-12%) | 0mo | $25,000 | $25 | 41 |
| 605 E 27th St | 0.66mi | 3/1.5 | 1,268 (+13%) | 6mo | $164,900 | $130 | 40 |
Match score weights: distance 35% · size 25% · config 20% · recency 20%. Top-matched comps best support the ARV.
Projected returns pro-forma
-3.0% appreciation · 8.0% rent growth · sell at horizon
- IRR
- 5.6%
- Equity multiple
- 1.23×
- Total profit
- $8,032
- Equity at exit
- $18,638
- IRR
- 19.0%
- Equity multiple
- 2.94×
- Total profit
- $67,937
- Equity at exit
- $10,808
Cash invested: $35,000 (down + closing). Projections, not guarantees.
Landlord ↔ Tenant lean methodology
- Overall (STATE)
- 83 Strongly Landlord-Friendly
- State Kansas
- 83 Strongly Landlord-Friendly · R+10
- County
- — inherits STATE
- City
- — inherits STATE
ZIP-level market 66762
- Rents YoY
- 13.8%
- Active inventory
- 139
- Price-to-rent
- 7.3×
Monthly cashflow live
- Estimated rent
- $1,425 medium interval (Pro) →
- Mortgage (P&I)
- −$656
- Tax from tax record
- −$92 /mo · $1,099/yr
- Insurance
- −$52
- HOA
- −$0
- Vacancy / Maint / Mgmt
- −$299
- Net cashflow
- $326
Break-even live
UW: 25.0% down · 7.5% · 30yr · 1.5% tax · 5.0% vac · 8.0% maint · 8.0% mgmt
Financing live
Cash to close
- Down payment
- $31,250
- Closing costs
- $3,750
- Reserves months
- —
- Total cash needed
- —
Loan-product check · same deal, 3 products live
Conventional
25% down · 7.5% · 30yr
- Down + closing
- —
- Monthly P&I
- —
- Monthly cashflow
- —
- DSCR
- —
- Eligible?
- —
Personal DTI + credit; lowest rate.
DSCR
20% down · 8.5% · 30yr
- Down + closing
- —
- Monthly P&I
- —
- Monthly cashflow
- —
- DSCR
- —
- Eligible?
- —
No personal income docs; deal must DSCR.
Hard money
10% down · 12.0% · 12mo
- Down + closing
- —
- Monthly P&I
- —
- Monthly cashflow
- —
- DSCR
- —
- Eligible?
- —
Short-term bridge; refi at stabilization.
Rent comps 4 comps
| Address | Beds | Baths | Sqft | Rent | $/sqft | DOM | Units | Dist |
|---|---|---|---|---|---|---|---|---|
| 544 E 23rd St Pittsburg, KS | 3.0 | 2.0 | 1190 | $1,800 | $1.51 | 43d | 1 | 0.41mi |
| 1019 E 15th St Pittsburg, KS | 3.0 | 1.0 | 1222 | $1,050 | $0.86 | 43d | 1 | 0.77mi |
| 511 W 2nd St Pittsburg, KS | 2.0 | 1.0 | 846 | $850 | $1.00 | 43d | 1 | 1.21mi |
| 102 Creekside Way Pittsburg, KS | 2.0 | 2.0 | 1450 | $2,000 | $1.38 | 43d | 2 | 1.38mi |
Listing history 25 events
-
2026-06-19days on market $125,000 Active 85 DOM
-
2026-06-18days on market $125,000 Active 84 DOM
-
2026-06-17days on market $125,000 Active 83 DOM
-
2026-06-16days on market $125,000 Active 82 DOM
-
2026-06-15days on market $125,000 Active 81 DOM
-
2026-06-14days on market $125,000 Active 79 DOM
-
2026-06-13days on market $125,000 Active 78 DOM
-
2026-06-10days on market $125,000 Active 76 DOM
-
2026-06-09days on market $125,000 Active 75 DOM
-
2026-06-08days on market $125,000 Active 74 DOM
-
2026-06-07days on market $125,000 Active 73 DOM
-
2026-06-05days on market $125,000 Active 70 DOM
-
2026-06-03days on market $125,000 Active 69 DOM
-
2026-06-02days on market $125,000 Active 68 DOM
-
2026-06-01days on market $125,000 Active 67 DOM
-
2026-05-31days on market $125,000 Active 66 DOM
-
2026-05-30days on market $125,000 Active 65 DOM
-
2026-03-26$125,000 Active 326-char remark
Show marketing remark (326 chars)
Charming bungalow located close to schools and shopping. Recent updates include new windows, roof, water heater, some plumbing and electrical, kitchen flooring, ductwork, sump pump, and garage door opener. The kitchen and back porch were also upgraded. Original wood floors. Wood-burning fireplace. This home is move-in ready.
-
2025-10-20historical
-
2025-06-12price $134,500
-
2025-03-31$137,000 Active
-
2019-08-20soldstatus
-
2006-07-01soldstatus $39,000
-
2000-05-01soldstatus $15,000
-
1992-04-01soldstatus $6,900
ⓘ Source: listings_history table (triggers on properties + properties_extension) + one-shot
backfill from property_details.listing_events for pre-trigger history.
Tax reassessment forecast KS · Resets to sale price
- Current annual tax
- $1,099 · $92/mo
- Projected year-2 tax
- $1,762 · $147/mo
- Expected delta
- +$664/yr (+$55/mo · 60.4%)
ⓘ Screening estimate from a state-policy table — verify with the county assessor before closing.
Climate risk First Street
- Flood 1/10 Low FEMA zone X (unshaded) · 0% chance over 30 yrs
- Wildfire 3/10 Moderate
- Heat 5/10 Major 7 d/yr ≥108°F today · 19 d/yr by 30 yrs out
- Wind 2/10 Low 2% chance of damaging wind over 30 yrs
- Air quality 2/10 Low 1 unhealthy d/yr today · 1 by 30 yrs out
Nearby sold comps map
Loading sold comps map…
Walkable amenities ~0.75 mi
Loading nearby amenities…
Taxation est. · year 1
- Rental income
- $17,094
- − Mortgage interest
- −$7,002
- − Property taxes
- −$1,099
- − Insurance
- −$625
- − Repairs & maintenance
- −$1,368
- − Management
- −$1,368
- − Depreciation
- −$3,636
- Taxable income
- $1,997
- Est. tax owed @ 24.0%
- −$479
- After-tax cash flow
- $3,435/yr
For passive investors: Depreciation is non-cash, so a rental often shows a tax loss while cash-flowing — sheltering income. Rental losses are passive: they offset passive income freely, and up to $25,000/yr can offset ordinary (W-2) income if you actively participate and your MAGI is under $100k (phasing out to $0 by $150k); unused losses carry forward. On sale, claimed depreciation is recaptured at up to 25%, and gains may owe capital-gains tax (a 1031 exchange can defer both). Figures are a year-1 estimate at your 24.0% rate — not tax advice; consult a CPA.
Schools (NCES district)
- District
- Pittsburg
- NCES district ID
- 2010710
- Math proficiency
- 29% ▼ -5.00%
- Reading proficiency
- 31% ▼ -4.00%
- Median HH income
- $33,608
- Composite
- 24.63/100
- National rank
- #7629
- State rank
- #111 of 169 in KS
Livability — Pittsburg
- Score
- 66/100
- State rank
- #270
- US rank
- #12149
Category grades
Schools grade is shown separately in the Schools card above.
Census & demographics
- Census place
- Pittsburg, KS
- County
- Crawford County · 24,907 people
- City population
- 24,907
- Metro
- Pittsburg, KS
- Population (ZIP)
- 24,907
- Household income
- $50,511
- Rent vs Own
- Severe rent burden
- 1186.0
Population outlook (Crawford County) Hauer SSP2
- Today (2025)
- 39,393 people
- By 2030
- 39,540 · +0.4%
- By 2040
- 39,452 · +0.1%
- By 2050
- 39,188 · -0.5%
- By 2075
- 39,038 · -0.9%
- By 2100
- 38,219 · -3.0%
Race, ethnicity, and origin ACS 2023
- Neighborhood character
- Predominantly White (80%)
- Race & ethnicity
- White 80% Hispanic / Latino 10% Two or more races 5% Asian 2% Black 2%
- Hispanic origin (detail)
- Mexican 7%
- Common ancestry
- Slovak 2% Lithuanian 2% Italian 2%
- Foreign-born
- 5% · Canada, China
- Languages at home
- 92% English-only · Spanish 6% Other Asian/Pacific 1%
Political lean MEDSL · Crawford
- 2024 margin
- Strong R (+25.3) · D 36.5% · R 61.7% · Other 1.8%
- 2008→2024 swing
- -26.7pp toward R · 2008: 1.4pp · 2024: -25.3pp
- All cycles
- 2024: R+25.3 2020: R+23.1 2016: R+23.1 2012: R+6.5 2008: D+1.4
Not yet ingested
- Civics
- —
Market trends
- HPI YoY
- ▼ -171.14%
- Current HPI
- 158.7878
- Rent YoY
- ▲ 13.80%
- Metro
- Pittsburg, KS
- State GDP YoY
- —
- F500 in state
- 0
Price history
+1711.6% since first listed8 events — show timeline
- 2026-03-26 Listed $125,000 Heartland MLS as Distributed by MLS Grid
- 2025-10-20 Listing Removed — Heartland MLS as Distributed by MLS Grid
- 2025-06-12 Price Changed $134,500 Heartland MLS as Distributed by MLS Grid
- 2025-03-31 Listed $137,000 Heartland MLS as Distributed by MLS Grid
- 2019-08-20 Sold (Public Records) — Public Records
- 2006-07-01 Sold (Public Records) $39,000 Public Records
- 2000-05-01 Sold (Public Records) $15,000 Public Records
- 1992-04-01 Sold (Public Records) $6,900 Public Records
Property tax history
+5.2%/yrLatest (2025): $1,099 · +10.5% YoY. Source: county tax records.
Cash-flow waterfall
monthlySold comps — $/sqft
last 12 mo · ≤1 miLoading sold comps…