8308 Daverman Dr · Louisville/Jefferson County metro government (balance), KY
Flood risk 4/10 · Minor
- FEMA flood zone
- X (unshaded)
- Chance of flooding over 30 yrs
- 0.22%
- Est. flood insurance / yr
- $473 – $860
Fire risk 1/10 · Minimal
- Est. fire insurance / yr
- $839 – $1,559
Heat risk 5/10 · Moderate
- Hot days now (above 104°F)
- 7 days/yr
- Hot days in 30 yrs
- 19 days/yr
Wind risk 2/10 · Minimal
- Chance of severe wind over 30 yrs
- 2.0%
Air-quality risk 3/10 · Minor
- Unhealthy air days now
- 2 days/yr
- Unhealthy air days in 30 yrs
- 3 days/yr
Risk factors via First Street. Map © Google.
Why this score? — see what drove the C- grade
The composite is a weighted blend of 9 inputs, each scored 0–100. Each bar is that input's sub-score; the figure is the points it added to the 100-point composite (weight × sub-score).
- Cash flow +16.2/30.0
- ARV discount +15.0/15.0
- DSCR +5.0/10.0
- 1% rule +4.2/10.0
- Rent growth +2.5/5.0
- Livability +2.5/5.0
- Condition / age +2.5/5.0
- Schools +2.3/10.0
- Appreciation +0.0/10.0
$200,000
🖨 Deal sheet (PDF) 📄 Offer letter ✓ Due diligence
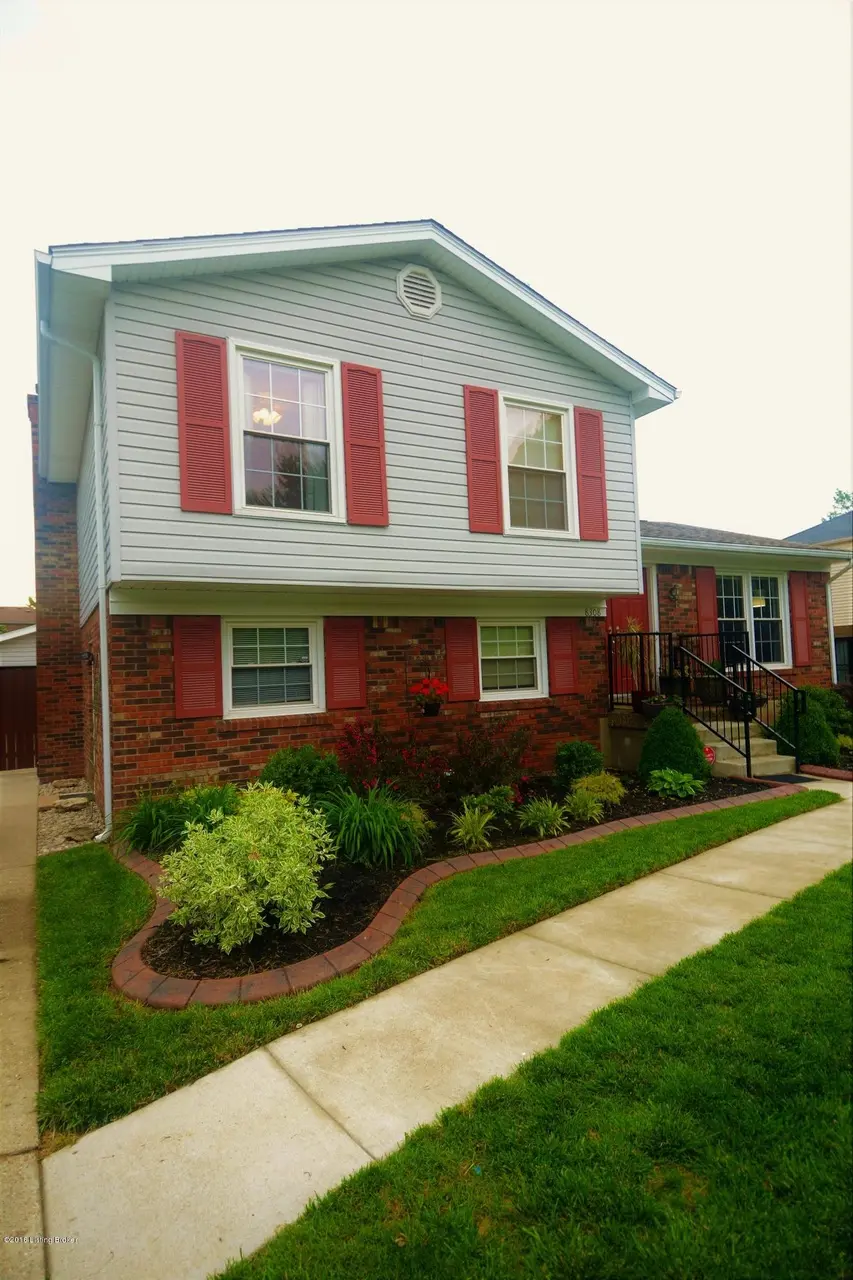
Listing remarks MLS
Be the first to make an offer on this outstanding home! Quiet dead end street, well established neighborhood, just minutes from downtown, the East End and Dixie Hwy make this home very desirable. This three bedroom home offers a formal dining room, den and a bonus room. Current owners have made several improvements over the years. The most recent improvements include roof(2015) and custom stamped curbing(2015) kitchen countertops, sink, faucet and backsplash (2016), downstairs carpet (2016). Sellers are leaving the security system and Smart Nest learning thermostat. You can save hundreds of dollars on your utility bills. The exterior doors have Kwikset locks. This eliminates the need for you to change locks when you move in. The backyard has a fully enclosed 6ft privacy fence. T swing set will remain. The tire swing may be negotiable.
Key facts
- 6,896 sq ft lot
- Built 1976
Property features AI
Exterior
- Home design: Single-family house
- Exterior features: Lot of approximately 6,896 sq ft
Neighborhood map
What this means for you Summary
Snapshot
- This is a 3-bed/2.0-bath single-family listed at $200k.
Deal economics
- At list price, monthly cash flow is $107 ($1k/yr) — positive.
- The deal already cash-flows at list — no discount required.
- To meet the 1% rule (rent ≥ 1% of price), the offer needs to be $183k (8.4% below list).
- Recommended offer: $183k (8.4% below list) — sets the bar for 1% rule.
- Cap rate 6.9% vs local median 4.0% in Louisville/Jefferson County metro government (balance) — top-decile yield for the area; either an underpriced asset or a hidden risk that comps aren't pricing in. Stress-test before assuming the spread holds.
Location & tenants
- Location reads: area grade C — affects rentability + tenant quality, not the cash-flow math above.
- Jefferson County (urban): math 19% / reading 35% proficiency, ranked #121 of 165 in KY (top 73%) — low school quality limits family demand, transient renter base, plan for 1-2y turnover.
- Zoned schools: Smyrna Elementary School (math 12% / reading 22%, grade F, #607 of 676 statewide, top 91%, 509 students, 65% FRL).
- Market conditions: 97 active listings in the ZIP; 14 comparable units currently listed for rent nearby; rentals leasing fast (median 5d on market — plan ~1-2 weeks tenant-placement turnaround); solid renter incomes; 2,836 units permitted in Jefferson County in 2024 (1,558 in 5+ unit buildings).
Forward outlook
- Local home prices are declining (-3.0%/yr); year-one equity from $1k of loan paydown is wiped out by about $6k of value loss. Plan a longer hold.
- Jefferson County population projected at +13% by 2050 — modest demand growth; plan on rents tracking national, not racing it.
Negotiation context
- Only 0 days on market — expect competitive offers; lowballing is unlikely to land.
- 5 sale attempts since 26y ago with the ask held roughly flat each time — persistent listings suggest the price (not the market) is what's stuck; bring a comps-based counter.
- Current owner paid $167k; 20% above their basis — modest negotiation headroom, anchor on the comps not their cost.
Risks & watch-outs
- Climate carrying-cost: extreme-heat days projected 7→19/yr by 2055 (HVAC capex compounding) — expect insurance premiums to compound above CPI over the hold.
Questions for the listing agent
- Built in 1976 — when were the roof, HVAC, electrical panel, plumbing, and water heater last replaced?
- Is there a deadline driving the sale (1031 exchange, divorce, estate, relocation)? That informs how much negotiation room exists.
- What's the average days-on-market for RENTAL listings here right now (not sales)? A rising rental-DOM trend means longer vacancies and softer asking-rent achievability than the comps imply.
- What's the recent tenant-quality profile in this submarket — average credit score on applications, eviction rate, late-payment / NSF rate, and stable-employment percentage? A property-management company in the area should have these aggregated.
- How much new for-sale + rental construction is in the pipeline within 1–3 miles? Heavy new supply typically softens prices + rents 12–24 months out; constrained supply supports both.
Investment metrics
- 1% rule
- 0.92% ✗
- Cap rate
- 6.94%
- Cash-on-cash
- 2.30%
- DSCR
- 1.10
- GRM
- 9.1
CMA / ARV
- ARV (on-the-fly)
- $244,338
- Comps found
- 12
Show comp detail 12 sales within ~0.75 mi
| Address | Dist | Beds/Ba | Sqft | Sold | Price | $/sf | Match |
|---|---|---|---|---|---|---|---|
| 8304 Olive Hill Ct | 0.12mi | 3/2.0 | 1,161 (+0%) | 8mo | $258,000 | $222 | 88 |
| 6806 Creedmoor Ct | 0.24mi | 3/1.5 | 1,174 (+1%) | 4mo | $254,000 | $216 | 82 |
| 8001 Cloverport Ct | 0.21mi | 3/2.0 | 1,074 (-7%) | 4mo | $220,000 | $205 | 75 |
| 8413 Cloverport Dr | 0.24mi | 3/1.0 | 1,200 (+4%) | 8mo | $229,900 | $192 | 72 |
| 8316 Daverman Dr | 0.05mi | 3/1.5 | 1,288 (+11%) | 8mo | $245,000 | $190 | 70 |
| 8202 Pennsylvania Run Rd | 0.48mi | 3/2.0 | 1,225 (+6%) | 8mo | $234,000 | $191 | 62 |
| 6910 Applegate Ln | 0.41mi | 3/1.0 | 1,094 (-6%) | 10mo | $251,000 | $229 | 60 |
| 8209 Vaughn Mill Rd | 0.63mi | 3/1.0 | 1,127 (-3%) | 4mo | $239,500 | $213 | 59 |
| 8303 Cloverport Dr | 0.16mi | 3/1.0 | 1,000 (-14%) | 8mo | $235,000 | $235 | 59 |
| 8813 Maple Rd | 0.63mi | 3/1.0 | 1,075 (-7%) | 1mo | $227,000 | $211 | 54 |
| 8002 Grenelle Dr | 0.43mi | 3/1.0 | 1,025 (-12%) | 4mo | $190,000 | $185 | 54 |
| 6109 Princess Way | 0.53mi | 3/1.5 | 1,276 (+10%) | 4mo | $249,000 | $195 | 53 |
Match score weights: distance 35% · size 25% · config 20% · recency 20%. Top-matched comps best support the ARV.
Projected returns pro-forma
-3.0% appreciation · 3.0% rent growth · sell at horizon
- IRR
- -12.7%
- Equity multiple
- 0.54×
- Total profit
- $-25,583
- Equity at exit
- $29,821
- IRR
- -3.6%
- Equity multiple
- 0.76×
- Total profit
- $-13,485
- Equity at exit
- $17,292
Cash invested: $56,000 (down + closing). Projections, not guarantees.
Landlord ↔ Tenant lean methodology
- Overall (STATE)
- 83 Strongly Landlord-Friendly
- State Kentucky
- 83 Strongly Landlord-Friendly · R+16
- County
- — inherits STATE
- City
- — inherits STATE
ZIP-level market 40228
- Active inventory
- 97
- Price-to-rent
- 9.1×
Monthly cashflow live
- Estimated rent
- $1,832 high interval (Pro) →
- Mortgage (P&I)
- −$1,049
- Tax from tax record
- −$208 /mo · $2,491/yr
- Insurance
- −$83
- HOA
- −$0
- Vacancy / Maint / Mgmt
- −$385
- Net cashflow
- $107
Break-even live
Sensitivity live
| Price | -10% $220 | -5% $164 | +0% $107 | +5% $51 | +10% $-6 |
|---|---|---|---|---|---|
| Rent | -10% $-38 | -5% $35 | +0% $107 | +5% $179 | +10% $252 |
| Rate | -1.0pp $208 | -0.5pp $158 | base $107 | +0.5pp $55 | +1.0pp $3 |
UW: 25.0% down · 7.5% · 30yr · 1.5% tax · 5.0% vac · 8.0% maint · 8.0% mgmt
Financing live
Cash to close
- Down payment
- $50,000
- Closing costs
- $6,000
- Reserves months
- —
- Total cash needed
- —
Loan-product check · same deal, 3 products live
Conventional
25% down · 7.5% · 30yr
- Down + closing
- —
- Monthly P&I
- —
- Monthly cashflow
- —
- DSCR
- —
- Eligible?
- —
Personal DTI + credit; lowest rate.
DSCR
20% down · 8.5% · 30yr
- Down + closing
- —
- Monthly P&I
- —
- Monthly cashflow
- —
- DSCR
- —
- Eligible?
- —
No personal income docs; deal must DSCR.
Hard money
10% down · 12.0% · 12mo
- Down + closing
- —
- Monthly P&I
- —
- Monthly cashflow
- —
- DSCR
- —
- Eligible?
- —
Short-term bridge; refi at stabilization.
Rent comps 14 comps
| Address | Beds | Baths | Sqft | Rent | $/sqft | DOM | Units | Dist |
|---|---|---|---|---|---|---|---|---|
| 8825 Anatolia Ct Louisville, KY | 1.0–3.0 | 1.0–2.0 | 1071 | $2,059 | $1.92 | 5d | 18 | 0.51mi |
| 6605 Vandre Ave Louisville, KY | 3.0 | 2.0 | 1100 | $1,775 | $1.61 | 25d | 1 | 0.61mi |
| 6600 Outer Loop Louisville, KY | 1.0–3.0 | 1.0–1.5 | 872 | $1,509 | $1.73 | 5d | 1 | 0.69mi |
| 7220 Harborton Way Louisville, KY | 3.0 | 1.0 | 1000 | $1,550 | $1.55 | 25d | 1 | 0.72mi |
| 6600 Outer Loop Unit 66 Louisville, KY | 3.0 | 1.5 | 1080 | $1,389 | $1.29 | 25d | 1 | 0.76mi |
| 9305 Smyrna Pkwy Louisville, KY | 1.0–2.0 | 1.0–2.0 | 959 | $1,550 | $1.62 | 3d | 20 | 1.03mi |
| 6109 Toebbe Ln Louisville, KY | 4.0 | 1.0 | 1040 | $1,850 | $1.78 | 25d | 1 | 1.05mi |
| 6109 Toebbe Ln Louisville, KY | 4.0 | 1.0 | 1182 | $2,431 | $2.06 | 18d | 1 | 1.05mi |
| 9102 Maiden Ct Louisville, KY | 3.0 | 1.0 | 925 | $1,500 | $1.62 | 5d | 1 | 1.10mi |
| 6111 Chambers Way Louisville, KY | 3.0 | 1.0 | 925 | $1,400 | $1.51 | 5d | 1 | 1.17mi |
| 7400 Snow Bend Ave Louisville, KY | 1.0–3.0 | 1.0–2.0 | 1074 | $1,846 | $1.72 | 3d | 11 | 1.21mi |
| 6128 Cooper Chapel Rd Louisville, KY | 3.0 | 1.0 | 964 | $1,400 | $1.45 | 5d | 1 | 1.33mi |
| 6115 Red Spruce Dr Louisville, KY | 3.0 | 1.0 | 975 | $1,395 | $1.43 | 5d | 1 | 1.45mi |
| 7715 Oakfields Pointe Rd Louisville, KY | 1.0–2.0 | 1.0–2.0 | 1073 | $1,469 | $1.37 | 4d | 11 | 1.49mi |
Listing history 6 events
-
2026-06-18pricestatusdays on market $200,000 Under Contract
-
2026-06-16status $225,000 Pending 2 DOM
-
2026-06-15days on market $225,000 Active 2 DOM
-
2026-06-13pricestatusdays on market $225,000 Active 1 DOM
-
2026-06-07remarks 128-char remark
-
2026-06-07$200,000 Under Contract
ⓘ Source: listings_history table (triggers on properties + properties_extension) + one-shot
backfill from property_details.listing_events for pre-trigger history.
Tax reassessment forecast KY · Resets to sale price
- Current annual tax
- $2,491 · $208/mo
- Projected year-2 tax
- $2,491 · $208/mo
- Expected delta
- $0/yr ($0/mo · 0.0%)
ⓘ Screening estimate from a state-policy table — verify with the county assessor before closing.
Climate risk First Street
- Flood 4/10 Moderate FEMA zone X (unshaded) · 22% chance over 30 yrs
- Wildfire 1/10 Low
- Heat 5/10 Major 7 d/yr ≥104°F today · 19 d/yr by 30 yrs out
- Wind 2/10 Low 2% chance of damaging wind over 30 yrs
- Air quality 3/10 Moderate 2 unhealthy d/yr today · 3 by 30 yrs out
Nearby sold comps map
Loading sold comps map…
Walkable amenities ~0.75 mi
Loading nearby amenities…
Taxation est. · year 1
- Rental income
- $21,978
- − Mortgage interest
- −$11,203
- − Property taxes
- −$2,491
- − Insurance
- −$1,000
- − Repairs & maintenance
- −$1,758
- − Management
- −$1,758
- − Depreciation
- −$5,818
- Taxable loss
- −$2,051
- Est. tax savings @ 24.0%
- +$492
- After-tax cash flow
- $1,778/yr
For passive investors: Depreciation is non-cash, so a rental often shows a tax loss while cash-flowing — sheltering income. Rental losses are passive: they offset passive income freely, and up to $25,000/yr can offset ordinary (W-2) income if you actively participate and your MAGI is under $100k (phasing out to $0 by $150k); unused losses carry forward. On sale, claimed depreciation is recaptured at up to 25%, and gains may owe capital-gains tax (a 1031 exchange can defer both). Figures are a year-1 estimate at your 24.0% rate — not tax advice; consult a CPA.
Schools (NCES district)
- District
- Jefferson County
- NCES district ID
- 2102990
- Math proficiency
- 19% ▼ -17.00%
- Reading proficiency
- 35% ▼ -11.00%
- Median HH income
- $47,885
- Composite
- 23.45/100
- National rank
- #7884
- State rank
- #121 of 165 in KY
Livability — Louisville/Jefferson County metro government (balance)
No livability data for this city. (Only ~50 U.S. cities are tracked.)
Census & demographics
- Census place
- Louisville/Jefferson County metro government (balance), KY
- County
- Jefferson County · 790,184 people
- City population
- 419,741
- Metro
- Louisville/Jefferson County, KY-IN
- Population (ZIP)
- 18,085
- Household income
- $79,404
- Rent vs Own
- Severe rent burden
- 95.0
Population outlook (Jefferson County) Hauer SSP2
- Today (2025)
- 823,112 people
- By 2030
- 849,343 · +3.2%
- By 2040
- 895,696 · +8.8%
- By 2050
- 933,630 · +13.4%
- By 2075
- 1,028,262 · +24.9%
- By 2100
- 1,072,675 · +30.3%
Race, ethnicity, and origin ACS 2023
- Neighborhood character
- Majority White (65%)
- Race & ethnicity
- White 65% Black 16% Two or more races 14% Hispanic / Latino 11% Asian 1%
- Hispanic origin (detail)
- Mexican 1% Cuban 7%
- Common ancestry
- Italian 2% Lithuanian 2% Swiss 1%
- Foreign-born
- 14% · Canada
- Languages at home
- 84% English-only · Spanish 9% Arabic 1% Other Asian/Pacific 1%
Political lean MEDSL · Jefferson
- 2024 margin
- D (+16.6) · D 57.4% · R 40.9% · Other 1.7%
- 2008→2024 swing
- +4.5pp toward D · 2008: 12.0pp · 2024: 16.6pp
- All cycles
- 2024: D+16.6 2020: D+20.1 2016: D+13.3 2012: D+11.1 2008: D+12.0
Not yet ingested
- Civics
- —
Market trends
- HPI YoY
- ▼ -215.41%
- Current HPI
- 238.4061
- Rent YoY
- —
- Metro
- Louisville/Jefferson County, KY-IN
- State GDP YoY
- ▲ 1.81%
- F500 in state
- 4
Industry mix (Fortune 500 HQ in KY)
| Industry | F500 HQs | Revenue |
|---|---|---|
| Healthcare | 1 | $118B |
|
||
| Food / Beverage | 1 | $7B |
|
||
Price history
+66.8% since first listed10 events — show timeline
- 2026-06-04 Listed $200,000 ForSaleByOwner.com
- 2026-06-04 Listed — ForSaleByOwner.com
- 2016-07-13 Sold (Public Records) $167,000 Public Records
- 2016-07-07 Sold (MLS) $167,000 Metro Search MLS
- 2016-05-16 Pending — Metro Search MLS
- 2016-05-10 Listed $165,000 Metro Search MLS
- 2001-01-25 Listing Removed — Metro Search MLS
- 2000-08-01 Listing Removed — Metro Search MLS
- 2000-07-25 Listed $119,950 Metro Search MLS
- 2000-04-02 Listed $119,900 Metro Search MLS
Property tax history
+5.6%/yrLatest (2025): $2,491 · +23.6% YoY. Source: county tax records.
Cash-flow waterfall
monthlySold comps — $/sqft
last 12 mo · ≤1 miLoading sold comps…