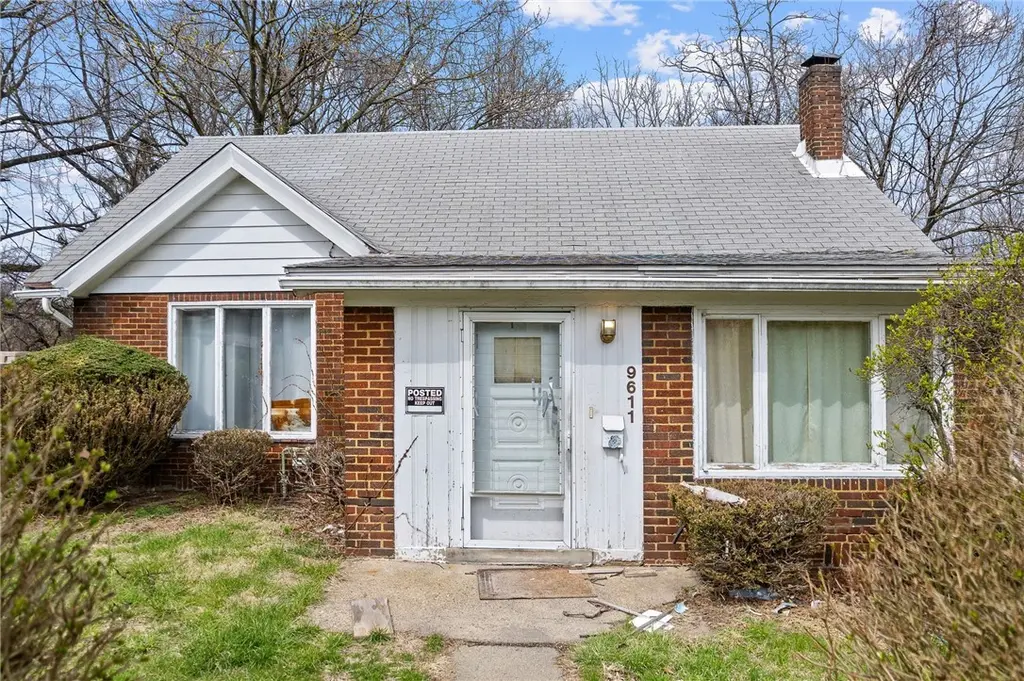
9611 Emerson St · Wilkinsburg, PA
Flood risk 1/10 · Minimal
- FEMA flood zone
- X (unshaded)
- Chance of flooding over 30 yrs
- 0.0%
- Est. flood insurance / yr
- $473 – $860
Fire risk 1/10 · Minimal
- Est. fire insurance / yr
- $511 – $949
Heat risk 3/10 · Minor
- Hot days now (above 96°F)
- 6 days/yr
- Hot days in 30 yrs
- 15 days/yr
Wind risk 2/10 · Minimal
- Chance of severe wind over 30 yrs
- —
Air-quality risk 4/10 · Minor
- Unhealthy air days now
- 5 days/yr
- Unhealthy air days in 30 yrs
- 7 days/yr
Risk factors via First Street. Map © Google.
Why this score? — see what drove the B+ grade
The composite is a weighted blend of 9 inputs, each scored 0–100. Each bar is that input's sub-score; the figure is the points it added to the 100-point composite (weight × sub-score).
- Cash flow +30.0/30.0
- ARV discount +15.0/15.0
- 1% rule +10.0/10.0
- DSCR +10.0/10.0
- Rent growth +4.4/5.0
- Livability +3.8/5.0
- Condition / age +2.5/5.0
- Schools +1.6/10.0
- Appreciation +0.0/10.0
$75,000
🖨 Deal sheet 📄 Offer letter ✓ Due diligence
Listing remarks MLS
Beautiful brick cape cod on a quiet neighborhood street. Hardwood floors and fireplace adorn the livingroom and dining room. Full basement waiting for finishing for a grand game room. Close to public transportation and shopping. Dishwasher, microwave oven, and stove included. .. Move right in!!!
Key facts
- 7,200 sq ft lot
- Garage
- Built 1926
Property features AI
Finance
- HOA & community: Public transportation access
Exterior
- Parking: Attached garage (1 parking space)
- Utilities: Public water; Public sewer
- Home design: Asphalt roof
- Construction: Brick construction; Asphalt roof
- Exterior features: Brick exterior; Resale property
Interior
- Kitchen: Cooktop; Stove; Some electric appliances
- Flooring: Carpet; Hardwood; Vinyl
- Bathrooms: 1 full bathroom
- Heating & cooling: Forced air heating; Gas heating
- Interior features: Unfinished, walk-up basement; Fireplace in family/living/great room
Neighborhood map
What this means for you Summary
Snapshot
- This is a 3-bed/1.0-bath single-family listed at $75k.
Deal economics
- At list price, monthly cash flow is $550 ($7k/yr) — positive.
- The deal already cash-flows at list — no discount required.
- Meets the 1% rule at list price ($2k rent vs $75k).
- Recommended offer: $73k (3.0% below list) — sets the bar for market timing.
- Cap rate 15.1% vs local median 11.3% in Wilkinsburg — top-decile yield for the area; either an underpriced asset or a hidden risk that comps aren't pricing in. Stress-test before assuming the spread holds.
Location & tenants
- Location reads 76/100 on livability (#411 in PA, #3,754 nationally) — a middle-class / working-renter tenant base. Strengths: commute A+, cost of living A+, housing A+; Watch: schools D+, health & safety D+, crime F.
- Penn Hills SD (suburban): math 13% / reading 24% proficiency, ranked #496 of 539 in PA (top 92%) — low school quality limits family demand, transient renter base, plan for 1-2y turnover.
- Market conditions: Rents rising fast (+7.6%/yr); 129 active listings in the ZIP; 26 comparable units currently listed for rent nearby; rentals at typical pace (median 17d on market — plan ~3-4 weeks tenant-placement turnaround); 2,996 units permitted in Allegheny County in 2024 (1,588 in 5+ unit buildings).
Forward outlook
- Local home prices are declining (-3.0%/yr); year-one equity from $519 of loan paydown is wiped out by about $2k of value loss. Plan a longer hold.
- At projected returns (-3.0% appreciation + 7.6% rent growth), your $21k cash investment doubles in ~4 years — after that, you're playing with house money.
Negotiation context
- It's been on market 56 days — a 3% lower offer ($73k) is reasonable based on typical stale-listing flexibility.
- 2 sale attempts since 14y ago with the ask held roughly flat each time — persistent listings suggest the price (not the market) is what's stuck; bring a comps-based counter.
- Current owner paid $60k; 25% above their basis — modest negotiation headroom, anchor on the comps not their cost.
Risks & watch-outs
- Watch-outs: property tax is 3.6% of price; built in 1926 — expect roof / HVAC / electrical / plumbing capex.
Questions for the listing agent
- It's been on market 56 days. Have you received any prior offers? Is the seller open to a 3% concession, seller financing, or rate buy-down credit?
- Built in 1926 — when were the roof, HVAC, electrical panel, plumbing, and water heater last replaced?
- Property tax is high relative to price — has the assessment been appealed recently, and will the sale trigger a re-assessment?
- Is there a deadline driving the sale (1031 exchange, divorce, estate, relocation)? That informs how much negotiation room exists.
- Schools are D-rated, which usually means shorter tenancies and higher turnover. Who's the typical renter profile here, and what's been the actual vacancy rate?
- Crime grade is F in this area — have there been break-ins, vandalism, or insurance claims at this property in the last 3 years? What carrier currently insures it and at what premium?
- What's the average days-on-market for RENTAL listings here right now (not sales)? A rising rental-DOM trend means longer vacancies and softer asking-rent achievability than the comps imply.
- What's the recent tenant-quality profile in this submarket — average credit score on applications, eviction rate, late-payment / NSF rate, and stable-employment percentage? A property-management company in the area should have these aggregated.
- How much new for-sale + rental construction is in the pipeline within 1–3 miles? Heavy new supply typically softens prices + rents 12–24 months out; constrained supply supports both.
Investment metrics
- 1% rule
- 2.02% ✓
- Cap rate
- 15.10%
- Cash-on-cash
- 31.44%
- DSCR
- 2.40
- GRM
- 4.1
CMA / ARV
- ARV (on-the-fly)
- $128,800
- Comps found
- 12
Show comp detail 12 sales within ~0.75 mi
| Address | Dist | Beds/Ba | Sqft | Sold | Price | $/sf | Match |
|---|---|---|---|---|---|---|---|
| 9611 Emerson St | 0.00mi | 3/1.0 | 1,120 (0%) | 1mo | $75,000 | $67 | 99 |
| 139 Howard St | 0.20mi | 3/1.0 | 1,160 (+4%) | 5mo | $105,000 | $91 | 81 |
| 108 Lavern St | 0.14mi | 3/1.5 | 1,176 (+5%) | 4mo | $175,000 | $149 | 80 |
| 361 Orin St | 0.42mi | 3/1.0 | 1,100 (-2%) | 0mo | $125,500 | $114 | 77 |
| 35 Verona Rd | 0.37mi | 2/1.0 (-1) | 1,122 (+0%) | 5mo | $24,900 | $22 | 73 |
| 111 Clinton Dr | 0.11mi | 3/1.0 | 1,275 (+14%) | 5mo | $175,000 | $137 | 67 |
| 310 Mccutcheon Ln | 0.40mi | 3/2.0 | 1,163 (+4%) | 5mo | $70,000 | $60 | 67 |
| 2036 Sampson St | 0.40mi | 3/2.0 | 1,218 (+9%) | 1mo | $162,000 | $133 | 62 |
| 614 Churchill Ave | 0.64mi | 3/2.0 | 1,100 (-2%) | 5mo | $174,500 | $159 | 59 |
| 7895 Mark Dr | 0.68mi | 3/2.0 | 1,200 (+7%) | 4mo | $115,500 | $96 | 49 |
| 711 Gaywood Dr | 0.56mi | 3/1.5 | 1,264 (+13%) | 2mo | $242,000 | $191 | 49 |
| 149 Eastminster Dr | 0.66mi | 3/2.0 | 960 (-14%) | 4mo | $110,500 | $115 | 38 |
Match score weights: distance 35% · size 25% · config 20% · recency 20%. Top-matched comps best support the ARV.
Projected returns pro-forma
-3.0% appreciation · 7.63% rent growth · sell at horizon
- IRR
- 32.1%
- Equity multiple
- 2.45×
- Total profit
- $30,399
- Equity at exit
- $11,183
- IRR
- 42.0%
- Equity multiple
- 6.02×
- Total profit
- $105,446
- Equity at exit
- $6,485
Cash invested: $21,000 (down + closing). Projections, not guarantees.
Landlord ↔ Tenant lean methodology
- Overall (STATE)
- 62 Landlord-Friendly
- State Pennsylvania
- 62 Landlord-Friendly · EVEN
- County
- — inherits STATE
- City
- — inherits STATE
ZIP-level market 15235
- Home prices YoY
- -34.1%
- Rents YoY
- 7.6%
- Active inventory
- 129
- Price-to-rent
- 4.1×
Monthly cashflow live
- Estimated rent
- $1,518 high interval (Pro) →
- Mortgage (P&I)
- −$393
- Tax from tax record
- −$224 /mo · $2,694/yr
- Insurance
- −$31
- HOA
- −$0
- Vacancy / Maint / Mgmt
- −$319
- Net cashflow
- $550
Break-even live
UW: 25.0% down · 7.5% · 30yr · 1.5% tax · 5.0% vac · 8.0% maint · 8.0% mgmt
Financing live
Cash to close
- Down payment
- $18,750
- Closing costs
- $2,250
- Reserves months
- —
- Total cash needed
- —
Loan-product check · same deal, 3 products live
Conventional
25% down · 7.5% · 30yr
- Down + closing
- —
- Monthly P&I
- —
- Monthly cashflow
- —
- DSCR
- —
- Eligible?
- —
Personal DTI + credit; lowest rate.
DSCR
20% down · 8.5% · 30yr
- Down + closing
- —
- Monthly P&I
- —
- Monthly cashflow
- —
- DSCR
- —
- Eligible?
- —
No personal income docs; deal must DSCR.
Hard money
10% down · 12.0% · 12mo
- Down + closing
- —
- Monthly P&I
- —
- Monthly cashflow
- —
- DSCR
- —
- Eligible?
- —
Short-term bridge; refi at stabilization.
Rent comps 26 comps
| Address | Beds | Baths | Sqft | Rent | $/sqft | DOM | Units | Dist |
|---|---|---|---|---|---|---|---|---|
| 185 Howard St Pittsburgh, PA | 2.0 | 1.0 | 1000 | $1,250 | $1.25 | 43d | 1 | 0.27mi |
| 10043 Calvin St Pittsburgh, PA | 2.0 | 1.0 | 778 | $1,195 | $1.54 | 43d | 1 | 0.28mi |
| 10135 Pearl Rd Pittsburgh, PA | 3.0 | 2.0 | 1163 | $1,450 | $1.25 | 23d | 1 | 0.51mi |
| 103 Grove Rd Verona, PA | 3.0 | 1.5 | 1460 | $1,450 | $0.99 | 12d | 1 | 0.52mi |
| 3005 Laketon Rd Pittsburgh, PA | 3.0 | 1.0 | 1100 | $1,295 | $1.18 | 14d | 1 | 0.53mi |
| 8918 Frankstown Rd Pittsburgh, PA | 3.0 | 1.0 | 1400 | $1,907 | $1.36 | 14d | 1 | 0.54mi |
| 216 Grove Rd Verona, PA | 3.0 | 1.0 | 1165 | $1,550 | $1.33 | 43d | 1 | 0.58mi |
| 648 Southern Ave Penn Hills, PA | 3.0 | 1.0 | 1100 | $1,600 | $1.45 | 7d | 1 | 0.61mi |
| 610 Churchill Ave Pittsburgh, PA | 3.0 | 1.0 | 1100 | $1,395 | $1.27 | 2d | 1 | 0.62mi |
| 8612 Oakcrest Rd Pittsburgh, PA | 2.0 | 1.0 | 1218 | $1,450 | $1.19 | 23d | 1 | 0.80mi |
| 457 Elias Dr #445 Pittsburgh, PA | 2.0 | 1.0 | 888 | $1,200 | $1.35 | 17d | 1 | 0.90mi |
| 251 Selvin Dr Verona, PA | 3.0 | 1.0 | 1320 | $1,295 | $0.98 | 3d | 1 | 0.92mi |
| 2031 Chalfant St Pittsburgh, PA | 3.0 | 1.5 | 1150 | $1,950 | $1.70 | 43d | 1 | 0.92mi |
| 62 Melvin Ct Penn Hills Township, PA | 1.0–2.0 | 1.0 | 825 | $1,549 | $1.88 | 7d | 2 | 0.92mi |
| 273 Bramble St Verona, PA | 3.0 | 1.5 | 1076 | $1,720 | $1.60 | 4d | 1 | 0.99mi |
| 314 Penn Vista Dr Pittsburgh, PA | 2.0 | 1.0 | 1150 | $1,250 | $1.09 | 43d | 1 | 1.02mi |
| 131 Jacob Dr Pittsburgh, PA | 3.0 | 1.0 | 1144 | $2,300 | $2.01 | 1d | 1 | 1.04mi |
| 8075 Chaske St Verona, PA | 3.0 | 1.5 | 1092 | $1,425 | $1.30 | 7d | 1 | 1.05mi |
| 641 Penny Dr Pittsburgh, PA | 3.0 | 1.5 | 1199 | $1,525 | $1.27 | 14d | 1 | 1.13mi |
| 124 Dauntless Dr Pittsburgh, PA | 3.0 | 1.0 | 1100 | $1,395 | $1.27 | 23d | 1 | 1.14mi |
| 1713-1715 Clark St Unit 79-1804C Pittsburgh, PA | 2.0 | 1.0 | 972 | $1,200 | $1.23 | 4d | 1 | 1.25mi |
| 1250 Blackadore Ave Pittsburgh, PA | 3.0 | 1.0 | 1440 | $1,750 | $1.22 | 23d | 1 | 1.29mi |
| 1526 Edwards St Verona, PA | 3.0 | 1.0 | 1296 | $1,730 | $1.33 | 43d | 1 | 1.35mi |
| 7534 Penn Bridge Ct Pittsburgh, PA | 2.0 | 2.0 | 1259 | $1,750 | $1.39 | 43d | 1 | 1.36mi |
| 11843 Joan Dr Pittsburgh, PA | 3.0 | 1.0 | 1144 | $1,500 | $1.31 | 4d | 1 | 1.47mi |
| 1515 Penn Ave Wilkinsburg, PA | 2.0 | 2.0 | 1012 | $1,100 | $1.09 | 43d | 1 | 1.50mi |
Listing history 6 events
-
2026-04-14historical Contingent
-
2026-04-02$75,000 Active
-
2024-01-22soldstatus $60,000
-
2012-05-31$60,000 296-char remark
Show marketing remark (296 chars)
Beautiful brick cape cod on a quiet neighborhood street. Hardwood floors and fireplace adorn the livingroom and dining room. Full basement waiting for finishing for a grand game room. Close to public transportation and shopping. Dishwasher, microwave oven, and stove included. .. Move right in!!!
-
1993-03-30soldstatus $37,000
-
1984-04-03soldstatus $33,000
ⓘ Source: listings_history table (triggers on properties + properties_extension) + one-shot
backfill from property_details.listing_events for pre-trigger history.
Tax reassessment forecast PA · Partial reset (capped growth)
- Current annual tax
- $2,694 · $224/mo
- Projected year-2 tax
- $2,694 · $224/mo
- Expected delta
- $0/yr ($0/mo · 0.0%)
ⓘ Screening estimate from a state-policy table — verify with the county assessor before closing.
Climate risk First Street
- Flood 1/10 Low FEMA zone X (unshaded) · 0% chance over 30 yrs
- Wildfire 1/10 Low
- Heat 3/10 Moderate 6 d/yr ≥96°F today · 15 d/yr by 30 yrs out
- Wind 2/10 Low
- Air quality 4/10 Moderate 5 unhealthy d/yr today · 7 by 30 yrs out
Nearby sold comps map
Loading sold comps map…
Walkable amenities ~0.75 mi
Loading nearby amenities…
Taxation est. · year 1
- Rental income
- $18,217
- − Mortgage interest
- −$4,201
- − Property taxes
- −$2,694
- − Insurance
- −$375
- − Repairs & maintenance
- −$1,457
- − Management
- −$1,457
- − Depreciation
- −$2,182
- Taxable income
- $5,851
- Est. tax owed @ 24.0%
- −$1,404
- After-tax cash flow
- $5,199/yr
For passive investors: Depreciation is non-cash, so a rental often shows a tax loss while cash-flowing — sheltering income. Rental losses are passive: they offset passive income freely, and up to $25,000/yr can offset ordinary (W-2) income if you actively participate and your MAGI is under $100k (phasing out to $0 by $150k); unused losses carry forward. On sale, claimed depreciation is recaptured at up to 25%, and gains may owe capital-gains tax (a 1031 exchange can defer both). Figures are a year-1 estimate at your 24.0% rate — not tax advice; consult a CPA.
Schools (NCES district)
- District
- Penn Hills SD
- NCES district ID
- 4218590
- Math proficiency
- 13% ▼ -6.00%
- Reading proficiency
- 24% ▼ -14.00%
- Median HH income
- $47,794
- Composite
- 16.42/100
- National rank
- #9192
- State rank
- #496 of 539 in PA
Livability — Wilkinsburg
- Score
- 76/100
- State rank
- #411
- US rank
- #3754
Category grades
Schools grade is shown separately in the Schools card above.
Census & demographics
- County
- Allegheny County · 1,022,028 people
- City population
- 29,513
- Metro
- Pittsburgh, PA
- Population (ZIP)
- 33,951
- Household income
- $67,240
- Rent vs Own
- Severe rent burden
- 955.0
Population outlook (Allegheny County) Hauer SSP2
- Today (2025)
- 1,250,282 people
- By 2030
- 1,256,482 · +0.5%
- By 2040
- 1,256,318 · +0.5%
- By 2050
- 1,244,169 · -0.5%
- By 2075
- 1,197,693 · -4.2%
- By 2100
- 1,093,187 · -12.6%
Race, ethnicity, and origin ACS 2023
- Neighborhood character
- Diverse neighborhood (Simpson 0.58)
- Race & ethnicity
- White 51% Black 40% Two or more races 7% Hispanic / Latino 2%
- Common ancestry
- Romanian 5% Serbian 2% Slovak 1%
- Foreign-born
- 4% · Canada
- Languages at home
- 97% English-only · Other Indo-European 1% Spanish 1%
Political lean MEDSL · Allegheny
- 2024 margin
- Strong D (+20.3) · D 59.7% · R 39.4%
- 2008→2024 swing
- +4.8pp toward D · 2008: 15.5pp · 2024: 20.3pp
- All cycles
- 2024: D+20.3 2020: D+20.4 2016: D+16.4 2012: D+14.4 2008: D+15.5
Not yet ingested
- Civics
- —
Market trends
- HPI YoY
- ▼ -121.68%
- Current HPI
- 235.4861
- Rent YoY
- ▲ 7.63%
- Metro
- Pittsburgh, PA
- State GDP YoY
- ▲ 1.68%
- F500 in state
- 34
Industry mix (Fortune 500 HQ in PA)
| Industry | F500 HQs | Revenue |
|---|---|---|
| Healthcare | 2 | $309B |
|
||
| Insurance | 2 | $27B |
|
||
| Telecommunications / Media | 1 | $124B |
|
||
| Industrial Distribution | 1 | $22B |
|
||
| Financial Services | 1 | $20B |
|
||
| Chemicals / Materials | 1 | $18B |
|
||
Price history
+127.3% since first listed6 events — show timeline
- 2026-04-14 Contingent — West Penn MLS
- 2026-04-02 Listed $75,000 West Penn MLS
- 2024-01-22 Sold (Public Records) $60,000 Public Records
- 2012-05-31 Listed $60,000 West Penn MLS
- 1993-03-30 Sold (Public Records) $37,000 Public Records
- 1984-04-03 Sold (Public Records) $33,000 Public Records
Property tax history
+2.5%/yrLatest (2026): $2,694 · +0.0% YoY. Source: county tax records.
Cash-flow waterfall
monthlySold comps — $/sqft
last 12 mo · ≤1 miLoading sold comps…