1208 7th St #1 · Menomonie, WI
Flood risk No data
- FEMA flood zone
- —
- Chance of flooding over 30 yrs
- %
- Est. flood insurance / yr
- —
Fire risk No data
- Est. fire insurance / yr
- —
Heat risk No data
- Hot days now (above °F)
- days/yr
- Hot days in 30 yrs
- days/yr
Wind risk No data
- Chance of severe wind over 30 yrs
- %
Air-quality risk No data
- Unhealthy air days now
- days/yr
- Unhealthy air days in 30 yrs
- days/yr
Risk factors via First Street. Map © Google.
Why this score? — see what drove the F grade
The composite is a weighted blend of 9 inputs, each scored 0–100. Each bar is that input's sub-score; the figure is the points it added to the 100-point composite (weight × sub-score).
- Cash flow +13.5/30.0
- DSCR +4.1/10.0
- Livability +4.1/5.0
- 1% rule +3.8/10.0
- Schools +3.4/10.0
- Rent growth +3.1/5.0
- Condition / age +2.5/5.0
- ARV discount +0.0/15.0
- Appreciation +0.0/10.0
$189,900
🖨 Deal sheet 📄 Offer letter ✓ Due diligence
Listing remarks
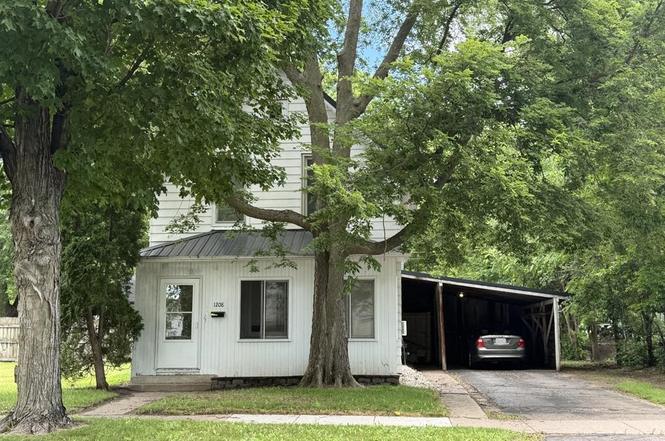
Are you looking for an Investment property? 3 bed, 2 bath student rental leased until 5/31/27. Tenants pay $1200 per month and all utilities. Kitchen, bath, dining, living room and laundry all on the main floor. One main floor bedroom, Two bedrooms and one bathroom upstairs. Enclosed front porch, off street parking, carport and spacious back yard. Conveniently located near UW?Stout, and other daily amenities.
Key facts
- Main floor laundry
- Main floor dining
- Main floor kitchen
Tags
Neighborhood map
What this means for you Summary
Snapshot
- This is a 3-bed/2.0-bath condo listed at $190k.
Deal economics
- At list price, monthly cash flow is $8 ($92/yr) — positive.
- The deal already cash-flows at list — no discount required.
- To meet the 1% rule (rent ≥ 1% of price), the offer needs to be $167k (12.0% below list).
- Recommended offer: $167k (12.0% below list) — sets the bar for 1% rule.
- Cap rate 6.3% vs local median 3.7% in Menomonie — top-decile yield for the area; either an underpriced asset or a hidden risk that comps aren't pricing in. Stress-test before assuming the spread holds.
Location & tenants
- Location reads 82/100 on livability (#50 in WI, #1,248 nationally) — a professional / high-income tenant draw. Strengths: cost of living A+, housing A+, health & safety A+; Watch: schools D+, employment D+, amenities F.
- Menomonie Area School District (town): math 40% / reading 40% proficiency, ranked #157 of 342 in WI (top 46%) — families likely to look elsewhere, expect single-tenant / working-renter base with shorter leases.
- Market conditions: Rents rising (+2.6%/yr); 105 active listings in the ZIP; 3 comparable units currently listed for rent nearby; rentals leasing fast (median 13d on market — plan ~1-2 weeks tenant-placement turnaround); 151 units permitted in Dunn County in 2024 (0 in 5+ unit buildings).
Forward outlook
- Local home prices are declining (-3.0%/yr); year-one equity from $1k of loan paydown is wiped out by about $6k of value loss. Plan a longer hold.
Negotiation context
- Only 1 days on market — expect competitive offers; lowballing is unlikely to land.
Risks & watch-outs
- Watch-outs: built in 1925 — expect roof / HVAC / electrical / plumbing capex.
Questions for the listing agent
- Built in 1925 — when were the roof, HVAC, electrical panel, plumbing, and water heater last replaced?
- Any open or pending special assessments — roof, HVAC, plumbing, elevator, façade? What's the per-unit balance and payoff schedule, and is the seller paying it off at close or rolling it to the buyer?
- Is there a deadline driving the sale (1031 exchange, divorce, estate, relocation)? That informs how much negotiation room exists.
- Schools are D-rated, which usually means shorter tenancies and higher turnover. Who's the typical renter profile here, and what's been the actual vacancy rate?
- The area grade is low — what's the realistic commute time and amenity access for the typical tenant pool here? Any planned neighborhood developments (good or bad) we should know about?
- What's the average days-on-market for RENTAL listings here right now (not sales)? A rising rental-DOM trend means longer vacancies and softer asking-rent achievability than the comps imply.
- What's the recent tenant-quality profile in this submarket — average credit score on applications, eviction rate, late-payment / NSF rate, and stable-employment percentage? A property-management company in the area should have these aggregated.
- How much new apartment / multifamily construction is in the pipeline within 1–3 miles? Heavy new supply (>2% of stock underway) typically softens rents 12–24 months out; light construction supports rent growth.
Investment metrics
- 1% rule
- 0.88% ✗
- Cap rate
- 6.34%
- Cash-on-cash
- 0.17%
- DSCR
- 1.01
- GRM
- 9.5
CMA / ARV
- ARV (on-the-fly)
- $156,000
- Comps found
- 4
Show comp detail 4 sales within ~0.75 mi
| Address | Dist | Beds/Ba | Sqft | Sold | Price | $/sf | Match |
|---|---|---|---|---|---|---|---|
| 1603 E 8th St #1 | 0.24mi | 4/1.0 (+1) | 1,200 (0%) | 12mo | $175,000 | $146 | 70 |
| 713 12th Ave #1 | 0.04mi | 4/1.0 (+1) | 1,268 (+6%) | 12mo | $160,000 | $126 | 70 |
| 615 E 11th St #1 | 0.43mi | 4/1.0 (+1) | 1,085 (-10%) | 15mo | $135,000 | $124 | 43 |
| 313 13th Ave #1 | 0.55mi | 4/1.5 (+1) | 1,350 (+12%) | 9mo | $175,000 | $130 | 39 |
Match score weights: distance 35% · size 25% · config 20% · recency 20%. Top-matched comps best support the ARV.
Projected returns pro-forma
-3.0% appreciation · 2.59% rent growth · sell at horizon
- IRR
- -16.5%
- Equity multiple
- 0.42×
- Total profit
- $-30,943
- Equity at exit
- $28,315
- IRR
- -9.0%
- Equity multiple
- 0.45×
- Total profit
- $-29,004
- Equity at exit
- $16,419
Cash invested: $53,172 (down + closing). Projections, not guarantees.
Landlord ↔ Tenant lean methodology
- Overall (STATE)
- 73 Landlord-Friendly
- State Wisconsin
- 73 Landlord-Friendly · R+2
- County
- — inherits STATE
- City
- — inherits STATE
ZIP-level market 54751
- Rents YoY
- 2.6%
- Active inventory
- 105
- Price-to-rent
- 9.5×
Monthly cashflow live
- Estimated rent
- $1,671 medium interval (Pro) →
- Mortgage (P&I)
- −$996
- Tax est. 1.5%
- −$237 /mo · $2,848/yr
- Insurance
- −$79
- HOA
- −$0
- Vacancy / Maint / Mgmt
- −$351
- Net cashflow
- $8
Break-even live
UW: 25.0% down · 7.5% · 30yr · 1.5% tax · 5.0% vac · 8.0% maint · 8.0% mgmt
Financing live
Cash to close
- Down payment
- $47,475
- Closing costs
- $5,697
- Reserves months
- —
- Total cash needed
- —
Loan-product check · same deal, 3 products live
Conventional
25% down · 7.5% · 30yr
- Down + closing
- —
- Monthly P&I
- —
- Monthly cashflow
- —
- DSCR
- —
- Eligible?
- —
Personal DTI + credit; lowest rate.
DSCR
20% down · 8.5% · 30yr
- Down + closing
- —
- Monthly P&I
- —
- Monthly cashflow
- —
- DSCR
- —
- Eligible?
- —
No personal income docs; deal must DSCR.
Hard money
10% down · 12.0% · 12mo
- Down + closing
- —
- Monthly P&I
- —
- Monthly cashflow
- —
- DSCR
- —
- Eligible?
- —
Short-term bridge; refi at stabilization.
Rent comps 3 comps
| Address | Beds | Baths | Sqft | Rent | $/sqft | DOM | Units | Dist |
|---|---|---|---|---|---|---|---|---|
| 1320 12th Ave E Menomonie, WI | 1.0–2.0 | 1.0–2.0 | 825 | $2,050 | $2.48 | 13d | 1 | 0.51mi |
| 1910 11th Ave E Menomonie, WI | 2.0 | 2.0 | 1102 | $1,550 | $1.41 | 13d | 1 | 0.79mi |
| 1942 11th Ave E Menomonie, WI | 2.0 | 2.0 | 1102 | $1,550 | $1.41 | 44d | 1 | 0.88mi |
HOA detail condo
- Monthly dues
- $0 · $0/yr
- Assessments
- None detected in remarks — confirm with the listing agent.
Listing history 2 events
-
2026-06-19remarks 412-char remark
-
2026-06-19$189,900 Active 1 DOM
ⓘ Source: listings_history table (triggers on properties + properties_extension) + one-shot
backfill from property_details.listing_events for pre-trigger history.
Nearby sold comps map
Loading sold comps map…
Walkable amenities ~0.75 mi
Loading nearby amenities…
Taxation est. · year 1
- Rental income
- $20,052
- − Mortgage interest
- −$10,637
- − Property taxes
- −$2,848
- − Insurance
- −$950
- − Repairs & maintenance
- −$1,604
- − Management
- −$1,604
- − Depreciation
- −$5,524
- Taxable loss
- −$3,116
- Est. tax savings @ 24.0%
- +$748
- After-tax cash flow
- $840/yr
For passive investors: Depreciation is non-cash, so a rental often shows a tax loss while cash-flowing — sheltering income. Rental losses are passive: they offset passive income freely, and up to $25,000/yr can offset ordinary (W-2) income if you actively participate and your MAGI is under $100k (phasing out to $0 by $150k); unused losses carry forward. On sale, claimed depreciation is recaptured at up to 25%, and gains may owe capital-gains tax (a 1031 exchange can defer both). Figures are a year-1 estimate at your 24.0% rate — not tax advice; consult a CPA.
Schools (NCES district)
- District
- Menomonie Area School District
- NCES district ID
- 5509090
- Math proficiency
- 40% ▼ -1.00%
- Reading proficiency
- 40% ▲ 2.00%
- Median HH income
- $47,172
- Composite
- 34.23/100
- National rank
- #5262
- State rank
- #157 of 342 in WI
Livability — Menomonie
- Score
- 82/100
- State rank
- #50
- US rank
- #1248
Category grades
Schools grade is shown separately in the Schools card above.
Census & demographics
- Census place
- Menomonie, WI
- County
- Dunn County · 26,193 people
- City population
- 26,193
- Metro
- Menomonie, WI
- Population (ZIP)
- 26,193
- Household income
- $72,028
- Rent vs Own
- Severe rent burden
- 821.0
Population outlook (Dunn County) Hauer SSP2
- Today (2025)
- 45,435 people
- By 2030
- 45,694 · +0.6%
- By 2040
- 45,329 · -0.2%
- By 2050
- 44,343 · -2.4%
- By 2075
- 42,497 · -6.5%
- By 2100
- 40,616 · -10.6%
Race, ethnicity, and origin ACS 2023
- Neighborhood character
- Predominantly White (89%)
- Race & ethnicity
- White 89% Asian 5% Two or more races 3% Hispanic / Latino 2% Black 1%
- Common ancestry
- Portuguese 15% Romanian 6% Lithuanian 3%
- Foreign-born
- 3% · China, Canada
- Languages at home
- 94% English-only · Other Asian/Pacific 3% Spanish 1% Chinese 1%
Political lean MEDSL · Dunn
- 2024 margin
- R (+15.9) · D 41.5% · R 57.4% · Other 1.2%
- 2008→2024 swing
- -30.9pp toward R · 2008: 14.9pp · 2024: -15.9pp
- All cycles
- 2024: R+15.9 2020: R+13.9 2016: R+11.2 2012: D+5.0 2008: D+14.9
Not yet ingested
- Civics
- —
Market trends
- HPI YoY
- ▼ -134.07%
- Current HPI
- 214.7943
- Rent YoY
- ▲ 2.59%
- Metro
- Menomonie, WI
- State GDP YoY
- ▲ 2.10%
- F500 in state
- 20
Industry mix (Fortune 500 HQ in WI)
| Industry | F500 HQs | Revenue |
|---|---|---|
| Industrial Machinery | 4 | $23B |
|
||
| Industrial Technology | 2 | $36B |
|
||
| Insurance | 1 | $36B |
|
||
| Professional Services | 1 | $19B |
|
||
| Utilities | 1 | $9B |
|
||
| Consumer Goods | 1 | $3B |
|
||
Cash-flow waterfall
monthlySold comps — $/sqft
last 12 mo · ≤1 miLoading sold comps…