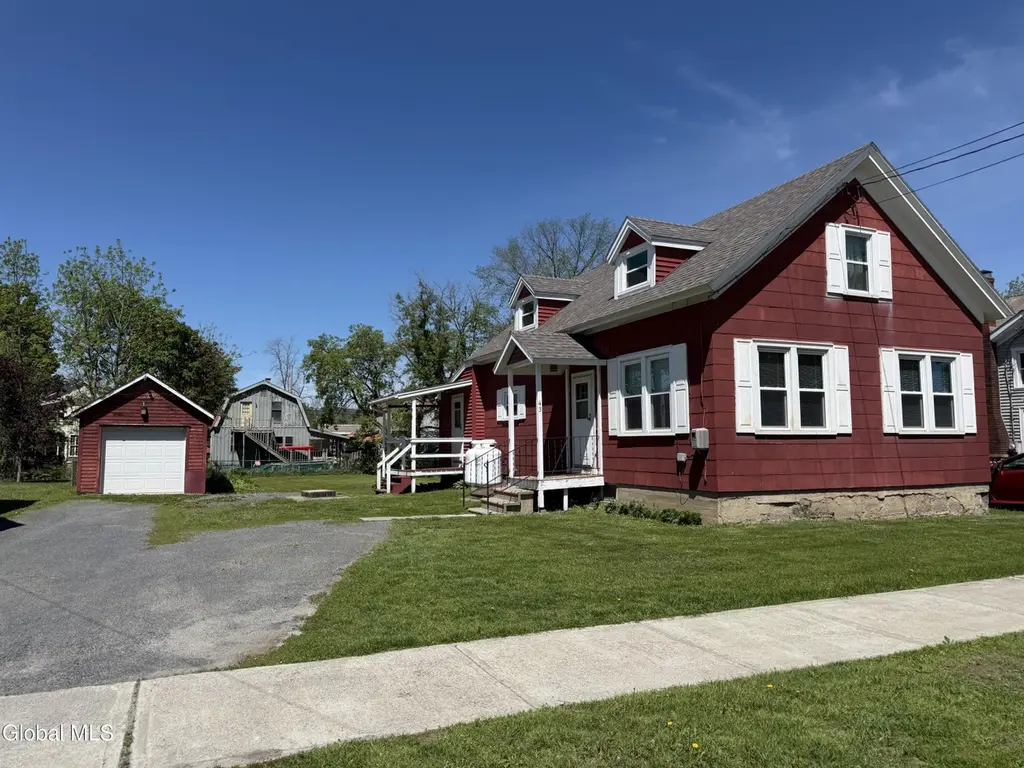
43 George St · Fort Ann, NY
Flood risk 1/10 · Minimal
- FEMA flood zone
- —
- Chance of flooding over 30 yrs
- 0.0%
- Est. flood insurance / yr
- —
Fire risk 1/10 · Minimal
- Est. fire insurance / yr
- $691 – $1,283
Heat risk 3/10 · Minor
- Hot days now (above 96°F)
- 7 days/yr
- Hot days in 30 yrs
- 16 days/yr
Wind risk 2/10 · Minimal
- Chance of severe wind over 30 yrs
- 4.0%
Air-quality risk 2/10 · Minimal
- Unhealthy air days now
- 0 days/yr
- Unhealthy air days in 30 yrs
- 1 days/yr
Risk factors via First Street. Map © Google.
Why this score? — see what drove the C+ grade
The composite is a weighted blend of 9 inputs, each scored 0–100. Each bar is that input's sub-score; the figure is the points it added to the 100-point composite (weight × sub-score).
- Cash flow +15.3/30.0
- ARV discount +15.0/15.0
- Appreciation +10.0/10.0
- Schools +5.5/10.0
- DSCR +4.7/10.0
- 1% rule +4.3/10.0
- Livability +3.3/5.0
- Rent growth +2.5/5.0
- Condition / age +2.5/5.0
$149,900
🖨 Deal sheet 📄 Offer letter ✓ Due diligence
Listing remarks
MULTIPLE OFFERS RECEIVED, HIGHEST AND BEST DEADLINE SET FOR FRIDAY 5/29 AT 6PM. Affordable opportunity in a convenient Fort Ann location! This 3-bedroom, 1.5-bath home is situated on low maintenance . 24-acre lot and offers great potential for a first-time homebuyer or anyone looking to add their own personal touches. The home has been well maintained over the years, with many of the major updates already completed, including newer windows, furnace, and roof--allowing you to focus on cosmetic improvements and truly make it your own. The main level features a large living room, kitchen with dining area, full bathroom, laundry room, and convenient first-floor primary bedroom. Upstairs offers
Key facts
- Newer furnace
- Newer roof
- Low maintenance lot
Tags
Property features AI
Exterior
- Parking: One-car garage; Total of 4 parking spaces; Off-street parking via driveway
- Utilities: Public water; Public sewer
- Home design: Single-family residence; Shingle roof; Drywall construction
- Construction: Drywall construction; Shingle roof; Basement with Bilco doors, full basement with interior entry
- Exterior features: Side porch; Back yard fencing; Workshop and garage structures; Other exterior features
Interior
- Kitchen: Electric oven; Range hood; Refrigerator
- Bedrooms: Primary bedroom on the first floor; Two additional bedrooms on the second floor
- Flooring: Carpet; Laminate
- Bathrooms: One full bathroom on the first floor; One half bathroom on the second floor
- Heating & cooling: Forced air heating; Propane heating
- Interior features: 10 total rooms; Electric oven, range hood, refrigerator; Washer and dryer included
- Laundry & utility: Main-level laundry room; Utility room in the basement
Neighborhood map
What this means for you Summary
Snapshot
- This is a 3-bed/1.5-bath single-family listed at $150k.
Deal economics
- At list price, monthly cash flow is $54 ($652/yr) — positive.
- The deal already cash-flows at list — no discount required.
- To meet the 1% rule (rent ≥ 1% of price), the offer needs to be $140k (6.9% below list).
- Recommended offer: $140k (6.9% below list) — sets the bar for 1% rule.
Location & tenants
- Location reads 66/100 on livability (#645 in NY) — a middle-class / working-renter tenant base. Strengths: housing A+, employment A, cost of living A; Watch: crime F, amenities F, commute F.
- Fort Ann Central School District (rural): math 61% / reading 64% proficiency, ranked #231 of 755 in NY (top 31%) — acceptable for families but not a draw, mixed tenant base, ~2y average lease.
- Market conditions: 38 active listings in the ZIP; 106 units permitted in Washington County in 2024 (0 in 5+ unit buildings).
Forward outlook
- In year one you build about $16k of equity ($1k loan paydown + $15k appreciation (10.0% local appreciation)).
- Washington County population projected at -20% by 2050 — secular population decline; favor cash flow + early exit over multi-decade hold.
- At projected returns (10.0% appreciation + 3.0% rent growth), your $42k cash investment doubles in ~3 years — after that, you're playing with house money.
- By year 3, paydown + projected appreciation supports a ~$41k cash-out refi (75% LTV) — recoverable capital for the next deal without selling this one.
Negotiation context
- Only 4 days on market — expect competitive offers; lowballing is unlikely to land.
Risks & watch-outs
- Watch-outs: built in 1890 — expect roof / HVAC / electrical / plumbing capex.
Questions for the listing agent
- Built in 1890 — when were the roof, HVAC, electrical panel, plumbing, and water heater last replaced?
- Is there a deadline driving the sale (1031 exchange, divorce, estate, relocation)? That informs how much negotiation room exists.
- Schools are A-rated — typically a magnet for longer-tenancy family renters. What's the average tenant stay here, and is there a school-zone premium baked into asking?
- Crime grade is F in this area — have there been break-ins, vandalism, or insurance claims at this property in the last 3 years? What carrier currently insures it and at what premium?
- What's the average days-on-market for RENTAL listings here right now (not sales)? A rising rental-DOM trend means longer vacancies and softer asking-rent achievability than the comps imply.
- What's the recent tenant-quality profile in this submarket — average credit score on applications, eviction rate, late-payment / NSF rate, and stable-employment percentage? A property-management company in the area should have these aggregated.
- How much new for-sale + rental construction is in the pipeline within 1–3 miles? Heavy new supply typically softens prices + rents 12–24 months out; constrained supply supports both.
Investment metrics
- 1% rule
- 0.93% ✗
- Cap rate
- 6.73%
- Cash-on-cash
- 1.55%
- DSCR
- 1.07
- GRM
- 9.0
CMA / ARV
- ARV (on-the-fly)
- $265,794
- Comps found
- 3
Show comp detail 3 sales within ~0.75 mi
| Address | Dist | Beds/Ba | Sqft | Sold | Price | $/sf | Match |
|---|---|---|---|---|---|---|---|
| 25 Sunset Ave | 0.34mi | 4/2.0 (+1) | 1,504 (+5%) | 2mo | $310,000 | $206 | 67 |
| 80 Catherine St | 0.17mi | 4/1.0 (+1) | 1,508 (+6%) | 21mo | $90,000 | $60 | 58 |
| 16 W Starbuck Ln | 0.72mi | 3/2.0 | 1,443 (+1%) | 6mo | $268,000 | $186 | 58 |
Match score weights: distance 35% · size 25% · config 20% · recency 20%. Top-matched comps best support the ARV.
Projected returns pro-forma
10.0% appreciation · 3.0% rent growth · sell at horizon
- IRR
- 25.4%
- Equity multiple
- 3.03×
- Total profit
- $85,129
- Equity at exit
- $135,042
- IRR
- 22.4%
- Equity multiple
- 6.91×
- Total profit
- $248,027
- Equity at exit
- $291,223
Cash invested: $41,972 (down + closing). Projections, not guarantees.
Landlord ↔ Tenant lean methodology
- Overall (STATE)
- 15 Strongly Tenant-Friendly
- State New York
- 15 Strongly Tenant-Friendly · D+10
- County
- — inherits STATE
- City
- — inherits STATE
ZIP-level market 12827
- Home prices YoY
- 14.7%
- Active inventory
- 38
- Price-to-rent
- 9.0×
Monthly cashflow live
- Estimated rent
- $1,396 medium interval (Pro) →
- Mortgage (P&I)
- −$786
- Tax from tax record
- −$200 /mo · $2,396/yr
- Insurance
- −$62
- HOA
- −$0
- Vacancy / Maint / Mgmt
- −$293
- Net cashflow
- $54
Break-even live
UW: 25.0% down · 7.5% · 30yr · 1.5% tax · 5.0% vac · 8.0% maint · 8.0% mgmt
Financing live
Cash to close
- Down payment
- $37,475
- Closing costs
- $4,497
- Reserves months
- —
- Total cash needed
- —
Loan-product check · same deal, 3 products live
Conventional
25% down · 7.5% · 30yr
- Down + closing
- —
- Monthly P&I
- —
- Monthly cashflow
- —
- DSCR
- —
- Eligible?
- —
Personal DTI + credit; lowest rate.
DSCR
20% down · 8.5% · 30yr
- Down + closing
- —
- Monthly P&I
- —
- Monthly cashflow
- —
- DSCR
- —
- Eligible?
- —
No personal income docs; deal must DSCR.
Hard money
10% down · 12.0% · 12mo
- Down + closing
- —
- Monthly P&I
- —
- Monthly cashflow
- —
- DSCR
- —
- Eligible?
- —
Short-term bridge; refi at stabilization.
Listing history 2 events
-
2026-05-31status $149,900 Pending 4 DOM
-
2026-05-26$149,900 Active
ⓘ Source: listings_history table (triggers on properties + properties_extension) + one-shot
backfill from property_details.listing_events for pre-trigger history.
Tax reassessment forecast NY · Partial reset (capped growth)
- Current annual tax
- $2,396 · $200/mo
- Projected year-2 tax
- $2,465 · $205/mo
- Expected delta
- +$69/yr (+$6/mo · 2.9%)
ⓘ Screening estimate from a state-policy table — verify with the county assessor before closing.
Climate risk First Street
- Flood 1/10 Low 0% chance over 30 yrs
- Wildfire 1/10 Low
- Heat 3/10 Moderate 7 d/yr ≥96°F today · 16 d/yr by 30 yrs out
- Wind 2/10 Low 4% chance of damaging wind over 30 yrs
- Air quality 2/10 Low 0 unhealthy d/yr today · 1 by 30 yrs out
Nearby sold comps map
Loading sold comps map…
Walkable amenities ~0.75 mi
Loading nearby amenities…
Taxation est. · year 1
- Rental income
- $16,748
- − Mortgage interest
- −$8,397
- − Property taxes
- −$2,396
- − Insurance
- −$750
- − Repairs & maintenance
- −$1,340
- − Management
- −$1,340
- − Depreciation
- −$4,361
- Taxable loss
- −$1,835
- Est. tax savings @ 24.0%
- +$440
- After-tax cash flow
- $1,093/yr
For passive investors: Depreciation is non-cash, so a rental often shows a tax loss while cash-flowing — sheltering income. Rental losses are passive: they offset passive income freely, and up to $25,000/yr can offset ordinary (W-2) income if you actively participate and your MAGI is under $100k (phasing out to $0 by $150k); unused losses carry forward. On sale, claimed depreciation is recaptured at up to 25%, and gains may owe capital-gains tax (a 1031 exchange can defer both). Figures are a year-1 estimate at your 24.0% rate — not tax advice; consult a CPA.
Schools (NCES district)
- District
- Fort Ann Central School District
- NCES district ID
- 3611280
- Math proficiency
- 61% ▲ 6.00%
- Reading proficiency
- 64% ▲ 9.00%
- Median HH income
- $57,169
- Composite
- 55.34/100
- National rank
- #2716
- State rank
- #231 of 755 in NY
Livability — Fort Ann
- Score
- 66/100
- State rank
- #645
- US rank
- #12084
Category grades
Schools grade is shown separately in the Schools card above.
Census & demographics
- Census place
- Fort Ann, NY
- Population (ZIP)
- 3,935
Population outlook (Washington County) Hauer SSP2
- Today (2025)
- 59,576 people
- By 2030
- 57,618 · -3.3%
- By 2040
- 52,751 · -11.5%
- By 2050
- 47,514 · -20.2%
- By 2075
- 35,690 · -40.1%
- By 2100
- 24,807 · -58.4%
Race, ethnicity, and origin ACS 2023
- Neighborhood character
- Predominantly White (89%)
- Race & ethnicity
- White 89% Two or more races 9%
- Common ancestry
- Lithuanian 12% Slovak 2% Romanian 2%
- Foreign-born
- 0%
- Languages at home
- 99% English-only · Spanish 1%
Political lean MEDSL · Washington
- 2024 margin
- Strong R (+21.2) · D 39.4% · R 60.6%
- 2008→2024 swing
- -22.0pp toward R · 2008: 0.8pp · 2024: -21.2pp
- All cycles
- 2024: R+21.2 2020: R+15.6 2016: R+20.2 2012: D+1.6 2008: D+0.8
Not yet ingested
- Civics
- —
Market trends
- HPI YoY
- ▲ 43.92%
- Current HPI
- 342.8332
- Rent YoY
- —
- Metro
- —
- State GDP YoY
- ▲ 2.60%
- F500 in state
- 92
Industry mix (Fortune 500 HQ in NY)
| Industry | F500 HQs | Revenue |
|---|---|---|
| Financial Services | 10 | $950B |
|
||
| Consumer Goods | 9 | $162B |
|
||
| Insurance | 4 | $225B |
|
||
| Telecommunications | 2 | $144B |
|
||
| Pharmaceuticals | 2 | $112B |
|
||
| Media / Entertainment | 2 | $69B |
|
||
Price history
1 event — show timeline
- 2026-05-26 Listed $149,900 Global MLS
Property tax history
+3.0%/yrLatest (2025): $2,396 · +7.3% YoY. Source: county tax records.
Cash-flow waterfall
monthlySold comps — $/sqft
last 12 mo · ≤1 miLoading sold comps…