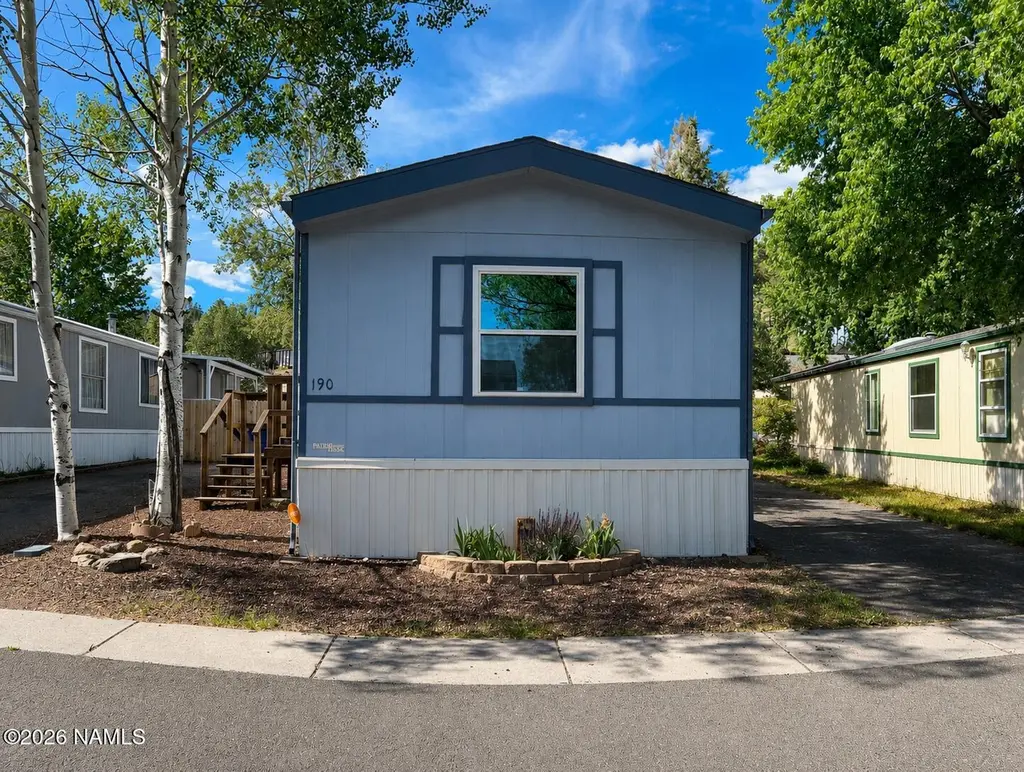
1450 W Kaibab Ln #190 · Flagstaff, AZ
Flood risk 9/10 · Severe
- FEMA flood zone
- X (unshaded)
- Chance of flooding over 30 yrs
- 0.99%
- Est. flood insurance / yr
- $507 – $1,088
Fire risk 8/10 · Major
- Est. fire insurance / yr
- $610 – $1,132
Heat risk 2/10 · Minimal
- Hot days now (above 86°F)
- 7 days/yr
- Hot days in 30 yrs
- 19 days/yr
Wind risk 1/10 · Minimal
- Chance of severe wind over 30 yrs
- —
Air-quality risk 1/10 · Minimal
- Unhealthy air days now
- 0 days/yr
- Unhealthy air days in 30 yrs
- 0 days/yr
Risk factors via First Street. Map © Google.
Why this score? — see what drove the C+ grade
The composite is a weighted blend of 9 inputs, each scored 0–100. Each bar is that input's sub-score; the figure is the points it added to the 100-point composite (weight × sub-score).
- Cash flow +30.0/30.0
- 1% rule +10.0/10.0
- DSCR +10.0/10.0
- Livability +3.1/5.0
- Rent growth +2.6/5.0
- Condition / age +2.5/5.0
- Schools +2.1/10.0
- ARV discount +1.5/15.0
- Appreciation +0.0/10.0
$125,000
🖨 Deal sheet 📄 Offer letter ✓ Due diligence
Listing remarks MLS
Welcome home to your well kept 2 bedroom, 2 bath home with a brand new fence, forest views, mature landscaping and a shed for storage. The property also has a gas stove, double sink, ceiling fans, ample parking and a spacious living room. Washer, dryer and fridge convey! Home has had one owner and has been lightly lived in. It is perfect for a starter home or an investment! No short term rentals allowed.
Key facts
- High quality windows
- Fresh paint
- New flooring
Tags
Property features AI
Finance
- HOA & community: Located in Westglen Mobile Home Park; Located on a land lease
Exterior
- Security: Smoke detector(s)
- Utilities: Electricity available; Natural gas available
- Home design: Single wide manufactured home
- Construction: Year built: reported by owner
- Exterior features: Partial fencing; Paved road access; Private and public maintained road access
Interior
- Kitchen: Gas Range
- Flooring: Laminate flooring
- Bathrooms: 2 bathrooms
- Heating & cooling: Ceiling fans; Wall/window cooling units
- Interior features: Eat-in kitchen; Pantry; Breakfast bar
Neighborhood map
What this means for you Summary
Snapshot
- This is a 2-bed/2.0-bath manufactured listed at $125k.
Deal economics
- At list price, monthly cash flow is $748 ($9k/yr) — positive.
- The deal already cash-flows at list — no discount required.
- Meets the 1% rule at list price ($2k rent vs $125k).
- Cap rate 14.1% vs local median 2.1% in Flagstaff — top-decile yield for the area; either an underpriced asset or a hidden risk that comps aren't pricing in. Stress-test before assuming the spread holds.
Location & tenants
- Location reads 61/100 on livability (#167 in AZ) — a middle-class / working-renter tenant base. Strengths: housing B; Watch: schools C-, employment C-, crime D-.
- Flagstaff Unified District (4192) (urban): math 18% / reading 29% proficiency, ranked #158 of 249 in AZ (top 64%) — low school quality limits family demand, transient renter base, plan for 1-2y turnover.
- Market conditions: Rents flat; 280 active listings in the ZIP; 17 comparable units currently listed for rent nearby; rentals lingering (median 44d on market — plan ~5-8 weeks vacancy on turnover, expect pricing pressure); 100% of comp listings sitting > 30 days — soft ceiling on asking rent; 698 units permitted in Coconino County in 2024 (354 in 5+ unit buildings).
- This rent runs 39% of the median local income ($65k/yr) — at the standard rent-burdened threshold; future hikes will face affordability resistance.
Forward outlook
- Local home prices are declining (-3.0%/yr); year-one equity from $864 of loan paydown is wiped out by about $4k of value loss. Plan a longer hold.
- Coconino County population projected at +20% by 2050 — long-run rental-demand tailwind backs the buy-and-hold thesis.
- At projected returns (-3.0% appreciation + 0.6% rent growth), your $35k cash investment doubles in ~6 years — after that, you're playing with house money.
Negotiation context
- Only 7 days on market — expect competitive offers; lowballing is unlikely to land.
- 2 sale attempts since 2y ago with the ask held roughly flat each time — persistent listings suggest the price (not the market) is what's stuck; bring a comps-based counter.
- Current owner paid $100k; 25% above their basis — modest negotiation headroom, anchor on the comps not their cost.
Risks & watch-outs
- Watch-outs: flood insurance adds $66/mo.
- Climate carrying-cost: severe flood risk; severe wildfire risk — expect insurance premiums to compound above CPI over the hold.
Questions for the listing agent
- What's the actual annual flood-insurance premium (NFIP or private), and is the property in a SFHA with mandatory coverage?
- Is there a deadline driving the sale (1031 exchange, divorce, estate, relocation)? That informs how much negotiation room exists.
- Crime grade is D in this area — have there been break-ins, vandalism, or insurance claims at this property in the last 3 years? What carrier currently insures it and at what premium?
- What's the average days-on-market for RENTAL listings here right now (not sales)? A rising rental-DOM trend means longer vacancies and softer asking-rent achievability than the comps imply.
- What's the recent tenant-quality profile in this submarket — average credit score on applications, eviction rate, late-payment / NSF rate, and stable-employment percentage? A property-management company in the area should have these aggregated.
- How much new for-sale + rental construction is in the pipeline within 1–3 miles? Heavy new supply typically softens prices + rents 12–24 months out; constrained supply supports both.
Investment metrics
- 1% rule
- 1.70% ✓
- Cap rate
- 14.11%
- Cash-on-cash
- 27.93%
- DSCR
- 2.24
- GRM
- 4.9
CMA / ARV
- ARV (on-the-fly)
- $110,240
- Comps found
- 12
Show comp detail 12 sales within ~0.75 mi
| Address | Dist | Beds/Ba | Sqft | Sold | Price | $/sf | Match |
|---|---|---|---|---|---|---|---|
| 1450 W Kaibab Ln #147 | 0.14mi | 2/2.0 | 1,040 (0%) | 6mo | $85,000 | $82 | 88 |
| 1450 W Kaibab Ln #125 | 0.00mi | 2/2.0 | 1,088 (+5%) | 19mo | $94,000 | $86 | 76 |
| 1450 W Kaibab Ln #91 | 0.00mi | 2/2.0 | 952 (-8%) | 16mo | $80,000 | $84 | 73 |
| 1450 W Kaibab Ln #70 | 0.00mi | 3/2.0 (+1) | 1,152 (+11%) | 9mo | $117,000 | $102 | 70 |
| 1460 W Kaibab Ln #111 | 0.09mi | 2/2.0 | 992 (-5%) | 22mo | $112,000 | $113 | 70 |
| 1450 W Kaibab Ln Lot 157 | 0.15mi | 3/2.0 (+1) | 937 (-10%) | 5mo | $124,500 | $133 | 68 |
| 1450 W Kaibab Ln #79 | 0.00mi | 2/2.0 | 950 (-9%) | 22mo | $89,000 | $94 | 67 |
| 1658 W Sherrie Dr | 0.18mi | 3/2.0 (+1) | 1,056 (+2%) | 22mo | $385,000 | $365 | 66 |
| 1450 W Kaibab Ln #62 | 0.15mi | 2/2.0 | 896 (-14%) | 9mo | $95,000 | $106 | 62 |
| 1450 W Kaibab Ln #110 | 0.00mi | 2/1.0 | 896 (-14%) | 18mo | $57,000 | $64 | 58 |
| 2412 W Rio Grande Ct | 0.68mi | 3/2.0 (+1) | 1,188 (+14%) | 7mo | $399,000 | $336 | 33 |
| 1455 S Union Pacific St | 0.75mi | 3/2.0 (+1) | 1,134 (+9%) | 17mo | $435,000 | $384 | 31 |
Match score weights: distance 35% · size 25% · config 20% · recency 20%. Top-matched comps best support the ARV.
Projected returns pro-forma
-3.0% appreciation · 0.55% rent growth · sell at horizon
- IRR
- 16.4%
- Equity multiple
- 1.64×
- Total profit
- $22,357
- Equity at exit
- $18,638
- IRR
- 23.0%
- Equity multiple
- 2.75×
- Total profit
- $61,149
- Equity at exit
- $10,808
Cash invested: $35,000 (down + closing). Projections, not guarantees.
Landlord ↔ Tenant lean methodology
- Overall (STATE)
- 87 Strongly Landlord-Friendly
- State Arizona
- 87 Strongly Landlord-Friendly · R+3
- County
- — inherits STATE
- City
- — inherits STATE
ZIP-level market 86001
- Rents YoY
- 0.6%
- Active inventory
- 280
- Price-to-rent
- 4.9×
Monthly cashflow live
- Estimated rent
- $2,125 high interval (Pro) →
- Mortgage (P&I)
- −$656
- Tax est. 1.5%
- −$156 /mo · $1,875/yr
- Insurance
- −$52
- Flood insurance flood zone
- −$66 /mo · $798/yr
- HOA
- −$0
- Vacancy / Maint / Mgmt
- −$446
- Net cashflow
- $748
Break-even live
UW: 25.0% down · 7.5% · 30yr · 1.5% tax · 5.0% vac · 8.0% maint · 8.0% mgmt
Financing live
Cash to close
- Down payment
- $31,250
- Closing costs
- $3,750
- Reserves months
- —
- Total cash needed
- —
Loan-product check · same deal, 3 products live
Conventional
25% down · 7.5% · 30yr
- Down + closing
- —
- Monthly P&I
- —
- Monthly cashflow
- —
- DSCR
- —
- Eligible?
- —
Personal DTI + credit; lowest rate.
DSCR
20% down · 8.5% · 30yr
- Down + closing
- —
- Monthly P&I
- —
- Monthly cashflow
- —
- DSCR
- —
- Eligible?
- —
No personal income docs; deal must DSCR.
Hard money
10% down · 12.0% · 12mo
- Down + closing
- —
- Monthly P&I
- —
- Monthly cashflow
- —
- DSCR
- —
- Eligible?
- —
Short-term bridge; refi at stabilization.
Rent comps 17 comps
| Address | Beds | Baths | Sqft | Rent | $/sqft | DOM | Units | Dist |
|---|---|---|---|---|---|---|---|---|
| 1580 S Plaza Way Flagstaff, AZ | 1.0–2.0 | 1.0–2.0 | 875 | $2,455 | $2.81 | 44d | 12 | 0.34mi |
| 1515 S Yale St Flagstaff, AZ | 2.0 | 1.0–2.0 | 860 | $1,740 | $2.02 | 44d | 6 | 0.41mi |
| 700 W University Ave Flagstaff, AZ | 2.0 | 1.0–2.0 | 675 | $1,735 | $2.57 | 44d | 1 | 0.44mi |
| 923 W University Ave Flagstaff, AZ | 1.0–2.0 | 1.0–2.0 | 877 | $2,304 | $2.63 | 44d | 36 | 0.49mi |
| 1385 W University Ave Flagstaff, AZ | 2.0 | 2.0 | 906 | $1,725 | $1.90 | 44d | 3 | 0.50mi |
| 1000 W Forest Meadows St Flagstaff, AZ | 2.0 | 2.0 | 947 | $1,925 | $2.03 | 44d | 1 | 0.52mi |
| 813 W University Ave Flagstaff, AZ | 2.0 | 1.0–2.0 | 567 | $1,840 | $3.25 | 44d | 1 | 0.53mi |
| 800 W Forest Meadows St Flagstaff, AZ | 1.0–3.0 | 1.0–2.0 | 847 | $2,548 | $3.01 | 44d | 32 | 0.66mi |
| 927 W Forest Meadows St Flagstaff, AZ | 1.0–2.0 | 1.0–2.0 | 958 | $2,806 | $2.93 | 44d | 11 | 0.67mi |
| 1830 S Milton Rd Flagstaff, AZ | 1.0–2.0 | 1.0–2.0 | 695 | $2,129 | $3.06 | 44d | 23 | 0.84mi |
| 600 W University Heights Dr N Flagstaff, AZ | 1.0–2.0 | 1.0–2.0 | 766 | $2,254 | $2.94 | 44d | 4 | 1.15mi |
| 3200 S Litzler Dr Unit 9-236 Flagstaff, AZ | 2.0 | 2.0 | 776 | $1,800 | $2.32 | 44d | 1 | 1.25mi |
| 2701 S Woody Mountain Rd Flagstaff, AZ | 1.0–3.0 | 1.0–2.0 | 1078 | $2,642 | $2.45 | 44d | 77 | 1.27mi |
| 319 N Park St Unit G Flagstaff, AZ | 2.0 | 1.0 | 800 | $1,850 | $2.31 | 44d | 1 | 1.33mi |
| 605 S Lone Tree Rd Unit 4 Flagstaff, AZ | 2.0 | 1.0 | 756 | $1,650 | $2.18 | 44d | 1 | 1.36mi |
| 201 S Elden St Unit 10 Flagstaff, AZ | 2.0 | 1.0 | 800 | $2,099 | $2.62 | 44d | 1 | 1.38mi |
| 2292 S Alvan Clark Blvd Flagstaff, AZ | 2.0–3.0 | 1.0–2.0 | 978 | $1,473 | $1.51 | 44d | 12 | 1.43mi |
Listing history 7 events
-
2026-06-19days on market $125,000 Active 7 DOM
-
2026-06-18days on market $125,000 Active 6 DOM
-
2026-06-17days on market $125,000 Active 5 DOM
-
2026-06-16days on market $125,000 Active 4 DOM
-
2026-06-15days on market $125,000 Active 3 DOM
-
2026-06-13remarks 666-char remark
-
2026-06-13$125,000 Active 1 DOM
ⓘ Source: listings_history table (triggers on properties + properties_extension) + one-shot
backfill from property_details.listing_events for pre-trigger history.
Climate risk First Street
- Flood 9/10 Extreme FEMA zone X (unshaded) · 99% chance over 30 yrs
- Wildfire 8/10 Severe
- Heat 2/10 Low 7 d/yr ≥86°F today · 19 d/yr by 30 yrs out
- Wind 1/10 Low
- Air quality 1/10 Low 0 unhealthy d/yr today · 0 by 30 yrs out
Nearby sold comps map
Loading sold comps map…
Walkable amenities ~0.75 mi
Loading nearby amenities…
Taxation est. · year 1
- Rental income
- $25,496
- − Mortgage interest
- −$7,002
- − Property taxes
- −$1,875
- − Insurance
- −$1,422
- − Repairs & maintenance
- −$2,040
- − Management
- −$2,040
- − Depreciation
- −$3,636
- Taxable income
- $7,481
- Est. tax owed @ 24.0%
- −$1,795
- After-tax cash flow
- $7,183/yr
For passive investors: Depreciation is non-cash, so a rental often shows a tax loss while cash-flowing — sheltering income. Rental losses are passive: they offset passive income freely, and up to $25,000/yr can offset ordinary (W-2) income if you actively participate and your MAGI is under $100k (phasing out to $0 by $150k); unused losses carry forward. On sale, claimed depreciation is recaptured at up to 25%, and gains may owe capital-gains tax (a 1031 exchange can defer both). Figures are a year-1 estimate at your 24.0% rate — not tax advice; consult a CPA.
Schools (NCES district)
- District
- Flagstaff Unified District (4192)
- NCES district ID
- 0402860
- Math proficiency
- 18% ▼ -16.00%
- Reading proficiency
- 29% ▼ -10.00%
- Median HH income
- $53,510
- Composite
- 21.11/100
- National rank
- #8437
- State rank
- #158 of 249 in AZ
Livability — Flagstaff
- Score
- 61/100
- State rank
- #167
- US rank
- #18308
Category grades
Schools grade is shown separately in the Schools card above.
Census & demographics
- Census place
- Flagstaff, AZ
- County
- Coconino County · 91,667 people
- City population
- 91,667
- Metro
- Flagstaff, AZ
- Population (ZIP)
- 37,312
- Household income
- $64,626
- Rent vs Own
- Severe rent burden
- 3117.0
Population outlook (Coconino County) Hauer SSP2
- Today (2025)
- 150,645 people
- By 2030
- 156,857 · +4.1%
- By 2040
- 168,714 · +12.0%
- By 2050
- 181,082 · +20.2%
- By 2075
- 218,399 · +45.0%
- By 2100
- 238,853 · +58.6%
Race, ethnicity, and origin ACS 2023
- Neighborhood character
- Diverse neighborhood (Simpson 0.59)
- Race & ethnicity
- White 62% Hispanic / Latino 15% Native American 12% Two or more races 9% Asian 3% Black 2%
- Hispanic origin (detail)
- Mexican 10%
- Common ancestry
- Italian 2% Slovak 2% Romanian 2%
- Foreign-born
- 6% · Canada, China, Jamaica
- Languages at home
- 84% English-only · Spanish 8% Other Indo-European 1% Chinese 1%
Political lean MEDSL · Coconino
- 2024 margin
- D (+19.9) · D 59.2% · R 39.4% · Other 1.4%
- 2008→2024 swing
- +2.9pp toward D · 2008: 17.0pp · 2024: 19.9pp
- All cycles
- 2024: D+19.9 2020: D+24.1 2016: D+19.4 2012: D+14.9 2008: D+17.0
Not yet ingested
- Civics
- —
Market trends
- HPI YoY
- ▼ -488.37%
- Current HPI
- 393.2551
- Rent YoY
- ▲ 0.55%
- Metro
- Flagstaff, AZ
- State GDP YoY
- ▲ 4.54%
- F500 in state
- 20
Industry mix (Fortune 500 HQ in AZ)
| Industry | F500 HQs | Revenue |
|---|---|---|
| Technology | 2 | $13B |
|
||
| Mining / Metals | 1 | $23B |
|
||
| Environmental Services | 1 | $16B |
|
||
| Metals / Steel | 1 | $14B |
|
||
| Technology Distribution | 1 | $9B |
|
||
| Homebuilding | 1 | $8B |
|
||
Price history
+25.0% since first listed3 events — show timeline
- 2026-06-12 Listed $125,000 NAZMLS
- 2024-06-17 Sold (MLS) $100,000 NAZMLS
- 2024-04-12 Listed $100,000 NAZMLS
Cash-flow waterfall
monthlySold comps — $/sqft
last 12 mo · ≤1 miLoading sold comps…