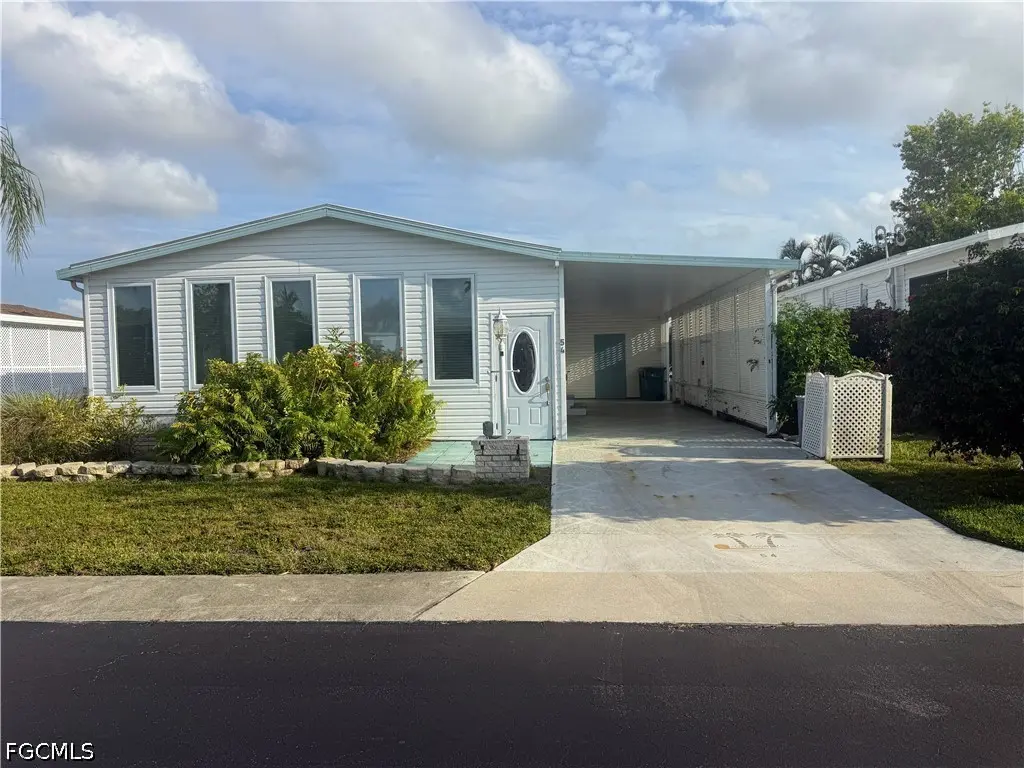
54 Oceans Blvd #54 · Berkshire Lakes, FL
Flood risk 5/10 · Moderate
- FEMA flood zone
- X (shaded)
- Chance of flooding over 30 yrs
- 0.48%
- Est. flood insurance / yr
- $507 – $1,088
Fire risk 1/10 · Minimal
- Est. fire insurance / yr
- $947 – $1,759
Heat risk 10/10 · Severe
- Hot days now (above 107°F)
- 7 days/yr
- Hot days in 30 yrs
- 27 days/yr
Wind risk 10/10 · Severe
- Chance of severe wind over 30 yrs
- 99.0%
Air-quality risk 2/10 · Minimal
- Unhealthy air days now
- 2 days/yr
- Unhealthy air days in 30 yrs
- 2 days/yr
Risk factors via First Street. Map © Google.
Why this score? — see what drove the B- grade
The composite is a weighted blend of 9 inputs, each scored 0–100. Each bar is that input's sub-score; the figure is the points it added to the 100-point composite (weight × sub-score).
- Cash flow +30.0/30.0
- 1% rule +10.0/10.0
- DSCR +10.0/10.0
- ARV discount +7.5/15.0
- Schools +5.0/10.0
- Livability +2.5/5.0
- Condition / age +2.5/5.0
- Rent growth +2.2/5.0
- Appreciation +0.0/10.0
$169,500
🖨 Deal sheet 📄 Offer letter ✓ Due diligence
Listing remarks
Welcome to paradise in Windjammer Village — one of Naples’ most desirable 55+ manufactured home communities! This beautifully maintained manufactured home offers the perfect blend of comfort, convenience, and the relaxed Southwest Florida lifestyle retirees dream about. Located just minutes from world-famous Gulf beaches, shopping, dining, golf courses, and vibrant downtown Naples, this home places you right in the heart of it all while still offering the peaceful charm of community living. Inside, you’ll find a bright and inviting layout with spacious living areas, abundant natural light, and plenty of room to entertain family and friends. Whether you’re looking for
Key facts
- Manufactured home
- Gulf beaches
- 2 parking spots
Tags
Property features AI
Finance
- Financial info: Pets allowed conditionally (call for details), maximum 2 pets
- HOA & community: Homeowners association (monthly fee $162); Association covers grounds maintenance, road maintenance, and street lights; Community amenities include clubhouse, pool, spa/hot tub, tennis courts, pickleball, bocce court, shuffleboard, pier, sidewalks; Gated community with street lights; Senior community; Approximately 300 units in the community
Exterior
- Parking: Attached carport; 2 covered spaces (carport)
- Security: Smoke detector(s)
- Utilities: Cable available; Sewer assessment paid; Water assessment paid
- Home design: Manufactured home with vinyl siding; Single-story; Entry on level 1; Faces north; Resale property
- Construction: Shingle roof
- Exterior features: Storage; Rectangular lot; South exposure; Community pool
Interior
- Kitchen: Electric cooktop; Range; Microwave; Refrigerator
- Flooring: Laminate flooring; Tile flooring
- Bathrooms: 2 full bathrooms
- Heating & cooling: Central heating (electric); Central air conditioning (electric); Ceiling fan(s)
- Interior features: French doors; Bar; Family/Dining room; Living/Dining room; Atrium-style French door(s); Shower only with separate shower; Furnished
- Laundry & utility: Washer and dryer connections inside; Dryer included
Neighborhood map
What this means for you Summary
Snapshot
- This is a 2-bed/2.0-bath condo listed at $170k.
Deal economics
- At list price, monthly cash flow is $914 ($11k/yr) — positive.
- The deal already cash-flows at list — no discount required.
- Meets the 1% rule at list price ($3k rent vs $170k).
Location & tenants
- Location reads: area grade B — affects rentability + tenant quality, not the cash-flow math above.
- Collier (suburban): math 60% / reading 56% proficiency, ranked #16 of 73 in FL (top 22%) — acceptable for families but not a draw, mixed tenant base, ~2y average lease.
- Market conditions: Rents soft (-1.1%/yr); 436 active listings in the ZIP; 40 comparable units currently listed for rent nearby; rentals at typical pace (median 22d on market — plan ~3-4 weeks tenant-placement turnaround); 3,520 units permitted in Collier County in 2024 (959 in 5+ unit buildings).
- At $2,712/mo this rent would consume 45% of the median local household income ($72k/yr) (locally 1423% of renters already pay >50% of income on rent) — very limited rent-growth headroom before tenants either downsize or default.
Forward outlook
- Local home prices are declining (-3.0%/yr); year-one equity from $1k of loan paydown is wiped out by about $5k of value loss. Plan a longer hold.
- Collier County population projected at +30% by 2050 — long-run rental-demand tailwind backs the buy-and-hold thesis.
- At projected returns (-3.0% appreciation + 0.0% rent growth), your $47k cash investment doubles in ~7 years — after that, you're playing with house money.
Negotiation context
- Only 4 days on market — expect competitive offers; lowballing is unlikely to land.
Risks & watch-outs
- Climate carrying-cost: moderate flood risk; severe wind risk, 99% chance of damaging wind over 30y; extreme-heat days projected 7→27/yr by 2055 (HVAC capex compounding) — expect insurance premiums to compound above CPI over the hold.
Questions for the listing agent
- What does the HOA fee cover, when was the last increase, and are there any pending special assessments or reserve-fund shortfalls?
- Any open or pending special assessments — roof, HVAC, plumbing, elevator, façade? What's the per-unit balance and payoff schedule, and is the seller paying it off at close or rolling it to the buyer?
- Is there a deadline driving the sale (1031 exchange, divorce, estate, relocation)? That informs how much negotiation room exists.
- What's the average days-on-market for RENTAL listings here right now (not sales)? A rising rental-DOM trend means longer vacancies and softer asking-rent achievability than the comps imply.
- What's the recent tenant-quality profile in this submarket — average credit score on applications, eviction rate, late-payment / NSF rate, and stable-employment percentage? A property-management company in the area should have these aggregated.
- How much new apartment / multifamily construction is in the pipeline within 1–3 miles? Heavy new supply (>2% of stock underway) typically softens rents 12–24 months out; light construction supports rent growth.
Investment metrics
- 1% rule
- 1.60% ✓
- Cap rate
- 12.76%
- Cash-on-cash
- 23.11%
- DSCR
- 2.03
- GRM
- 5.2
CMA / ARV
No comps found within radius.
Projected returns pro-forma
-3.0% appreciation · 0.0% rent growth · sell at horizon
- IRR
- 12.6%
- Equity multiple
- 1.48×
- Total profit
- $22,884
- Equity at exit
- $25,273
- IRR
- 19.0%
- Equity multiple
- 2.36×
- Total profit
- $64,492
- Equity at exit
- $14,655
Cash invested: $47,460 (down + closing). Projections, not guarantees.
Landlord ↔ Tenant lean methodology
- Overall (STATE)
- 87 Strongly Landlord-Friendly
- State Florida
- 87 Strongly Landlord-Friendly · R+3
- County
- — inherits STATE
- City
- — inherits STATE
ZIP-level market 34104
- Rents YoY
- -1.1%
- Active inventory
- 436
- Price-to-rent
- 5.2×
Monthly cashflow live
- Estimated rent
- $2,712 high interval (Pro) →
- Mortgage (P&I)
- −$889
- Tax from tax record
- −$107 /mo · $1,282/yr
- Insurance
- −$71
- HOA
- −$162
- Vacancy / Maint / Mgmt
- −$570
- Net cashflow
- $914
Break-even live
UW: 25.0% down · 7.5% · 30yr · 1.5% tax · 5.0% vac · 8.0% maint · 8.0% mgmt
Financing live
Cash to close
- Down payment
- $42,375
- Closing costs
- $5,085
- Reserves months
- —
- Total cash needed
- —
Loan-product check · same deal, 3 products live
Conventional
25% down · 7.5% · 30yr
- Down + closing
- —
- Monthly P&I
- —
- Monthly cashflow
- —
- DSCR
- —
- Eligible?
- —
Personal DTI + credit; lowest rate.
DSCR
20% down · 8.5% · 30yr
- Down + closing
- —
- Monthly P&I
- —
- Monthly cashflow
- —
- DSCR
- —
- Eligible?
- —
No personal income docs; deal must DSCR.
Hard money
10% down · 12.0% · 12mo
- Down + closing
- —
- Monthly P&I
- —
- Monthly cashflow
- —
- DSCR
- —
- Eligible?
- —
Short-term bridge; refi at stabilization.
Rent comps 40 comps
| Address | Beds | Baths | Sqft | Rent | $/sqft | DOM | Units | Dist |
|---|---|---|---|---|---|---|---|---|
| 5301 Whitten Dr #81 Naples, FL | 3.0 | 2.0 | 1386 | $2,700 | $1.95 | 23d | 1 | 0.35mi |
| 5257 Whitten Dr Naples, FL | 2.0 | 2.0 | 1500 | $2,500 | $1.67 | 14d | 1 | 0.44mi |
| 6700 Dennis Cir Unit A103 Naples, FL | 2.0 | 2.0 | 1308 | $2,000 | $1.53 | 14d | 1 | 0.47mi |
| 7065 Dennis Cir #302 Naples, FL | 2.0 | 2.0 | 1097 | $4,000 | $3.65 | 21d | 1 | 0.49mi |
| 6825 Sterling Greens Dr #102 Naples, FL | 3.0 | 2.0 | 1499 | $4,500 | $3.00 | 23d | 1 | 0.52mi |
| 6816 Sterling Greens Pl #105 Naples, FL | 2.0 | 2.0 | 1243 | $1,895 | $1.52 | 21d | 1 | 0.52mi |
| 6816 Sterling Greens Dr Unit 1105 Naples, FL | 2.0 | 2.0 | 1243 | $1,895 | $1.52 | 14d | 1 | 0.52mi |
| 1051 Eastham Way Unit B104 Naples, FL | 2.0 | 2.0 | 1091 | $4,300 | $3.94 | 14d | 1 | 0.57mi |
| 6828 Sterling Greens Dr Unit 4105 Naples, FL | 2.0 | 2.0 | 1242 | $3,750 | $3.02 | 14d | 1 | 0.57mi |
| 1100 Eastham Way Unit A-105 Naples, FL | 2.0 | 2.0 | 1184 | $4,500 | $3.80 | 14d | 1 | 0.62mi |
| 1748 Royal Cir Naples, FL | 3.0 | 2.0 | 1451 | $3,200 | $2.21 | 23d | 1 | 0.63mi |
| 1787 Reuven Cir Unit 1001 Naples, FL | 2.0 | 2.0 | 1112 | $1,300 | $1.17 | 14d | 1 | 0.69mi |
| 193 Fox Glen Dr Naples, FL | 3.0 | 2.0 | 1345 | $6,500 | $4.83 | 23d | 1 | 0.70mi |
| 1810 Florida Club Cir Naples, FL | 2.0 | 2.0 | 1200 | $2,075 | $1.73 | 14d | 2 | 0.77mi |
| 1075 Foxfire Ln Naples, FL | 2.0 | 2.0 | 1092 | $3,300 | $3.02 | 23d | 3 | 0.78mi |
| 1820 Florida Club Cir Naples, FL | 3.0 | 2.0 | 1282 | $2,850 | $2.22 | 23d | 2 | 0.79mi |
| 6643 Craven Hill Way Naples, FL | 3.0 | 2.0 | 1384 | $2,900 | $2.10 | 14d | 1 | 0.80mi |
| 1840 Florida Club Cir #5309 Naples, FL | 2.0 | 1.0 | 1328 | $2,300 | $1.73 | 23d | 1 | 0.83mi |
| 1830 Florida Club Cir #4111 Naples, FL | 3.0 | 2.0 | 1189 | $2,250 | $1.89 | 21d | 1 | 0.84mi |
| 1950 W Crown Pointe Blvd Unit B207 Naples, FL | 2.0 | 2.0 | 1129 | $1,950 | $1.73 | 23d | 1 | 0.85mi |
| 2972 Kings Lake Blvd #2972 Naples, FL | 2.0 | 2.0 | 1100 | $3,000 | $2.73 | 23d | 1 | 0.85mi |
| 6954 Avalon Cir #703 Naples, FL | 2.0 | 2.0 | 1467 | $3,000 | $2.04 | 14d | 1 | 0.86mi |
| 6954 Avalon Cir #702 Naples, FL | 2.0 | 2.0 | 1467 | $4,500 | $3.07 | 23d | 1 | 0.86mi |
| 882 Bluebird St Naples, FL | 3.0 | 2.0 | 1308 | $6,000 | $4.59 | 23d | 1 | 0.87mi |
| 1835 Florida Club Cir #3201 Naples, FL | 3.0 | 2.0 | 1375 | $2,095 | $1.52 | 14d | 1 | 0.88mi |
| 2050 W Crown Pointe Blvd Unit C214 Naples, FL | 3.0 | 2.0 | 1267 | $4,200 | $3.31 | 23d | 1 | 0.91mi |
| 1865 Florida Club Dr #6211 Naples, FL | 3.0 | 2.0 | 1500 | $2,000 | $1.33 | 14d | 1 | 0.94mi |
| 1865 Florida Club Dr Naples, FL | 2.0–3.0 | 1.0–2.0 | 1214 | $1,750 | $1.44 | 23d | 2 | 0.95mi |
| 1701 Courtyard Way Naples, FL | 2.0 | 2.0 | 1072 | $1,990 | $1.86 | 23d | 1 | 0.96mi |
| 1933 Courtyard Way Unit D-103 Naples, FL | 2.0 | 2.0 | 947 | $1,850 | $1.95 | 14d | 1 | 0.98mi |
| 1765 Courtyard Way Unit C-104 Naples, FL | 2.0 | 2.0 | 1132 | $2,700 | $2.39 | 14d | 1 | 0.99mi |
| 1765 Courtyard Way Unit C206 Naples, FL | 2.0 | 2.5 | 1150 | $1,650 | $1.43 | 14d | 1 | 0.99mi |
| 1875 Florida Club Dr Naples, FL | 2.0 | 1.0 | 1016 | $1,722 | $1.69 | 23d | 2 | 0.99mi |
| 1895 Courtyard Way #103 Naples, FL | 3.0 | 2.0 | 1046 | $2,200 | $2.10 | 21d | 1 | 1.02mi |
| 4502 Parrot Ave Naples, FL | 3.0 | 2.0 | 1200 | $2,950 | $2.46 | 23d | 1 | 1.05mi |
| 1700 Windy Pines Dr #1 Naples, FL | 2.0 | 2.0 | 1349 | $2,300 | $1.70 | 21d | 1 | 1.05mi |
| 1802 Kings Lake Blvd Unit 2-101 Naples, FL | 2.0 | 2.0 | 1465 | $5,500 | $3.75 | 23d | 1 | 1.06mi |
| 7380 Saint Ives Way Naples, FL | 2.0 | 2.0 | 1026 | $4,400 | $4.29 | 23d | 2 | 1.08mi |
| 141 Bristol Ln Unit C21 Naples, FL | 2.0 | 2.0 | 1400 | $5,900 | $4.21 | 23d | 1 | 1.08mi |
| 4210 Looking Glass Ln Unit 4210 Naples, FL | 2.0 | 2.0 | 1300 | $3,000 | $2.31 | 14d | 1 | 1.08mi |
HOA detail condo
- Monthly dues
- $162 · $1,944/yr
- Assessments
- None detected in remarks — confirm with the listing agent.
Listing history 2 events
-
2026-05-30days on market $169,500 Active 4 DOM
-
2026-05-26$169,500 Active
ⓘ Source: listings_history table (triggers on properties + properties_extension) + one-shot
backfill from property_details.listing_events for pre-trigger history.
Tax reassessment forecast FL · Resets to sale price
- Current annual tax
- $1,282 · $107/mo
- Projected year-2 tax
- $1,407 · $117/mo
- Expected delta
- +$125/yr (+$10/mo · 9.7%)
ⓘ Screening estimate from a state-policy table — verify with the county assessor before closing.
Climate risk First Street
- Flood 5/10 Major FEMA zone X (shaded) · 48% chance over 30 yrs
- Wildfire 1/10 Low
- Heat 10/10 Extreme 7 d/yr ≥107°F today · 27 d/yr by 30 yrs out
- Wind 10/10 Extreme 99% chance of damaging wind over 30 yrs
- Air quality 2/10 Low 2 unhealthy d/yr today · 2 by 30 yrs out
Nearby sold comps map
Loading sold comps map…
Walkable amenities ~0.75 mi
Loading nearby amenities…
Taxation est. · year 1
- Rental income
- $32,544
- − Mortgage interest
- −$9,495
- − Property taxes
- −$1,282
- − Insurance
- −$848
- − Repairs & maintenance
- −$2,604
- − Management
- −$2,604
- − HOA
- −$1,944
- − Depreciation
- −$4,931
- Taxable income
- $8,838
- Est. tax owed @ 24.0%
- −$2,121
- After-tax cash flow
- $8,849/yr
For passive investors: Depreciation is non-cash, so a rental often shows a tax loss while cash-flowing — sheltering income. Rental losses are passive: they offset passive income freely, and up to $25,000/yr can offset ordinary (W-2) income if you actively participate and your MAGI is under $100k (phasing out to $0 by $150k); unused losses carry forward. On sale, claimed depreciation is recaptured at up to 25%, and gains may owe capital-gains tax (a 1031 exchange can defer both). Figures are a year-1 estimate at your 24.0% rate — not tax advice; consult a CPA.
Schools (NCES district)
- District
- Collier
- NCES district ID
- 1200330
- Math proficiency
- 60% ▼ -4.00%
- Reading proficiency
- 56% ▼ -2.00%
- Median HH income
- $58,275
- Composite
- 50.23/100
- National rank
- #1892
- State rank
- #16 of 73 in FL
Livability — Berkshire Lakes
No livability data for this city. (Only ~50 U.S. cities are tracked.)
Census & demographics
- County
- Collier County · 396,295 people
- Metro
- Naples-Marco Island, FL
- Population (ZIP)
- 26,408
- Household income
- $71,686
- Rent vs Own
- Severe rent burden
- 1423.0
Population outlook (Collier County) Hauer SSP2
- Today (2025)
- 420,858 people
- By 2030
- 450,054 · +6.9%
- By 2040
- 502,232 · +19.3%
- By 2050
- 544,932 · +29.5%
- By 2075
- 627,203 · +49.0%
- By 2100
- 659,015 · +56.6%
Race, ethnicity, and origin ACS 2023
- Neighborhood character
- Majority White (62%)
- Race & ethnicity
- White 62% Hispanic / Latino 30% Two or more races 19% Black 4% Asian 2%
- Hispanic origin (detail)
- Mexican 7% Puerto Rican 3% Cuban 6% Dominican 1%
- Common ancestry
- Lithuanian 6% Romanian 3% Hispanic 2%
- Foreign-born
- 30% · Canada, Jamaica, Dominican Republic
- Languages at home
- 66% English-only · Spanish 24% French/Haitian/Cajun 5% Russian/Polish/Slavic 1%
Political lean MEDSL · Collier
- 2024 margin
- Solid R (+33.1) · D 33.1% · R 66.2%
- 2008→2024 swing
- -10.6pp toward R · 2008: -22.5pp · 2024: -33.1pp
- All cycles
- 2024: R+33.1 2020: R+24.7 2016: R+26.0 2012: R+30.1 2008: R+22.5
Not yet ingested
- Civics
- —
Market trends
- HPI YoY
- ▼ -252.48%
- Current HPI
- 259.3498
- Rent YoY
- ▼ -1.10%
- Metro
- Naples-Marco Island, FL
- State GDP YoY
- ▲ 3.28%
- F500 in state
- 36
Industry mix (Fortune 500 HQ in FL)
| Industry | F500 HQs | Revenue |
|---|---|---|
| Industrial Technology | 2 | $29B |
|
||
| Insurance | 2 | $17B |
|
||
| Retail | 1 | $60B |
|
||
| Technology Distribution | 1 | $58B |
|
||
| Homebuilding | 1 | $35B |
|
||
| Technology Manufacturing | 1 | $35B |
|
||
Price history
1 event — show timeline
- 2026-05-26 Listed $169,500 FORTMLS
Property tax history
+10.9%/yrLatest (2025): $1,282 · +10.1% YoY. Source: county tax records.
Cash-flow waterfall
monthlySold comps — $/sqft
last 12 mo · ≤1 miLoading sold comps…