 Duplex
516 Nathan Hale Rd · West Palm Beach, FL
Flood risk 4/10 · Minor
- FEMA flood zone
- X (unshaded)
- Chance of flooding over 30 yrs
- 0.22%
- Est. flood insurance / yr
- $507 – $1,088
Fire risk 1/10 · Minimal
- Est. fire insurance / yr
- $947 – $1,759
Heat risk 10/10 · Severe
- Hot days now (above 105°F)
- 7 days/yr
- Hot days in 30 yrs
- 25 days/yr
Wind risk 10/10 · Severe
- Chance of severe wind over 30 yrs
- 99.0%
Air-quality risk 2/10 · Minimal
- Unhealthy air days now
- 1 days/yr
- Unhealthy air days in 30 yrs
- 1 days/yr
Risk factors via First Street. Map © Google.
Why this score? — see what drove the D grade
The composite is a weighted blend of 9 inputs, each scored 0–100. Each bar is that input's sub-score; the figure is the points it added to the 100-point composite (weight × sub-score).
- Cash flow +12.8/30.0
- ARV discount +7.5/15.0
- Schools +4.3/10.0
- Livability +4.1/5.0
- DSCR +3.8/10.0
- 1% rule +3.6/10.0
- Rent growth +3.4/5.0
- Condition / age +2.5/5.0
- Appreciation +0.0/10.0
$569,500
🖨 Deal sheet 📄 Offer letter ✓ Due diligence
Multi-family units
County records classify this as Multi-Family (2-4 Unit). Listing-text estimate: 2 units. confirmed
Listing remarks MLS
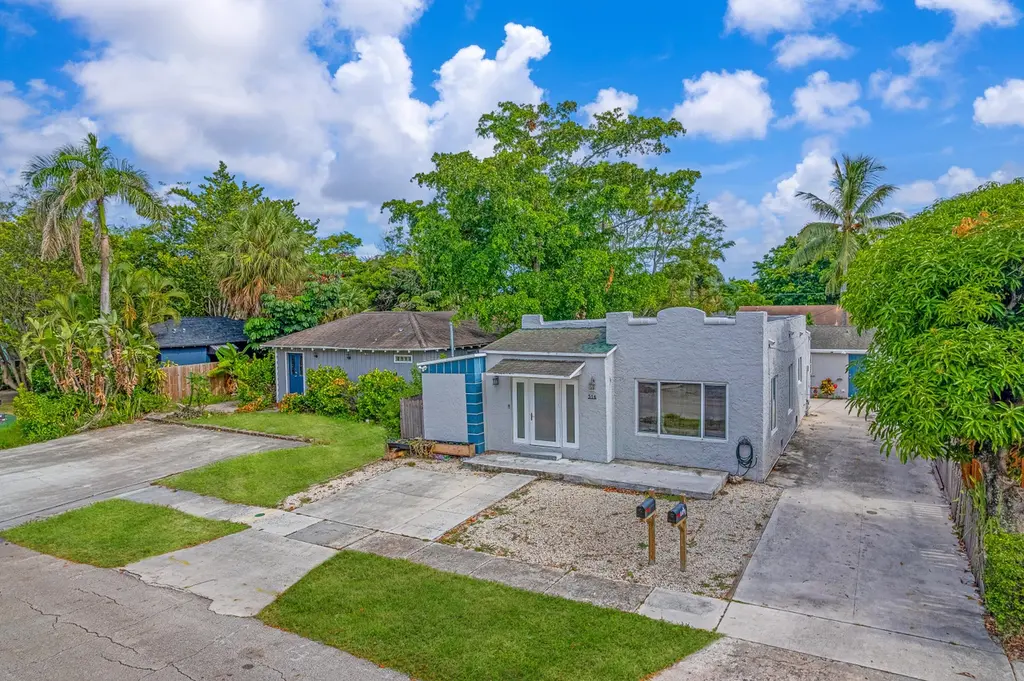
Amazing investment opportunity in Eastern West Palm Beach! Duplex with hurricane impact windows, updated owner's side and tenant in place for second unit. Owner's unit is 2 bed / 1 bath and is updated with engineered hardwood floors, fresh paint, white kitchen cabinetry and stainless appliances. Second unit is 2/1 with tile throughout. Live on one side and rent the other, or rent out both! Great location near US 1, close to I-95, Downtown West Palm, shopping and dining. Minutes to the beach!
Key facts
- Updated duplex
- Modern white kitchen
- Separate meters
Tags
Property features AI
Finance
- Other: Lot dimensions approximately 50 ft x 110 ft; Room on lot for a pool; Not waterfront
- Financial info: Two-unit property; Gross income: $54,360; Net operating income: $15,000; Tenants pay cable TV and electricity; Pets allowed with no restrictions
Exterior
- Utilities: Public water; Public sewer; Net meter electric service; Cable available; Electricity available; Sewer available; Water available; Two separate electric meters
- Home design: Duplex; Single-story; Resale property
- Construction: Stucco construction; Composition roof; Built as part of a 1,060 sq ft building area
- Exterior features: Open patio; Patio; Fenced yard; Shed(s)
Interior
- Flooring: Vinyl
- Heating & cooling: Central heating; Central air conditioning; Ceiling fans
- Interior features: Vinyl flooring; Blinds on windows
Neighborhood map
What this means for you Summary
Snapshot
- This is a 1×3bd/1ba + 1×2bd/1ba units multifamily listed at $570k.
Deal economics
- At list price, monthly cash flow is $-53 ($-635/yr) — negative. Per door: $-26/mo.
- To cash-flow at today's rent, offer at most $560k (1.6% below list).
- To meet the 1% rule (rent ≥ 1% of price), the offer needs to be $487k (14.4% below list).
- Recommended offer: $487k (14.4% below list) — sets the bar for 1% rule.
- Cap rate 6.2% vs local median 3.8% in West Palm Beach — top-decile yield for the area; either an underpriced asset or a hidden risk that comps aren't pricing in. Stress-test before assuming the spread holds.
Location & tenants
- Location reads 82/100 on livability (#75 in FL, #1,255 nationally) — a professional / high-income tenant draw. Strengths: commute A+, housing A+, health & safety A+; Watch: employment C-, crime F.
- Palm Beach (suburban): math 46% / reading 53% proficiency, ranked #34 of 73 in FL (top 47%) — families likely to look elsewhere, expect single-tenant / working-renter base with shorter leases.
- Zoned schools: South Olive Elementary School (math 64% / reading 65%, grade B, #525 of 2,144 statewide, top 26%, 485 students, 55% FRL); Forest Hill Community High School (math 20% / reading 41%, grade F, #434 of 667 statewide, top 66%, 2,407 students, 66% FRL).
- Market conditions: Rents rising (+3.4%/yr); 212 active listings in the ZIP; 6 comparable units currently listed for rent nearby; rentals leasing fast (median 8d on market — plan ~1-2 weeks tenant-placement turnaround); solid renter incomes; 3,974 units permitted in Palm Beach County in 2024 (1,012 in 5+ unit buildings).
- At $4,874/mo this rent would consume 67% of the median local household income ($87k/yr) (locally 1055% of renters already pay >50% of income on rent) — very limited rent-growth headroom before tenants either downsize or default.
Forward outlook
- Local home prices are declining (-3.0%/yr); year-one equity from $4k of loan paydown is wiped out by about $17k of value loss. Plan a longer hold.
- Palm Beach County population projected at +30% by 2050 — long-run rental-demand tailwind backs the buy-and-hold thesis.
Negotiation context
- It's been on market 19 days — a 2% lower offer ($561k) is reasonable based on typical stale-listing flexibility.
- 13 sale attempts since 23y ago with the ask held roughly flat each time — persistent listings suggest the price (not the market) is what's stuck; bring a comps-based counter.
- Current owner paid $349k; list at $570k implies a 63% gain — meaningful room to come down on a strong offer.
Risks & watch-outs
- Watch-outs: built in 1926 — expect roof / HVAC / electrical / plumbing capex.
- Climate carrying-cost: severe wind risk, 99% chance of damaging wind over 30y; extreme-heat days projected 7→25/yr by 2055 (HVAC capex compounding) — expect insurance premiums to compound above CPI over the hold.
Questions for the listing agent
- What do current leases actually rent for vs. the listed asking? Can we see a recent rent roll and the last 12 months of T-12 income?
- Can we see the unit-by-unit rent roll, current vacancy, and any below-market leases? What's the average tenancy length?
- What capital expenditures (roof, boiler, parking lot, exteriors) have been made in the last 5 years, and what's planned in the next 2?
- Built in 1926 — when were the roof, HVAC, electrical panel, plumbing, and water heater last replaced?
- Is there a deadline driving the sale (1031 exchange, divorce, estate, relocation)? That informs how much negotiation room exists.
- Crime grade is F in this area — have there been break-ins, vandalism, or insurance claims at this property in the last 3 years? What carrier currently insures it and at what premium?
- The area grade is low — what's the realistic commute time and amenity access for the typical tenant pool here? Any planned neighborhood developments (good or bad) we should know about?
- What's the average days-on-market for RENTAL listings here right now (not sales)? A rising rental-DOM trend means longer vacancies and softer asking-rent achievability than the comps imply.
- What's the recent tenant-quality profile in this submarket — average credit score on applications, eviction rate, late-payment / NSF rate, and stable-employment percentage? A property-management company in the area should have these aggregated.
- How much new apartment / multifamily construction is in the pipeline within 1–3 miles? Heavy new supply (>2% of stock underway) typically softens rents 12–24 months out; light construction supports rent growth.
Investment metrics
- 1% rule
- 0.86% ✗
- Cap rate
- 6.18%
- Cash-on-cash
- -0.40%
- DSCR
- 0.98
- GRM
- 9.7
CMA / ARV
No comps found within radius.
Projected returns pro-forma
-3.0% appreciation · 3.44% rent growth · sell at horizon
- IRR
- -16.5%
- Equity multiple
- 0.41×
- Total profit
- $-93,431
- Equity at exit
- $84,914
- IRR
- -7.4%
- Equity multiple
- 0.52×
- Total profit
- $-76,504
- Equity at exit
- $49,240
Cash invested: $159,460 (down + closing). Projections, not guarantees.
Landlord ↔ Tenant lean methodology
- Overall (STATE)
- 87 Strongly Landlord-Friendly
- State Florida
- 87 Strongly Landlord-Friendly · R+3
- County
- — inherits STATE
- City
- — inherits STATE
ZIP-level market 33405
- Rents YoY
- 3.4%
- Active inventory
- 212
- Price-to-rent
- 18.1×
Monthly cashflow live
- Estimated rent
- $4,874 medium interval (Pro) →
- Mortgage (P&I)
- −$2,987
- Tax from tax record
- −$680 /mo · $8,154/yr
- Insurance
- −$237
- HOA
- −$0
- Vacancy / Maint / Mgmt
- −$1,024
- Net cashflow
- $-53
Break-even live
2-unit breakdown (identical units grouped — click to expand)
| Units | Beds | Baths | Est. rent |
|---|---|---|---|
| 1× unit | 3 | 1 | $2,623 |
| 1× unit | 2 | 1 | $2,251 |
| Total (2 units) | $4,874 | ||
UW: 25.0% down · 7.5% · 30yr · 1.5% tax · 5.0% vac · 8.0% maint · 8.0% mgmt
Financing live
Cash to close
- Down payment
- $142,375
- Closing costs
- $17,085
- Reserves months
- —
- Total cash needed
- —
Loan-product check · same deal, 3 products live
Conventional
25% down · 7.5% · 30yr
- Down + closing
- —
- Monthly P&I
- —
- Monthly cashflow
- —
- DSCR
- —
- Eligible?
- —
Personal DTI + credit; lowest rate.
DSCR
20% down · 8.5% · 30yr
- Down + closing
- —
- Monthly P&I
- —
- Monthly cashflow
- —
- DSCR
- —
- Eligible?
- —
No personal income docs; deal must DSCR.
Hard money
10% down · 12.0% · 12mo
- Down + closing
- —
- Monthly P&I
- —
- Monthly cashflow
- —
- DSCR
- —
- Eligible?
- —
Short-term bridge; refi at stabilization.
Rent comps 6 comps
| Address | Beds | Baths | Sqft | Rent | $/sqft | DOM | Units | Dist |
|---|---|---|---|---|---|---|---|---|
| 802 Lytle St West Palm Beach, FL | 2.0 | 2.0 | 832 | $4,000 | $4.81 | 3d | 1 | 0.34mi |
| 727 Bunker Rd West Palm Beach, FL | 3.0 | 1.0 | 875 | $3,200 | $3.66 | 21d | 1 | 0.46mi |
| 733 Green St West Palm Beach, FL | 2.0 | 1.0 | 1116 | $3,400 | $3.05 | 3d | 1 | 0.71mi |
| 218 Seville Rd West Palm Beach, FL | 2.0 | 1.0 | 1036 | $3,250 | $3.14 | 8d | 1 | 0.84mi |
| 2006 Park St Lake Worth, FL | 2.0 | 1.0 | 800 | $2,195 | $2.74 | 24d | 1 | 1.36mi |
| 1755 Forest Hill Blvd Lake Clarke Shores, FL | 1.0 | 1.0 | 662 | $1,595 | $2.41 | 8d | 1 | 1.45mi |
Listing history 46 events
-
2026-06-04days on market $569,500 Active 19 DOM
-
2026-06-03days on market $569,500 Active 18 DOM
-
2026-06-02days on market $569,500 Active 17 DOM
-
2026-06-01days on market $569,500 Active 16 DOM
-
2026-05-31days on market $569,500 Active 15 DOM
-
2026-05-16$569,500 Active
-
2026-03-07price $569,500
-
2026-02-23status Active
-
2026-02-22historical Active Under Contract
-
2026-02-22historical
-
2025-09-26status Active
-
2025-09-25historical Active Under Contract
-
2025-08-10$579,500 Active
-
2024-12-10historical $2,100
-
2024-09-24$2,100
-
2024-05-16historical $2,200
-
2024-05-09$2,200
-
2021-05-28soldstatus $349,000
-
2021-05-12soldstatus $349,000 Closed 496-char remark
Show marketing remark (496 chars)
Amazing investment opportunity in Eastern West Palm Beach! Duplex with hurricane impact windows, updated owner's side and tenant in place for second unit. Owner's unit is 2 bed / 1 bath and is updated with engineered hardwood floors, fresh paint, white kitchen cabinetry and stainless appliances. Second unit is 2/1 with tile throughout. Live on one side and rent the other, or rent out both! Great location near US 1, close to I-95, Downtown West Palm, shopping and dining. Minutes to the beach!
-
2021-04-13status Pending 496-char remark
Show marketing remark (496 chars)
Amazing investment opportunity in Eastern West Palm Beach! Duplex with hurricane impact windows, updated owner's side and tenant in place for second unit. Owner's unit is 2 bed / 1 bath and is updated with engineered hardwood floors, fresh paint, white kitchen cabinetry and stainless appliances. Second unit is 2/1 with tile throughout. Live on one side and rent the other, or rent out both! Great location near US 1, close to I-95, Downtown West Palm, shopping and dining. Minutes to the beach!
-
2021-04-07$349,000 Active 496-char remark
Show marketing remark (496 chars)
Amazing investment opportunity in Eastern West Palm Beach! Duplex with hurricane impact windows, updated owner's side and tenant in place for second unit. Owner's unit is 2 bed / 1 bath and is updated with engineered hardwood floors, fresh paint, white kitchen cabinetry and stainless appliances. Second unit is 2/1 with tile throughout. Live on one side and rent the other, or rent out both! Great location near US 1, close to I-95, Downtown West Palm, shopping and dining. Minutes to the beach!
-
2019-05-30soldstatus $275,000
-
2019-03-25historical
-
2019-02-11price $274,500
-
2019-01-03price $299,000
-
2018-11-19$319,000 Active
-
2014-02-26soldstatus $155,000
-
2014-02-14historical
-
2014-02-14soldstatus $155,000 Closed
-
2014-02-14status Pending
-
2014-02-11historical Contingent
-
2014-01-27status Pending
-
2013-11-26$179,000 Active
-
2012-06-30soldstatus $57,000
-
2012-06-22historical
-
2012-02-18$69,900
-
2010-01-14historical
-
2009-04-13$89,900
-
2009-03-02historical
-
2007-08-20$165,000
-
2004-01-15soldstatus $155,000
-
2003-12-04soldstatus $155,000
-
2003-11-19historical
-
2003-07-21$165,000
-
1998-10-08soldstatus $77,000
-
1995-03-17soldstatus $55,000
ⓘ Source: listings_history table (triggers on properties + properties_extension) + one-shot
backfill from property_details.listing_events for pre-trigger history.
Tax reassessment forecast FL · Resets to sale price
- Current annual tax
- $8,154 · $680/mo
- Projected year-2 tax
- $8,154 · $680/mo
- Expected delta
- $0/yr ($0/mo · 0.0%)
ⓘ Screening estimate from a state-policy table — verify with the county assessor before closing.
Climate risk First Street
- Flood 4/10 Moderate FEMA zone X (unshaded) · 22% chance over 30 yrs
- Wildfire 1/10 Low
- Heat 10/10 Extreme 7 d/yr ≥105°F today · 25 d/yr by 30 yrs out
- Wind 10/10 Extreme 99% chance of damaging wind over 30 yrs
- Air quality 2/10 Low 1 unhealthy d/yr today · 1 by 30 yrs out
Nearby sold comps map
Loading sold comps map…
Walkable amenities ~0.75 mi
Loading nearby amenities…
Taxation est. · year 1
- Rental income
- $58,488
- − Mortgage interest
- −$31,901
- − Property taxes
- −$8,154
- − Insurance
- −$2,848
- − Repairs & maintenance
- −$4,679
- − Management
- −$4,679
- − Depreciation
- −$16,567
- Taxable loss
- −$10,340
- Est. tax savings @ 24.0%
- +$2,482
- After-tax cash flow
- $1,847/yr
For passive investors: Depreciation is non-cash, so a rental often shows a tax loss while cash-flowing — sheltering income. Rental losses are passive: they offset passive income freely, and up to $25,000/yr can offset ordinary (W-2) income if you actively participate and your MAGI is under $100k (phasing out to $0 by $150k); unused losses carry forward. On sale, claimed depreciation is recaptured at up to 25%, and gains may owe capital-gains tax (a 1031 exchange can defer both). Figures are a year-1 estimate at your 24.0% rate — not tax advice; consult a CPA.
Schools (NCES district)
- District
- Palm Beach
- NCES district ID
- 1201500
- Math proficiency
- 46% ▼ -16.00%
- Reading proficiency
- 53% ▼ -4.00%
- Median HH income
- $53,943
- Composite
- 42.72/100
- National rank
- #3160
- State rank
- #34 of 73 in FL
Livability — West Palm Beach
- Score
- 82/100
- State rank
- #75
- US rank
- #1255
Category grades
Schools grade is shown separately in the Schools card above.
Census & demographics
- Census place
- West Palm Beach, FL
- County
- Palm Beach County · 1,438,312 people
- City population
- 222,012
- Metro
- Miami-Fort Lauderdale-Pompano Beach, FL
- Population (ZIP)
- 19,780
- Household income
- $87,341
- Rent vs Own
- Severe rent burden
- 1055.0
Population outlook (Palm Beach County) Hauer SSP2
- Today (2025)
- 1,637,487 people
- By 2030
- 1,743,255 · +6.5%
- By 2040
- 1,948,712 · +19.0%
- By 2050
- 2,132,979 · +30.3%
- By 2075
- 2,530,027 · +54.5%
- By 2100
- 2,706,979 · +65.3%
Race, ethnicity, and origin ACS 2023
- Neighborhood character
- Majority Hispanic (51%)
- Race & ethnicity
- Hispanic / Latino 51% White 44% Two or more races 24% Black 3% Asian 1%
- Hispanic origin (detail)
- Mexican 7% Puerto Rican 5% Cuban 17% Dominican 2%
- Common ancestry
- Scotch-Irish 2% Slovak 2% Romanian 2%
- Foreign-born
- 37% · Canada, Guatemala, Jamaica
- Languages at home
- 50% English-only · Spanish 44% Other Indo-European 2% French/Haitian/Cajun 1%
Political lean MEDSL · Palm Beach
- 2024 margin
- Toss-up / Even · D 50.0% · R 49.2%
- 2008→2024 swing
- -22.1pp toward R · 2008: 22.9pp · 2024: 0.8pp
- All cycles
- 2024: D+0.8 2020: D+12.8 2016: D+15.3 2012: D+17.0 2008: D+22.9
Not yet ingested
- Civics
- —
Market trends
- HPI YoY
- ▼ -662.68%
- Current HPI
- 509.781
- Rent YoY
- ▲ 3.44%
- Metro
- Miami-Fort Lauderdale-Pompano Beach, FL
- State GDP YoY
- ▲ 3.28%
- F500 in state
- 36
Industry mix (Fortune 500 HQ in FL)
| Industry | F500 HQs | Revenue |
|---|---|---|
| Industrial Technology | 2 | $29B |
|
||
| Insurance | 2 | $17B |
|
||
| Retail | 1 | $60B |
|
||
| Technology Distribution | 1 | $58B |
|
||
| Homebuilding | 1 | $35B |
|
||
| Technology Manufacturing | 1 | $35B |
|
||
Price history
+935.5% since first listed41 events — show timeline
- 2026-05-16 Listed $569,500 Beaches MLS
- 2026-03-07 Price Changed $569,500 Beaches MLS
- 2026-02-23 Relisted — Beaches MLS
- 2026-02-22 Contingent — Beaches MLS
- 2026-02-22 Listing Removed — Beaches MLS
- 2025-09-26 Relisted — Beaches MLS
- 2025-09-25 Contingent — Beaches MLS
- 2025-08-10 Listed $579,500 Beaches MLS
- 2024-12-10 Rental Removed $2,100 GFLMLS
- 2024-09-24 Listed for Rent $2,100 GFLMLS
- 2024-05-16 Rental Removed $2,200 GFLMLS
- 2024-05-09 Listed for Rent $2,200 GFLMLS
- 2021-05-28 Sold (Public Records) $349,000 Public Records
- 2021-05-12 Sold (MLS) $349,000 Beaches MLS
- 2021-04-13 Pending — Beaches MLS
- 2021-04-07 Listed $349,000 Beaches MLS
- 2019-05-30 Sold (Public Records) $275,000 Public Records
- 2019-03-25 Listing Removed — Beaches MLS
- 2019-02-11 Price Changed $274,500 Beaches MLS
- 2019-01-03 Price Changed $299,000 Beaches MLS
- 2018-11-19 Listed $319,000 Beaches MLS
- 2014-02-26 Sold (Public Records) $155,000 Public Records
- 2014-02-14 Listing Removed — Beaches MLS
- 2014-02-14 Sold (MLS) $155,000 Beaches MLS
- 2014-02-14 Pending — Beaches MLS
- 2014-02-11 Contingent — Beaches MLS
- 2014-01-27 Pending — Beaches MLS
- 2013-11-26 Listed $179,000 Beaches MLS
- 2012-06-30 Sold (MLS) $57,000 Beaches MLS
- 2012-06-22 Listing Removed — Beaches MLS
- 2012-02-18 Listed $69,900 Beaches MLS
- 2010-01-14 Listing Removed — Beaches MLS
- 2009-04-13 Listed $89,900 Beaches MLS
- 2009-03-02 Listing Removed — Beaches MLS
- 2007-08-20 Listed $165,000 Beaches MLS
- 2004-01-15 Sold (Public Records) $155,000 Public Records
- 2003-12-04 Sold (MLS) $155,000 Beaches MLS
- 2003-11-19 Listing Removed — Beaches MLS
- 2003-07-21 Listed $165,000 Beaches MLS
- 1998-10-08 Sold (Public Records) $77,000 Public Records
- 1995-03-17 Sold (Public Records) $55,000 Public Records
Property tax history
+8.3%/yrLatest (2025): $8,154 · +5.2% YoY. Source: county tax records.
Cash-flow waterfall
monthlySold comps — $/sqft
last 12 mo · ≤1 miLoading sold comps…