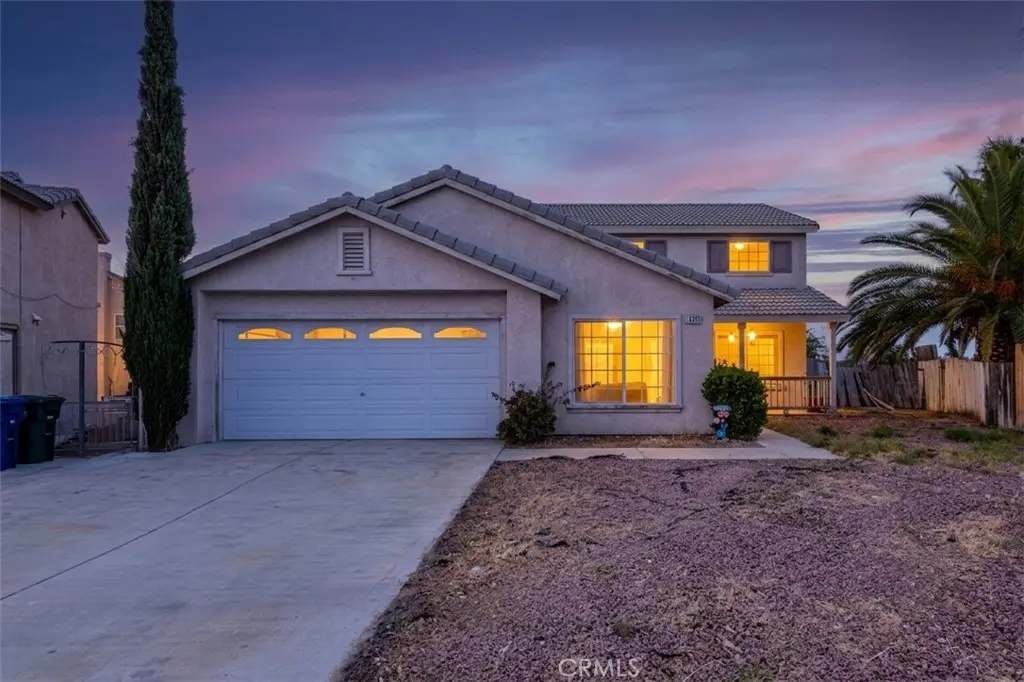
14591 Monterey · Adelanto, CA
Flood risk 1/10 · Minimal
- FEMA flood zone
- D
- Chance of flooding over 30 yrs
- 0.0%
- Est. flood insurance / yr
- $544 – $1,084
Fire risk 5/10 · Moderate
- Est. fire insurance / yr
- $659 – $1,223
Heat risk 7/10 · Major
- Hot days now (above 97°F)
- 2 days/yr
- Hot days in 30 yrs
- 7 days/yr
Wind risk 1/10 · Minimal
- Chance of severe wind over 30 yrs
- —
Air-quality risk 8/10 · Major
- Unhealthy air days now
- 18 days/yr
- Unhealthy air days in 30 yrs
- 23 days/yr
Risk factors via First Street. Map © Google.
Why this score? — see what drove the D+ grade
The composite is a weighted blend of 9 inputs, each scored 0–100. Each bar is that input's sub-score; the figure is the points it added to the 100-point composite (weight × sub-score).
- ARV discount +15.0/15.0
- Appreciation +10.0/10.0
- Cash flow +8.6/30.0
- Rent growth +3.7/5.0
- Condition / age +2.5/5.0
- DSCR +2.4/10.0
- Livability +2.4/5.0
- Schools +2.2/10.0
- 1% rule +1.9/10.0
$375,000
🖨 Deal sheet (PDF) 📄 Offer letter ✓ Due diligence
Listing remarks
This 4 bedroom 3 bath home on a cul de sac with a large lot can be made into your dream home. Upon entering the home you will find the living/dining room combo. You will also find the kitchen and family room, bedroom and bath. Upstairs 3 more bedrooms and two baths. Bring your paint and tools and make this your dream home.
Key facts
- 9,000 sq ft lot
- 2 garage spots
- Built 1996
Property features AI
Finance
- HOA & community: Sidewalks in the community
Exterior
- Parking: Attached garage; 2 garage spaces (2 total parking spaces)
- Utilities: Public sewer; District / public water
- Home design: House; Two-story; Entry on level 1
- Construction: No ADU; Year built source: Assessor
- Exterior features: Located on a cul-de-sac; No pool
Interior
- Kitchen: Kitchen (details not specified)
- Bedrooms: Main floor bedroom
- Flooring: Tile flooring; Carpet flooring
- Bathrooms: Three full bathrooms
- Heating & cooling: Central heating (furnace); Central cooling
- Interior features: Two levels; Ground-level entry; Main-floor bedroom; Main-level bathroom; Bonus room; Living room; Family room; Kitchen
- Laundry & utility: Interior laundry in a dedicated room
Neighborhood map
What this means for you Summary
Snapshot
- This is a 4-bed/3.0-bath single-family listed at $375k.
Deal economics
- At list price, monthly cash flow is $-323 ($-4k/yr) — negative.
- To cash-flow at today's rent, offer at most $318k (15.2% below list).
- To meet the 1% rule (rent ≥ 1% of price), the offer needs to be $258k (31.2% below list).
- Recommended offer: $258k (31.2% below list) — sets the bar for 1% rule.
- Cap rate 5.3% vs local median 4.2% in Adelanto — meaningfully above typical; check what's discounted (condition, days-on-market, listing class) to confirm the premium yield is real.
Location & tenants
- Location reads 47/100 on livability (#1,250 in CA) — a working-class tenant base; expect higher turnover. Strengths: housing A+; Watch: crime D, amenities F, commute F.
- Victor Valley Union High (urban): math 25% / reading 25% proficiency, ranked #407 of 517 in CA (top 79%) — low school quality limits family demand, transient renter base, plan for 1-2y turnover; 72% free/reduced lunch — lower-income household profile, screen leases tightly.
- Zoned schools: Gus Franklin Jr. (math 24% / reading 24%, grade F, #973 of 1,571 statewide, top 73%, 549 students, 63% FRL); Mesa Linda Middle (775 students, 77% FRL); Adelanto High (2,223 students, 71% FRL) — zoned schools at 70% FRL track the district average.
- Market conditions: Rents rising fast (+4.7%/yr); 631 active listings in the ZIP; 9 comparable units currently listed for rent nearby; rentals at typical pace (median 17d on market — plan ~3-4 weeks tenant-placement turnaround); 5,458 units permitted in San Bernardino County in 2024 (1,500 in 5+ unit buildings).
- At $2,579/mo this rent would consume 45% of the median local household income ($69k/yr) (locally 1345% of renters already pay >50% of income on rent) — very limited rent-growth headroom before tenants either downsize or default.
Forward outlook
- In year one you build about $40k of equity ($3k loan paydown + $38k appreciation (10.0% local appreciation)).
- San Bernardino County population projected at +15% by 2050 — modest demand growth; plan on rents tracking national, not racing it.
- By year 2, paydown + projected appreciation supports a ~$64k cash-out refi (75% LTV) — recoverable capital for the next deal without selling this one.
Negotiation context
- Only 9 days on market — expect competitive offers; lowballing is unlikely to land.
- Current owner paid $86k; list at $375k implies a 334% gain — meaningful room to come down on a strong offer.
Risks & watch-outs
- Climate carrying-cost: moderate wildfire risk; extreme-heat days projected 2→7/yr by 2055 (HVAC capex compounding) — expect insurance premiums to compound above CPI over the hold.
Questions for the listing agent
- What do current leases actually rent for vs. the listed asking? Can we see a recent rent roll and the last 12 months of T-12 income?
- Is there a deadline driving the sale (1031 exchange, divorce, estate, relocation)? That informs how much negotiation room exists.
- Schools are F-rated, which usually means shorter tenancies and higher turnover. Who's the typical renter profile here, and what's been the actual vacancy rate?
- Crime grade is D in this area — have there been break-ins, vandalism, or insurance claims at this property in the last 3 years? What carrier currently insures it and at what premium?
- The area grade is low — what's the realistic commute time and amenity access for the typical tenant pool here? Any planned neighborhood developments (good or bad) we should know about?
- What's the average days-on-market for RENTAL listings here right now (not sales)? A rising rental-DOM trend means longer vacancies and softer asking-rent achievability than the comps imply.
- What's the recent tenant-quality profile in this submarket — average credit score on applications, eviction rate, late-payment / NSF rate, and stable-employment percentage? A property-management company in the area should have these aggregated.
- How much new for-sale + rental construction is in the pipeline within 1–3 miles? Heavy new supply typically softens prices + rents 12–24 months out; constrained supply supports both.
Investment metrics
- 1% rule
- 0.69% ✗
- Cap rate
- 5.26%
- Cash-on-cash
- -3.69%
- DSCR
- 0.84
- GRM
- 12.1
CMA / ARV
- ARV (on-the-fly)
- $509,016
- Comps found
- 12
Show comp detail 12 sales within ~0.75 mi
| Address | Dist | Beds/Ba | Sqft | Sold | Price | $/sf | Match |
|---|---|---|---|---|---|---|---|
| 11566 Azalia Dr | 0.20mi | 4/3.0 | 2,227 (+11%) | 1mo | $441,450 | $198 | 71 |
| 14803 Bo Ct | 0.42mi | 5/3.0 (+1) | 1,947 (-3%) | 2mo | $430,000 | $221 | 69 |
| 11075 Paso Blanco | 0.70mi | 4/3.0 | 1,981 (-1%) | 1mo | $445,000 | $225 | 64 |
| 14245 Purple Cyn | 0.56mi | 3/2.5 (-1) | 1,947 (-3%) | 3mo | $415,000 | $213 | 59 |
| 11483 Russet | 0.41mi | 4/2.5 | 1,815 (-9%) | 5mo | $460,000 | $253 | 59 |
| 11542 Villa St | 0.21mi | 5/3.0 (+1) | 1,713 (-14%) | 6mo | $460,000 | $269 | 56 |
| 11409 Bellevue | 0.51mi | 4/2.0 | 1,790 (-11%) | 4mo | $475,000 | $265 | 51 |
| 14961 Decarlo Dr | 0.71mi | 4/3.0 | 1,874 (-6%) | 7mo | $503,415 | $269 | 50 |
| 14966 Decarlo Dr | 0.75mi | 4/3.0 | 1,874 (-6%) | 6mo | $502,260 | $268 | 49 |
| 15158 Biltmore St | 0.74mi | 4/2.5 | 2,196 (+10%) | 3mo | $425,000 | $194 | 45 |
| 14958 Decarlo Dr | 0.74mi | 4/2.5 | 1,775 (-11%) | 6mo | $512,129 | $289 | 40 |
| 14960 Coppola Dr | 0.74mi | 4/2.5 | 1,775 (-11%) | 8mo | $450,000 | $254 | 38 |
Match score weights: distance 35% · size 25% · config 20% · recency 20%. Top-matched comps best support the ARV.
Projected returns pro-forma
10.0% appreciation · 4.68% rent growth · sell at horizon
- IRR
- 22.1%
- Equity multiple
- 2.79×
- Total profit
- $188,012
- Equity at exit
- $337,830
- IRR
- 20.2%
- Equity multiple
- 6.52×
- Total profit
- $579,253
- Equity at exit
- $728,543
Cash invested: $105,000 (down + closing). Projections, not guarantees.
Landlord ↔ Tenant lean methodology
- Overall (STATE)
- 18 Strongly Tenant-Friendly
- State California
- 18 Strongly Tenant-Friendly · D+13
- County
- — inherits STATE
- City
- — inherits STATE
ZIP-level market 92301
- Home prices YoY
- 10.0%
- Rents YoY
- 4.7%
- Active inventory
- 631
- Price-to-rent
- 12.1×
Monthly cashflow live
- Estimated rent
- $2,579 high interval (Pro) →
- Mortgage (P&I)
- −$1,967
- Tax from tax record
- −$237 /mo · $2,850/yr
- Insurance
- −$156
- HOA
- −$0
- Vacancy / Maint / Mgmt
- −$542
- Net cashflow
- $-323
Break-even live
Sensitivity live
| Price | -10% $-110 | -5% $-217 | +0% $-323 | +5% $-429 | +10% $-535 |
|---|---|---|---|---|---|
| Rent | -10% $-526 | -5% $-425 | +0% $-323 | +5% $-221 | +10% $-119 |
| Rate | -1.0pp $-134 | -0.5pp $-227 | base $-323 | +0.5pp $-420 | +1.0pp $-519 |
UW: 25.0% down · 7.5% · 30yr · 1.5% tax · 5.0% vac · 8.0% maint · 8.0% mgmt
Financing live
Cash to close
- Down payment
- $93,750
- Closing costs
- $11,250
- Reserves months
- —
- Total cash needed
- —
Loan-product check · same deal, 3 products live
Conventional
25% down · 7.5% · 30yr
- Down + closing
- —
- Monthly P&I
- —
- Monthly cashflow
- —
- DSCR
- —
- Eligible?
- —
Personal DTI + credit; lowest rate.
DSCR
20% down · 8.5% · 30yr
- Down + closing
- —
- Monthly P&I
- —
- Monthly cashflow
- —
- DSCR
- —
- Eligible?
- —
No personal income docs; deal must DSCR.
Hard money
10% down · 12.0% · 12mo
- Down + closing
- —
- Monthly P&I
- —
- Monthly cashflow
- —
- DSCR
- —
- Eligible?
- —
Short-term bridge; refi at stabilization.
Rent comps 9 comps
| Address | Beds | Baths | Sqft | Rent | $/sqft | DOM | Units | Dist |
|---|---|---|---|---|---|---|---|---|
| 14513 Palm St Adelanto, CA | 3.0 | 2.0 | 1500 | $2,300 | $1.53 | 0d | 1 | 0.14mi |
| 14245 Tierra del Sur St Adelanto, CA | 4.0 | 3.0 | 2100 | $3,200 | $1.52 | 0d | 1 | 0.62mi |
| 14312 Sierra Grande St Adelanto, CA | 3.0 | 2.0 | 1463 | $1,900 | $1.30 | 16d | 1 | 0.74mi |
| 13809 Brynwood St Victorville, CA | 3.0 | 2.0 | 1492 | $2,497 | $1.67 | 14d | 1 | 1.15mi |
| 13809 Brynwood St Victorville, CA | 3.0 | 2.0 | 1492 | $2,497 | $1.67 | 25d | 1 | 1.15mi |
| 14914 Binford Ave Adelanto, CA | 4.0 | 2.0 | 1468 | $2,400 | $1.63 | 12d | 1 | 1.23mi |
| 11860 Lupin Rd Adelanto, CA | 4.0 | 2.0 | 1902 | $2,350 | $1.24 | 22d | 1 | 1.25mi |
| 13574 Fern Pine St Victorville, CA | 5.0 | 3.0 | 2431 | $2,800 | $1.15 | 26d | 1 | 1.46mi |
| 10374 San Andreas St Adelanto, CA | 3.0 | 2.5 | 1583 | $2,350 | $1.48 | 45d | 1 | 1.48mi |
Listing history 7 events
-
2026-06-21days on market $375,000 Active 9 DOM
-
2026-06-18days on market $375,000 Active 6 DOM
-
2026-06-17days on market $375,000 Active 5 DOM
-
2026-06-16days on market $375,000 Active 4 DOM
-
2026-06-15days on market $375,000 Active 3 DOM
-
2026-06-13remarks 324-char remark
-
2026-06-13$375,000 Active 1 DOM
ⓘ Source: listings_history table (triggers on properties + properties_extension) + one-shot
backfill from property_details.listing_events for pre-trigger history.
Tax reassessment forecast CA · Resets to sale price
- Current annual tax
- $2,850 · $237/mo
- Projected year-2 tax
- $2,850 · $238/mo
- Expected delta
- $0/yr ($0/mo · 0.0%)
ⓘ Screening estimate from a state-policy table — verify with the county assessor before closing.
Climate risk First Street
- Flood 1/10 Low FEMA zone D · 0% chance over 30 yrs
- Wildfire 5/10 Major
- Heat 7/10 Severe 2 d/yr ≥97°F today · 7 d/yr by 30 yrs out
- Wind 1/10 Low
- Air quality 8/10 Severe 18 unhealthy d/yr today · 23 by 30 yrs out
Nearby sold comps map
Loading sold comps map…
Walkable amenities ~0.75 mi
Loading nearby amenities…
Taxation est. · year 1
- Rental income
- $30,951
- − Mortgage interest
- −$21,006
- − Property taxes
- −$2,850
- − Insurance
- −$1,875
- − Repairs & maintenance
- −$2,476
- − Management
- −$2,476
- − Depreciation
- −$10,909
- Taxable loss
- −$10,641
- Est. tax savings @ 24.0%
- +$2,554
- After-tax cash flow
- $-1,318/yr
For passive investors: Depreciation is non-cash, so a rental often shows a tax loss while cash-flowing — sheltering income. Rental losses are passive: they offset passive income freely, and up to $25,000/yr can offset ordinary (W-2) income if you actively participate and your MAGI is under $100k (phasing out to $0 by $150k); unused losses carry forward. On sale, claimed depreciation is recaptured at up to 25%, and gains may owe capital-gains tax (a 1031 exchange can defer both). Figures are a year-1 estimate at your 24.0% rate — not tax advice; consult a CPA.
Schools (NCES district)
- District
- Victor Valley Union High
- NCES district ID
- 0636972
- Math proficiency
- 25% ▲ 6.00%
- Reading proficiency
- 25% ▼ -12.00%
- Median HH income
- $45,112
- Composite
- 21.6/100
- National rank
- #8296
- State rank
- #407 of 517 in CA
Livability — Adelanto
- Score
- 47/100
- State rank
- #1250
- US rank
- #26338
Category grades
Schools grade is shown separately in the Schools card above.
Census & demographics
- Census place
- Adelanto, CA
- County
- San Bernardino County · 2,030,291 people
- City population
- 38,577
- Metro
- Riverside-San Bernardino-Ontario, CA
- Population (ZIP)
- 38,577
- Household income
- $68,676
- Rent vs Own
- Severe rent burden
- 1345.0
Population outlook (San Bernardino County) Hauer SSP2
- Today (2025)
- 2,300,329 people
- By 2030
- 2,378,907 · +3.4%
- By 2040
- 2,523,137 · +9.7%
- By 2050
- 2,642,388 · +14.9%
- By 2075
- 2,880,769 · +25.2%
- By 2100
- 2,909,436 · +26.5%
Race, ethnicity, and origin ACS 2023
- Neighborhood character
- Predominantly Hispanic (69%)
- Race & ethnicity
- Hispanic / Latino 69% Two or more races 34% Black 15% White 9% Asian 2% Native American 1%
- Hispanic origin (detail)
- Mexican 58%
- Foreign-born
- 18% · Canada
- Languages at home
- 52% English-only · Spanish 46%
Political lean MEDSL · San Bernardino
- 2024 margin
- Toss-up / Even · D 47.5% · R 49.7% · Other 2.8%
- 2008→2024 swing
- -8.5pp toward R · 2008: 6.3pp · 2024: -2.1pp
- All cycles
- 2024: R+2.1 2020: D+10.7 2016: D+9.8 2012: D+5.4 2008: D+6.3
Not yet ingested
- Civics
- —
Market trends
- HPI YoY
- ▲ 41.09%
- Current HPI
- 453.6071
- Rent YoY
- ▲ 4.68%
- Metro
- Riverside-San Bernardino-Ontario, CA
- State GDP YoY
- ▲ 3.21%
- F500 in state
- 116
Industry mix (Fortune 500 HQ in CA)
| Industry | F500 HQs | Revenue |
|---|---|---|
| Technology | 27 | $1,492B |
|
||
| Financial Services | 3 | $174B |
|
||
| Retail | 3 | $44B |
|
||
| Insurance | 3 | $26B |
|
||
| Media / Entertainment | 2 | $115B |
|
||
| Pharmaceuticals / Biotech | 2 | $62B |
|
||
Price history
+217.8% since first listed4 events — show timeline
- 2026-06-12 Listed $375,000 CRMLS
- 1999-04-01 Sold (Public Records) $86,500 Public Records
- 1998-11-06 Sold (Public Records) $131,776 Public Records
- 1996-07-29 Sold (Public Records) $118,000 Public Records
Property tax history
+3.8%/yrLatest (2025): $2,850 · +8.1% YoY. Source: county tax records.
Cash-flow waterfall
monthlySold comps — $/sqft
last 12 mo · ≤1 miLoading sold comps…