1388 Sherman St · Geneva, OH
Flood risk 1/10 · Minimal
- FEMA flood zone
- X (unshaded)
- Chance of flooding over 30 yrs
- 0.0%
- Est. flood insurance / yr
- $473 – $860
Fire risk 1/10 · Minimal
- Est. fire insurance / yr
- $713 – $1,323
Heat risk 2/10 · Minimal
- Hot days now (above 94°F)
- 7 days/yr
- Hot days in 30 yrs
- 17 days/yr
Wind risk 1/10 · Minimal
- Chance of severe wind over 30 yrs
- —
Air-quality risk 3/10 · Minor
- Unhealthy air days now
- 2 days/yr
- Unhealthy air days in 30 yrs
- 5 days/yr
Risk factors via First Street. Map © Google.
Why this score? — see what drove the C- grade
The composite is a weighted blend of 9 inputs, each scored 0–100. Each bar is that input's sub-score; the figure is the points it added to the 100-point composite (weight × sub-score).
- Cash flow +19.3/30.0
- ARV discount +7.5/15.0
- DSCR +6.1/10.0
- 1% rule +4.9/10.0
- Schools +4.7/10.0
- Livability +3.7/5.0
- Rent growth +2.5/5.0
- Condition / age +2.5/5.0
- Appreciation +0.0/10.0
$134,900
🖨 Deal sheet 📄 Offer letter ✓ Due diligence
Listing remarks
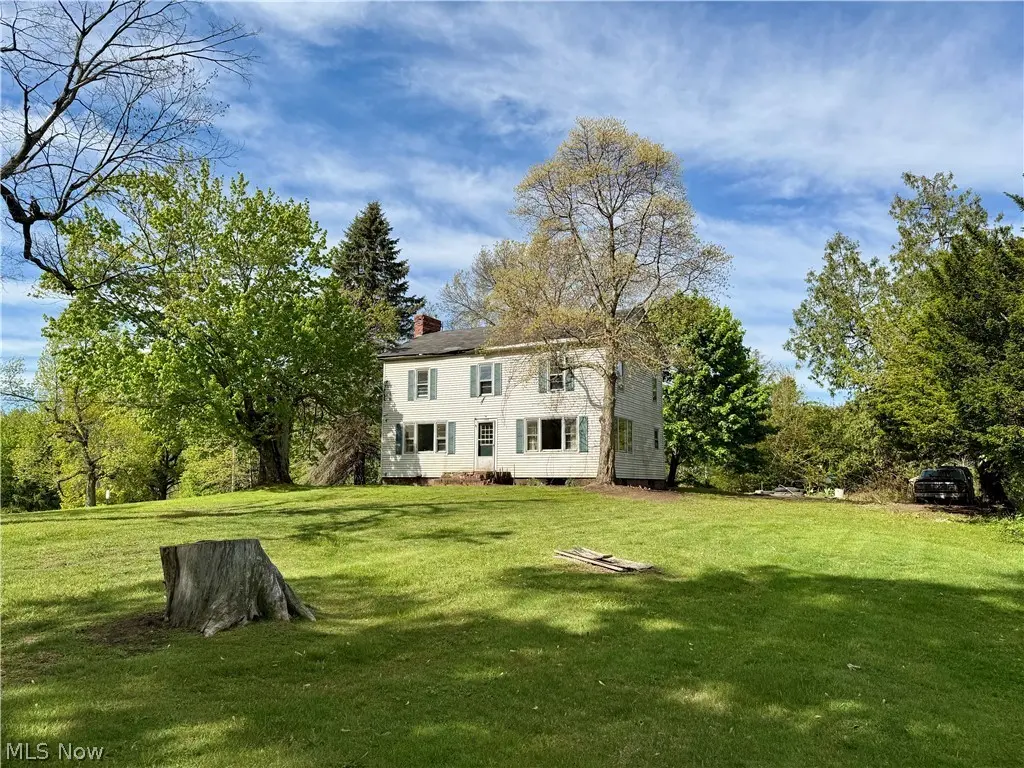
Exceptional opportunity to restore a historic home in one of Geneva’s most desirable neighborhoods. Built circa 1830 and set on a rare oversized lot, this 3 bedroom, 1 bath property offers over 2,000 square feet with character, scale, and restoration potential. The home requires significant renovation and is being sold as-is, but opportunities like this rarely become available in this neighborhood. Spacious yard with mature trees and plenty of room to reimagine the property while preserving its historic presence. Ideal for restoration minded buyers, investors, or anyone seeking a distinctive project in a highly sought after setting.
Key facts
- Spacious yard
- Oversized lot
- Historic home
Tags
Property features AI
Exterior
- Parking: Driveway with gravel surface; One-car garage
- Utilities: Public water; Public sewer
- Home design: Two-story single-family home; Stone foundation
- Construction: Vinyl siding; Asphalt/fiberglass roof; Built per public records (year built source: public records)
- Exterior features: Corner lot; Gentle sloping lot; Faces east; Property listed as fixer
Interior
- Kitchen: Appliances not specified
- Bedrooms: Total of 7 rooms (bedroom count not specified)
- Bathrooms: One full bathroom on the main level
- Heating & cooling: Forced-air gas heating
- Interior features: Unfinished basement with both interior and exterior entry; Two fireplaces
- Laundry & utility: Main-level laundry room
Neighborhood map
What this means for you Summary
Snapshot
- This is a 3-bed/1.0-bath single-family listed at $135k.
Deal economics
- At list price, monthly cash flow is $149 ($2k/yr) — positive.
- The deal already cash-flows at list — no discount required.
- To meet the 1% rule (rent ≥ 1% of price), the offer needs to be $133k (1.4% below list).
- Recommended offer: $133k (1.5% below list) — sets the bar for market timing.
- Cap rate 7.6% vs local median 4.6% in Geneva — top-decile yield for the area; either an underpriced asset or a hidden risk that comps aren't pricing in. Stress-test before assuming the spread holds.
Location & tenants
- Location reads 74/100 on livability (#291 in OH, #4,770 nationally) — a middle-class / working-renter tenant base. Strengths: cost of living A+, housing A+, health & safety A+; Watch: commute F, employment F.
- Geneva Area City (town): math 52% / reading 60% proficiency, ranked #362 of 656 in OH (top 55%) — acceptable for families but not a draw, mixed tenant base, ~2y average lease.
- Market conditions: 86 active listings in the ZIP; 155 units permitted in Ashtabula County in 2024 (0 in 5+ unit buildings).
Forward outlook
- Local home prices are declining (-3.0%/yr); year-one equity from $933 of loan paydown is wiped out by about $4k of value loss. Plan a longer hold.
- Ashtabula County population projected at -22% by 2050 — secular population decline; favor cash flow + early exit over multi-decade hold.
Negotiation context
- It's been on market 21 days — a 2% lower offer ($133k) is reasonable based on typical stale-listing flexibility.
Risks & watch-outs
- Watch-outs: built in 1830 — expect roof / HVAC / electrical / plumbing capex.
Questions for the listing agent
- Built in 1830 — when were the roof, HVAC, electrical panel, plumbing, and water heater last replaced?
- Is there a deadline driving the sale (1031 exchange, divorce, estate, relocation)? That informs how much negotiation room exists.
- What's the average days-on-market for RENTAL listings here right now (not sales)? A rising rental-DOM trend means longer vacancies and softer asking-rent achievability than the comps imply.
- What's the recent tenant-quality profile in this submarket — average credit score on applications, eviction rate, late-payment / NSF rate, and stable-employment percentage? A property-management company in the area should have these aggregated.
- How much new for-sale + rental construction is in the pipeline within 1–3 miles? Heavy new supply typically softens prices + rents 12–24 months out; constrained supply supports both.
Investment metrics
- 1% rule
- 0.99% ✗
- Cap rate
- 7.62%
- Cash-on-cash
- 4.73%
- DSCR
- 1.21
- GRM
- 8.4
CMA / ARV
- ARV (on-the-fly)
- $331,216
- Comps found
- 4
Show comp detail 4 sales within ~0.75 mi
| Address | Dist | Beds/Ba | Sqft | Sold | Price | $/sf | Match |
|---|---|---|---|---|---|---|---|
| 1418 Sherman St | 0.04mi | 3/3.0 | 1,816 (-11%) | 23mo | $245,000 | $135 | 54 |
| 1964 Beringer Pl | 0.66mi | 4/2.5 (+1) | 2,118 (+4%) | 4mo | $344,900 | $163 | 48 |
| 1641 Sherman St | 0.27mi | 4/2.0 (+1) | 1,756 (-14%) | 15mo | $232,500 | $132 | 43 |
| 5230 Clay St | 0.43mi | 4/3.0 (+1) | 2,328 (+15%) | 4mo | $394,000 | $169 | 39 |
Match score weights: distance 35% · size 25% · config 20% · recency 20%. Top-matched comps best support the ARV.
Projected returns pro-forma
-3.0% appreciation · 3.0% rent growth · sell at horizon
- IRR
- -8.9%
- Equity multiple
- 0.67×
- Total profit
- $-12,378
- Equity at exit
- $20,114
- IRR
- 0.5%
- Equity multiple
- 1.04×
- Total profit
- $1,435
- Equity at exit
- $11,664
Cash invested: $37,772 (down + closing). Projections, not guarantees.
Landlord ↔ Tenant lean methodology
- Overall (STATE)
- 73 Landlord-Friendly
- State Ohio
- 73 Landlord-Friendly · R+6
- County
- — inherits STATE
- City
- — inherits STATE
ZIP-level market 44041
- Home prices YoY
- -31.3%
- Active inventory
- 86
- Price-to-rent
- 8.4×
Monthly cashflow live
- Estimated rent
- $1,330 medium interval (Pro) →
- Mortgage (P&I)
- −$707
- Tax from tax record
- −$139 /mo · $1,663/yr
- Insurance
- −$56
- HOA
- −$0
- Vacancy / Maint / Mgmt
- −$279
- Net cashflow
- $149
Break-even live
UW: 25.0% down · 7.5% · 30yr · 1.5% tax · 5.0% vac · 8.0% maint · 8.0% mgmt
Financing live
Cash to close
- Down payment
- $33,725
- Closing costs
- $4,047
- Reserves months
- —
- Total cash needed
- —
Loan-product check · same deal, 3 products live
Conventional
25% down · 7.5% · 30yr
- Down + closing
- —
- Monthly P&I
- —
- Monthly cashflow
- —
- DSCR
- —
- Eligible?
- —
Personal DTI + credit; lowest rate.
DSCR
20% down · 8.5% · 30yr
- Down + closing
- —
- Monthly P&I
- —
- Monthly cashflow
- —
- DSCR
- —
- Eligible?
- —
No personal income docs; deal must DSCR.
Hard money
10% down · 12.0% · 12mo
- Down + closing
- —
- Monthly P&I
- —
- Monthly cashflow
- —
- DSCR
- —
- Eligible?
- —
Short-term bridge; refi at stabilization.
Listing history 15 events
-
2026-06-18days on market $134,900 Active 21 DOM
-
2026-06-17days on market $134,900 Active 20 DOM
-
2026-06-16days on market $134,900 Active 19 DOM
-
2026-06-15days on market $134,900 Active 18 DOM
-
2026-06-13days on market $134,900 Active 16 DOM
-
2026-06-12days on market $134,900 Active 15 DOM
-
2026-06-09days on market $134,900 Active 12 DOM
-
2026-06-08days on market $134,900 Active 11 DOM
-
2026-06-08days on market $134,900 Active 10 DOM
-
2026-06-07days on market $134,900 Active 9 DOM
-
2026-06-04days on market $134,900 Active 6 DOM
-
2026-06-02days on market $134,900 Active 5 DOM
-
2026-06-01days on market $134,900 Active 4 DOM
-
2026-05-31days on market $134,900 Active 3 DOM
-
2026-05-27$134,900 Active
ⓘ Source: listings_history table (triggers on properties + properties_extension) + one-shot
backfill from property_details.listing_events for pre-trigger history.
Tax reassessment forecast OH · Partial reset (capped growth)
- Current annual tax
- $1,663 · $139/mo
- Projected year-2 tax
- $1,884 · $157/mo
- Expected delta
- +$221/yr (+$18/mo · 13.3%)
ⓘ Screening estimate from a state-policy table — verify with the county assessor before closing.
Climate risk First Street
- Flood 1/10 Low FEMA zone X (unshaded) · 0% chance over 30 yrs
- Wildfire 1/10 Low
- Heat 2/10 Low 7 d/yr ≥94°F today · 17 d/yr by 30 yrs out
- Wind 1/10 Low
- Air quality 3/10 Moderate 2 unhealthy d/yr today · 5 by 30 yrs out
Nearby sold comps map
Loading sold comps map…
Walkable amenities ~0.75 mi
Loading nearby amenities…
Taxation est. · year 1
- Rental income
- $15,966
- − Mortgage interest
- −$7,556
- − Property taxes
- −$1,663
- − Insurance
- −$674
- − Repairs & maintenance
- −$1,277
- − Management
- −$1,277
- − Depreciation
- −$3,924
- Taxable loss
- −$407
- Est. tax savings @ 24.0%
- +$98
- After-tax cash flow
- $1,884/yr
For passive investors: Depreciation is non-cash, so a rental often shows a tax loss while cash-flowing — sheltering income. Rental losses are passive: they offset passive income freely, and up to $25,000/yr can offset ordinary (W-2) income if you actively participate and your MAGI is under $100k (phasing out to $0 by $150k); unused losses carry forward. On sale, claimed depreciation is recaptured at up to 25%, and gains may owe capital-gains tax (a 1031 exchange can defer both). Figures are a year-1 estimate at your 24.0% rate — not tax advice; consult a CPA.
Schools (NCES district)
- District
- Geneva Area City
- NCES district ID
- 3904405
- Math proficiency
- 52% ▼ -16.00%
- Reading proficiency
- 60% ▼ -2.00%
- Median HH income
- $43,525
- Composite
- 47.12/100
- National rank
- #2328
- State rank
- #362 of 656 in OH
Livability — Geneva
- Score
- 74/100
- State rank
- #291
- US rank
- #4770
Category grades
Schools grade is shown separately in the Schools card above.
Census & demographics
- Census place
- Geneva, OH
- County
- Ashtabula · 97,617 people
- Metro
- Cleveland, OH
- Population (ZIP)
- 13,992
- Household income
- $58,438
- Rent vs Own
- Severe rent burden
- 12.5
Population outlook (Ashtabula County) Hauer SSP2
- Today (2025)
- 92,950 people
- By 2030
- 89,146 · -4.1%
- By 2040
- 80,715 · -13.2%
- By 2050
- 72,270 · -22.2%
- By 2075
- 55,780 · -40.0%
- By 2100
- 40,928 · -56.0%
Race, ethnicity, and origin ACS 2023
- Neighborhood character
- Predominantly White (85%)
- Race & ethnicity
- White 85% Hispanic / Latino 7% Two or more races 6% Black 4%
- Hispanic origin (detail)
- Mexican 1% Puerto Rican 4%
- Common ancestry
- Romanian 3% Slovak 2% Lithuanian 2%
- Foreign-born
- 1% · Canada
- Languages at home
- 96% English-only · Spanish 4%
Political lean MEDSL · Ashtabula
- 2024 margin
- Strong R (+28.4) · D 35.4% · R 63.8%
- 2008→2024 swing
- -41.9pp toward R · 2008: 13.5pp · 2024: -28.4pp
- All cycles
- 2024: R+28.4 2020: R+23.5 2016: R+19.0 2012: D+12.1 2008: D+13.5
Not yet ingested
- Civics
- —
Market trends
- HPI YoY
- ▼ -105.04%
- Current HPI
- 230.8747
- Rent YoY
- —
- Metro
- —
- State GDP YoY
- ▲ 1.98%
- F500 in state
- 48
Industry mix (Fortune 500 HQ in OH)
| Industry | F500 HQs | Revenue |
|---|---|---|
| Insurance | 3 | $145B |
|
||
| Industrial Machinery | 3 | $49B |
|
||
| Financial Services | 3 | $24B |
|
||
| Consumer Goods | 2 | $93B |
|
||
| Aerospace / Defense | 2 | $47B |
|
||
| Utilities | 2 | $33B |
|
||
Price history
1 event — show timeline
- 2026-05-27 Listed $134,900 MLSNOW
Property tax history
+3.1%/yrLatest (2025): $1,663 · -3.0% YoY. Source: county tax records.
Cash-flow waterfall
monthlySold comps — $/sqft
last 12 mo · ≤1 miLoading sold comps…