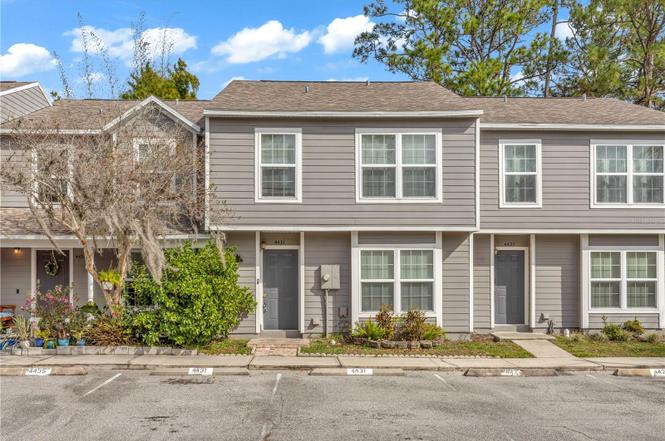
4431 Brook Hollow Cir · Winter Springs, FL
Flood risk 1/10 · Minimal
- FEMA flood zone
- X (unshaded)
- Chance of flooding over 30 yrs
- 0.0%
- Est. flood insurance / yr
- $507 – $1,088
Fire risk 2/10 · Minimal
- Est. fire insurance / yr
- $947 – $1,759
Heat risk 8/10 · Major
- Hot days now (above 108°F)
- 7 days/yr
- Hot days in 30 yrs
- 22 days/yr
Wind risk 9/10 · Severe
- Chance of severe wind over 30 yrs
- 99.0%
Air-quality risk 2/10 · Minimal
- Unhealthy air days now
- 1 days/yr
- Unhealthy air days in 30 yrs
- 2 days/yr
Risk factors via First Street. Map © Google.
Why this score? — see what drove the D+ grade
The composite is a weighted blend of 9 inputs, each scored 0–100. Each bar is that input's sub-score; the figure is the points it added to the 100-point composite (weight × sub-score).
- ARV discount +15.0/15.0
- Cash flow +9.1/30.0
- 1% rule +5.6/10.0
- Schools +5.1/10.0
- Livability +3.8/5.0
- Rent growth +3.4/5.0
- DSCR +2.5/10.0
- Condition / age +2.5/5.0
- Appreciation +0.0/10.0
$220,000
🖨 Deal sheet (PDF) 📄 Offer letter ✓ Due diligence
Listing remarks
Welcome home to 4431 Brook Hollow Circle, where clean design meets comfortable living. This light-filled residence offers an open, airy layout that feels both spacious and welcoming, with neutral finishes that create a fresh, move-in-ready atmosphere. The living and dining areas flow seamlessly, making everyday living and entertaining effortless. One of the home’s standout features is the enclosed back porch, providing a versatile extension of the living space—perfect for morning coffee and relaxing evenings. The porch overlooks a peaceful outdoor area, offering privacy and a sense of calm rarely found. is ideal for those seeking a clean, uncluttered space that feels comfort
Key facts
- Enclosed back porch
- Scenic lake views
- $512 HOA
Tags
Property features AI
Finance
- Other: Total acreage: 0 to less than 1/4 acre; Lot surface: Asphalt road; Lot size approximately 0.05 acres
- Financial info: No lease restrictions indicated
- HOA & community: HOA: Deer Run HOA; Monthly HOA fee $275 (plus additional monthly maintenance $237); Community pool; Pets allowed
Exterior
- Parking: Parking information not specified
- Utilities: Public water; Public sewer; Electricity connected
- Home design: Residential townhouse; Two stories; Faces east; Entry level information not specified
- Construction: Vinyl siding; Shingle roof; Foundation: Other; Built area: 1,367 square feet
- Exterior features: Rear screened porch
Interior
- Kitchen: Dishwasher; Range; Microwave; Refrigerator
- Bedrooms: 3 bedrooms
- Flooring: Tile; Wood
- Bathrooms: 2 full bathrooms
- Heating & cooling: Central heating; Central air conditioning
- Interior features: Ceiling fans; Open floor plan
- Laundry & utility: Washer; Dryer; Laundry closet
Neighborhood map
What this means for you Summary
Snapshot
- This is a 3-bed/2.0-bath townhouse listed at $220k.
Deal economics
- At list price, monthly cash flow is $-168 ($-2k/yr) — negative.
- To cash-flow at today's rent, offer at most $190k (13.5% below list).
- Meets the 1% rule at list price ($2k rent vs $220k).
- Recommended offer: $190k (13.5% below list) — sets the bar for cash-flow.
- Cap rate 5.4% vs local median 3.6% in Winter Springs — top-decile yield for the area; either an underpriced asset or a hidden risk that comps aren't pricing in. Stress-test before assuming the spread holds.
Location & tenants
- Location reads 75/100 on livability (#261 in FL, #4,187 nationally) — a middle-class / working-renter tenant base. Strengths: crime A+, housing A+, health & safety A+; Watch: amenities F, commute F.
- Seminole (suburban): math 57% / reading 61% proficiency, ranked #13 of 73 in FL (top 18%) — acceptable for families but not a draw, mixed tenant base, ~2y average lease.
- Market conditions: Rents rising (+3.6%/yr); 274 active listings in the ZIP; 11 comparable units currently listed for rent nearby; rentals at typical pace (median 21d on market — plan ~3-4 weeks tenant-placement turnaround); solid renter incomes; 1,979 units permitted in Seminole County in 2024 (1,191 in 5+ unit buildings).
Forward outlook
- Local home prices are declining (-3.0%/yr); year-one equity from $2k of loan paydown is wiped out by about $7k of value loss. Plan a longer hold.
- Seminole County population projected at +24% by 2050 — long-run rental-demand tailwind backs the buy-and-hold thesis.
Negotiation context
- It's been on market 154 days — a 12% lower offer ($194k) is reasonable based on typical stale-listing flexibility.
- 4 sale attempts since 2y ago; this cycle's ask has dropped $40k (15%) from the opening price — seller is motivated, your offer sets the floor, not the list.
- Current owner paid $165k; 33% above their basis — modest negotiation headroom, anchor on the comps not their cost.
Risks & watch-outs
- Watch-outs: HOA is 22% of rent.
- Climate carrying-cost: severe wind risk, 99% chance of damaging wind over 30y; extreme-heat days projected 7→22/yr by 2055 (HVAC capex compounding) — expect insurance premiums to compound above CPI over the hold.
Questions for the listing agent
- What do current leases actually rent for vs. the listed asking? Can we see a recent rent roll and the last 12 months of T-12 income?
- It's been on market 154 days. Have you received any prior offers? Is the seller open to a 13% concession, seller financing, or rate buy-down credit?
- What does the HOA fee cover, when was the last increase, and are there any pending special assessments or reserve-fund shortfalls?
- Why hasn't it sold? Are there any deal-killer items the seller is aware of (foundation, flood, title, zoning, code violations)?
- Is there a deadline driving the sale (1031 exchange, divorce, estate, relocation)? That informs how much negotiation room exists.
- Schools are A-rated — typically a magnet for longer-tenancy family renters. What's the average tenant stay here, and is there a school-zone premium baked into asking?
- The area grade is low — what's the realistic commute time and amenity access for the typical tenant pool here? Any planned neighborhood developments (good or bad) we should know about?
- What's the average days-on-market for RENTAL listings here right now (not sales)? A rising rental-DOM trend means longer vacancies and softer asking-rent achievability than the comps imply.
- What's the recent tenant-quality profile in this submarket — average credit score on applications, eviction rate, late-payment / NSF rate, and stable-employment percentage? A property-management company in the area should have these aggregated.
- How much new for-sale + rental construction is in the pipeline within 1–3 miles? Heavy new supply typically softens prices + rents 12–24 months out; constrained supply supports both.
Investment metrics
- 1% rule
- 1.06% ✓
- Cap rate
- 5.38%
- Cash-on-cash
- -3.27%
- DSCR
- 0.85
- GRM
- 7.8
CMA / ARV
- ARV (on-the-fly)
- $272,033
- Comps found
- 12
Show comp detail 12 sales within ~0.75 mi
| Address | Dist | Beds/Ba | Sqft | Sold | Price | $/sf | Match |
|---|---|---|---|---|---|---|---|
| 4467 Brook Hollow Cir | 0.04mi | 3/2.5 | 1,344 (-2%) | 1mo | $255,000 | $190 | 92 |
| 552 Shadow Glenn Pl | 0.18mi | 2/2.5 (-1) | 1,359 (-1%) | 2mo | $260,000 | $191 | 82 |
| 4249 E Weeping Willow Cir | 0.14mi | 3/2.5 | 1,348 (-1%) | 14mo | $287,500 | $213 | 77 |
| 537 Shadow Glenn Pl | 0.16mi | 3/2.5 | 1,359 (-1%) | 16mo | $285,870 | $210 | 76 |
| 505 Shadow Glenn Pl | 0.14mi | 2/1.5 (-1) | 1,359 (-1%) | 14mo | $210,000 | $155 | 74 |
| 576 Shadow Glenn Pl | 0.18mi | 3/2.5 | 1,343 (-2%) | 16mo | $260,000 | $194 | 73 |
| 190 Post Way | 0.46mi | 3/2.5 | 1,260 (-8%) | 11mo | $277,000 | $220 | 54 |
| 237 S Wilderness Pt | 0.65mi | 2/2.5 (-1) | 1,260 (-8%) | 8mo | $230,000 | $183 | 43 |
| 4045 Crossroads Pl | 0.41mi | 2/2.0 (-1) | 1,166 (-15%) | 12mo | $249,000 | $214 | 41 |
| 4060 E Maryland Pl | 0.45mi | 2/2.0 (-1) | 1,166 (-15%) | 12mo | $253,000 | $217 | 40 |
| 4008 Crossroads Pl | 0.46mi | 2/2.5 (-1) | 1,166 (-15%) | 13mo | $232,500 | $199 | 36 |
| 205 S Wilderness Pt | 0.66mi | 2/2.5 (-1) | 1,166 (-15%) | 6mo | $228,000 | $196 | 33 |
Match score weights: distance 35% · size 25% · config 20% · recency 20%. Top-matched comps best support the ARV.
Projected returns pro-forma
-3.0% appreciation · 3.58% rent growth · sell at horizon
- IRR
- -20.7%
- Equity multiple
- 0.28×
- Total profit
- $-44,618
- Equity at exit
- $32,803
- IRR
- -11.9%
- Equity multiple
- 0.26×
- Total profit
- $-45,526
- Equity at exit
- $19,022
Cash invested: $61,600 (down + closing). Projections, not guarantees.
Landlord ↔ Tenant lean methodology
- Overall (STATE)
- 87 Strongly Landlord-Friendly
- State Florida
- 87 Strongly Landlord-Friendly · R+3
- County
- — inherits STATE
- City
- — inherits STATE
ZIP-level market 32708
- Rents YoY
- 3.6%
- Active inventory
- 274
- Price-to-rent
- 7.8×
Monthly cashflow live
- Estimated rent
- $2,339 high interval (Pro) →
- Mortgage (P&I)
- −$1,154
- Tax from tax record
- −$258 /mo · $3,101/yr
- Insurance
- −$92
- HOA
- −$512
- Vacancy / Maint / Mgmt
- −$491
- Net cashflow
- $-168
Break-even live
Sensitivity live
| Price | -10% $-43 | -5% $-105 | +0% $-168 | +5% $-230 | +10% $-292 |
|---|---|---|---|---|---|
| Rent | -10% $-353 | -5% $-260 | +0% $-168 | +5% $-75 | +10% $17 |
| Rate | -1.0pp $-57 | -0.5pp $-112 | base $-168 | +0.5pp $-225 | +1.0pp $-283 |
UW: 25.0% down · 7.5% · 30yr · 1.5% tax · 5.0% vac · 8.0% maint · 8.0% mgmt
Financing live
Cash to close
- Down payment
- $55,000
- Closing costs
- $6,600
- Reserves months
- —
- Total cash needed
- —
Loan-product check · same deal, 3 products live
Conventional
25% down · 7.5% · 30yr
- Down + closing
- —
- Monthly P&I
- —
- Monthly cashflow
- —
- DSCR
- —
- Eligible?
- —
Personal DTI + credit; lowest rate.
DSCR
20% down · 8.5% · 30yr
- Down + closing
- —
- Monthly P&I
- —
- Monthly cashflow
- —
- DSCR
- —
- Eligible?
- —
No personal income docs; deal must DSCR.
Hard money
10% down · 12.0% · 12mo
- Down + closing
- —
- Monthly P&I
- —
- Monthly cashflow
- —
- DSCR
- —
- Eligible?
- —
Short-term bridge; refi at stabilization.
Rent comps 11 comps
| Address | Beds | Baths | Sqft | Rent | $/sqft | DOM | Units | Dist |
|---|---|---|---|---|---|---|---|---|
| 541 Moccasin Ct Casselberry, FL | 2.0 | 2.0 | 1208 | $2,095 | $1.73 | 24d | 1 | 0.36mi |
| 3747 Okeechobee Cir Casselberry, FL | 3.0 | 2.5 | 1591 | $2,600 | $1.63 | 24d | 1 | 0.40mi |
| 990 English Town Ln Winter Springs, FL | 1.0–3.0 | 1.0–2.0 | 990 | $2,559 | $2.58 | 3d | 15 | 0.71mi |
| 1020 Chatham Pines Cir Winter Springs, FL | 1.0–3.0 | 1.0–2.0 | 865 | $2,121 | $2.45 | 2d | 12 | 0.88mi |
| 1445 Bird Rd Winter Springs, FL | 3.0 | 2.0 | 1500 | $2,500 | $1.67 | 24d | 1 | 1.03mi |
| 1013 Taproot Dr Winter Springs, FL | 4.0 | 2.0 | 1764 | $2,565 | $1.45 | 24d | 1 | 1.22mi |
| 1239 La Mesa Ave Winter Springs, FL | 3.0 | 2.0 | 1255 | $2,079 | $1.66 | 3d | 1 | 1.39mi |
| 1448 La Paloma Cir Winter Springs, FL | 3.0 | 2.0 | 1407 | $2,120 | $1.51 | 21d | 1 | 1.44mi |
| 986 Rollingwood Loop Casselberry, FL | 2.0 | 1.0–2.0 | 669 | $1,880 | $2.81 | 24d | 15 | 1.47mi |
| 2982 Embassy Ct Casselberry, FL | 2.0 | 2.5 | 1238 | $1,895 | $1.53 | 2d | 1 | 1.49mi |
| 2982 Embassy Ct Casselberry, FL | 2.0 | 2.5 | 1238 | $1,895 | $1.53 | 18d | 1 | 1.49mi |
HOA detail
- Monthly dues
- $512 · $6,144/yr
Listing history 26 events
-
2026-06-18days on market $220,000 Active 154 DOM
-
2026-06-17days on market $220,000 Active 153 DOM
-
2026-06-16days on market $220,000 Active 152 DOM
-
2026-06-15days on market $220,000 Active 151 DOM
-
2026-06-13days on market $220,000 Active 149 DOM
-
2026-06-10price $220,000 Active 145 DOM
-
2026-06-09days on market $230,000 Active 145 DOM
-
2026-06-08days on market $230,000 Active 144 DOM
-
2026-06-07days on market $230,000 Active 143 DOM
-
2026-06-04days on market $230,000 Active 140 DOM
-
2026-06-03days on market $230,000 Active 139 DOM
-
2026-06-02days on market $230,000 Active 138 DOM
-
2026-06-02days on market $230,000 Active 137 DOM
-
2026-05-31days on market $230,000 Active 136 DOM
-
2026-04-23price $230,000
-
2026-03-10price $240,000
-
2026-02-18price $250,000
-
2026-01-15$260,000 Active
-
2025-01-20historical $1,849
-
2024-12-20$1,849
-
2024-01-20historical $1,850
-
2024-01-13$1,850
-
2024-01-12historical $1,850
-
2024-01-11$1,850
-
2019-01-04soldstatus $165,000
-
2000-08-10soldstatus $81,500
ⓘ Source: listings_history table (triggers on properties + properties_extension) + one-shot
backfill from property_details.listing_events for pre-trigger history.
Tax reassessment forecast FL · Resets to sale price
- Current annual tax
- $3,101 · $258/mo
- Projected year-2 tax
- $3,101 · $258/mo
- Expected delta
- $0/yr ($0/mo · 0.0%)
ⓘ Screening estimate from a state-policy table — verify with the county assessor before closing.
Climate risk First Street
- Flood 1/10 Low FEMA zone X (unshaded) · 0% chance over 30 yrs
- Wildfire 2/10 Low
- Heat 8/10 Severe 7 d/yr ≥108°F today · 22 d/yr by 30 yrs out
- Wind 9/10 Extreme 99% chance of damaging wind over 30 yrs
- Air quality 2/10 Low 1 unhealthy d/yr today · 2 by 30 yrs out
Nearby sold comps map
Loading sold comps map…
Walkable amenities ~0.75 mi
Loading nearby amenities…
Taxation est. · year 1
- Rental income
- $28,072
- − Mortgage interest
- −$12,323
- − Property taxes
- −$3,101
- − Insurance
- −$1,100
- − Repairs & maintenance
- −$2,246
- − Management
- −$2,246
- − HOA
- −$6,144
- − Depreciation
- −$6,400
- Taxable loss
- −$5,488
- Est. tax savings @ 24.0%
- +$1,317
- After-tax cash flow
- $-695/yr
For passive investors: Depreciation is non-cash, so a rental often shows a tax loss while cash-flowing — sheltering income. Rental losses are passive: they offset passive income freely, and up to $25,000/yr can offset ordinary (W-2) income if you actively participate and your MAGI is under $100k (phasing out to $0 by $150k); unused losses carry forward. On sale, claimed depreciation is recaptured at up to 25%, and gains may owe capital-gains tax (a 1031 exchange can defer both). Figures are a year-1 estimate at your 24.0% rate — not tax advice; consult a CPA.
Schools (NCES district)
- District
- Seminole
- NCES district ID
- 1201710
- Math proficiency
- 57% ▼ -7.00%
- Reading proficiency
- 61% ▼ -1.00%
- Median HH income
- $58,478
- Composite
- 51.05/100
- National rank
- #1769
- State rank
- #13 of 73 in FL
Livability — Winter Springs
- Score
- 75/100
- State rank
- #261
- US rank
- #4187
Category grades
Schools grade is shown separately in the Schools card above.
Census & demographics
- County
- Seminole County · 436,154 people
- City population
- 48,965
- Metro
- Orlando-Kissimmee-Sanford, FL
- Population (ZIP)
- 48,965
- Household income
- $93,628
- Rent vs Own
- Severe rent burden
- 1023.0
Population outlook (Seminole County) Hauer SSP2
- Today (2025)
- 515,494 people
- By 2030
- 545,713 · +5.9%
- By 2040
- 598,068 · +16.0%
- By 2050
- 640,663 · +24.3%
- By 2075
- 724,461 · +40.5%
- By 2100
- 755,530 · +46.6%
Race, ethnicity, and origin ACS 2023
- Neighborhood character
- Majority White (63%)
- Race & ethnicity
- White 63% Hispanic / Latino 23% Two or more races 11% Black 6% Asian 4%
- Hispanic origin (detail)
- Mexican 1% Puerto Rican 12% Cuban 2% Dominican 1%
- Common ancestry
- Lithuanian 3% Slovak 3% Romanian 2%
- Foreign-born
- 11% · Canada, Jamaica, Vietnam
- Languages at home
- 77% English-only · Spanish 15% Other Indo-European 2% French/Haitian/Cajun 1%
Political lean MEDSL · Seminole
- 2024 margin
- Toss-up / Even · D 47.6% · R 51.1% · Other 1.3%
- 2008→2024 swing
- -0.8pp no change · 2008: -2.8pp · 2024: -3.5pp
- All cycles
- 2024: R+3.5 2020: D+2.8 2016: R+1.6 2012: R+6.5 2008: R+2.8
Not yet ingested
- Civics
- —
Market trends
- HPI YoY
- ▼ -188.76%
- Current HPI
- 308.2797
- Rent YoY
- ▲ 3.58%
- Metro
- Orlando-Kissimmee-Sanford, FL
- State GDP YoY
- ▲ 3.28%
- F500 in state
- 36
Industry mix (Fortune 500 HQ in FL)
| Industry | F500 HQs | Revenue |
|---|---|---|
| Industrial Technology | 2 | $29B |
|
||
| Insurance | 2 | $17B |
|
||
| Retail | 1 | $60B |
|
||
| Technology Distribution | 1 | $58B |
|
||
| Homebuilding | 1 | $35B |
|
||
| Technology Manufacturing | 1 | $35B |
|
||
Price history
+182.2% since first listed12 events — show timeline
- 2026-04-23 Price Changed $230,000 Stellar MLS as Distributed by MLS Grid
- 2026-03-10 Price Changed $240,000 Stellar MLS as Distributed by MLS Grid
- 2026-02-18 Price Changed $250,000 Stellar MLS as Distributed by MLS Grid
- 2026-01-15 Listed $260,000 Stellar MLS as Distributed by MLS Grid
- 2025-01-20 Rental Removed $1,849 APPFOLIO
- 2024-12-20 Listed for Rent $1,849 APPFOLIO
- 2024-01-20 Rental Removed $1,850 APPFOLIO
- 2024-01-13 Listed for Rent $1,850 APPFOLIO
- 2024-01-12 Rental Removed $1,850 STELLARMLS
- 2024-01-11 Listed for Rent $1,850 STELLARMLS
- 2019-01-04 Sold (Public Records) $165,000 Public Records
- 2000-08-10 Sold (Public Records) $81,500 Public Records
Property tax history
+7.3%/yrLatest (2025): $3,101 · +7.7% YoY. Source: county tax records.
Cash-flow waterfall
monthlySold comps — $/sqft
last 12 mo · ≤1 miLoading sold comps…