7701 Sherwood Blvd · Los Molinos, CA
Flood risk 5/10 · Moderate
- FEMA flood zone
- X (unshaded)
- Chance of flooding over 30 yrs
- 0.24%
- Est. flood insurance / yr
- $507 – $1,088
Fire risk 8/10 · Major
- Est. fire insurance / yr
- $659 – $1,223
Heat risk 8/10 · Major
- Hot days now (above 106°F)
- 7 days/yr
- Hot days in 30 yrs
- 16 days/yr
Wind risk 1/10 · Minimal
- Chance of severe wind over 30 yrs
- —
Air-quality risk 10/10 · Severe
- Unhealthy air days now
- 34 days/yr
- Unhealthy air days in 30 yrs
- 38 days/yr
Risk factors via First Street. Map © Google.
Why this score? — see what drove the D+ grade
The composite is a weighted blend of 9 inputs, each scored 0–100. Each bar is that input's sub-score; the figure is the points it added to the 100-point composite (weight × sub-score).
- Cash flow +18.0/30.0
- ARV discount +7.5/15.0
- DSCR +5.6/10.0
- 1% rule +3.6/10.0
- Livability +3.0/5.0
- Schools +2.6/10.0
- Rent growth +2.5/5.0
- Condition / age +2.5/5.0
- Appreciation +0.0/10.0
$249,000
🖨 Deal sheet (PDF) 📄 Offer letter ✓ Due diligence
Listing remarks MLS
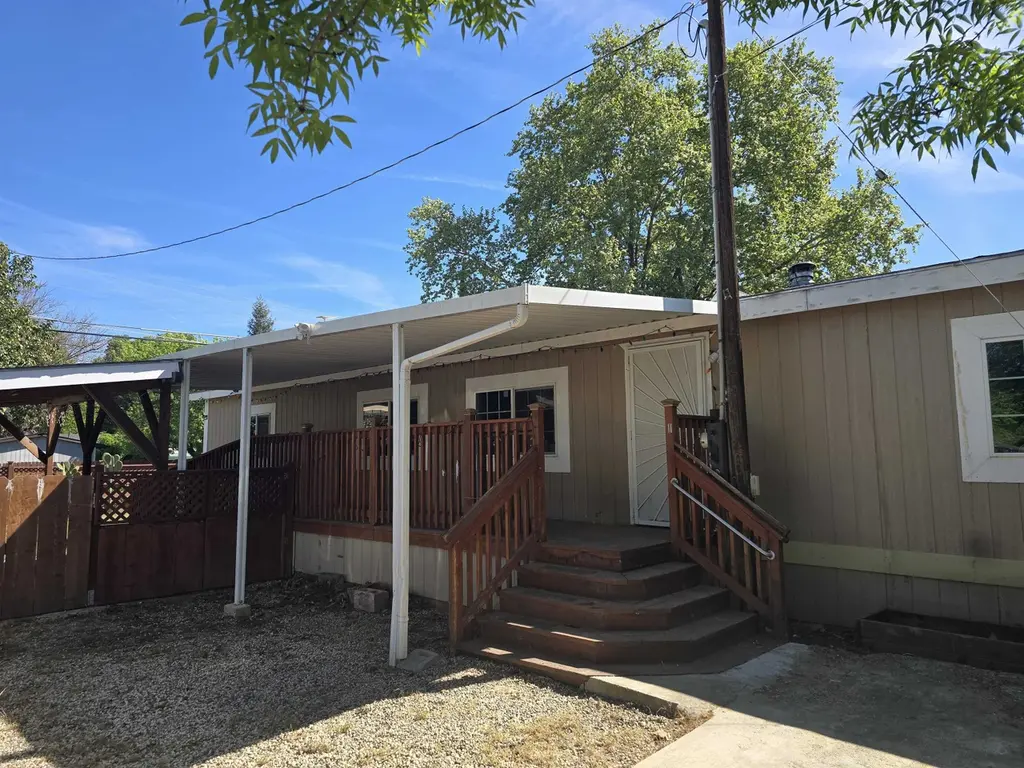
SPACIOUS 3 BED 2 BATH HOME ON CORNER LOT IN LOS MOLINOS. HOME HAS NEWER FLOORING, LARGE LIVING ROOM, MASTER BEDROOM, WALK IN CLOSET, BONUS ROOM OFF DINING/KITCHEN AND LOTS OF STORAGE INSIDE AND OUT. COVERED FRON PORCH WITH RAMP, ALLEY ACCESS AND SHORT COMMUTE TO CHICO OR RED BLUFF. CLOSE TO SCHOOLS AND EMINITIES. HOME IS ON 433A FOUNDATION.
Key facts
- 6,534 sq ft lot
- Built 1993
- Listed 87 days
Neighborhood map
What this means for you Summary
Snapshot
- This is a 3-bed/2.0-bath manufactured listed at $249k.
Deal economics
- At list price, monthly cash flow is $213 ($3k/yr) — positive.
- The deal already cash-flows at list — no discount required.
- To meet the 1% rule (rent ≥ 1% of price), the offer needs to be $215k (13.7% below list).
- Recommended offer: $215k (13.7% below list) — sets the bar for 1% rule.
Location & tenants
- Location reads 59/100 on livability (#650 in CA) — a working-class tenant base; expect higher turnover. Strengths: housing A, crime B; Watch: cost of living D+, amenities F, commute F.
- Los Molinos Unified (rural): math 26% / reading 37% proficiency, ranked #339 of 517 in CA (top 66%) — families likely to look elsewhere, expect single-tenant / working-renter base with shorter leases; 68% free/reduced lunch — lower-income household profile, screen leases tightly.
- Zoned schools: Los Molinos Elementary (math 27% / reading 32%, grade F, #856 of 1,571 statewide, top 57%, 236 students, 82% FRL); Los Molinos High (math 5% / reading 44%, grade F, #811 of 1,170 statewide, top 70%, 213 students, 66% FRL).
- Market conditions: 25 active listings in the ZIP; 1 comparable units currently listed for rent nearby; 186 units permitted in Tehama County in 2024 (0 in 5+ unit buildings).
Forward outlook
- Local home prices are declining (-3.0%/yr); year-one equity from $2k of loan paydown is wiped out by about $7k of value loss. Plan a longer hold.
- Tehama County population projected at -14% by 2050 — secular population decline; favor cash flow + early exit over multi-decade hold.
Negotiation context
- It's been on market 87 days — a 6% lower offer ($234k) is reasonable based on typical stale-listing flexibility.
- 2 sale attempts with the ask held roughly flat each time — persistent listings suggest the price (not the market) is what's stuck; bring a comps-based counter.
Risks & watch-outs
- Climate carrying-cost: moderate flood risk; severe wildfire risk; extreme-heat days projected 7→16/yr by 2055 (HVAC capex compounding) — expect insurance premiums to compound above CPI over the hold.
Questions for the listing agent
- It's been on market 87 days. Have you received any prior offers? Is the seller open to a 14% concession, seller financing, or rate buy-down credit?
- Why hasn't it sold? Are there any deal-killer items the seller is aware of (foundation, flood, title, zoning, code violations)?
- Is there a deadline driving the sale (1031 exchange, divorce, estate, relocation)? That informs how much negotiation room exists.
- Schools are D-rated, which usually means shorter tenancies and higher turnover. Who's the typical renter profile here, and what's been the actual vacancy rate?
- The area grade is low — what's the realistic commute time and amenity access for the typical tenant pool here? Any planned neighborhood developments (good or bad) we should know about?
- What's the average days-on-market for RENTAL listings here right now (not sales)? A rising rental-DOM trend means longer vacancies and softer asking-rent achievability than the comps imply.
- What's the recent tenant-quality profile in this submarket — average credit score on applications, eviction rate, late-payment / NSF rate, and stable-employment percentage? A property-management company in the area should have these aggregated.
- How much new for-sale + rental construction is in the pipeline within 1–3 miles? Heavy new supply typically softens prices + rents 12–24 months out; constrained supply supports both.
Investment metrics
- 1% rule
- 0.86% ✗
- Cap rate
- 7.32%
- Cash-on-cash
- 3.67%
- DSCR
- 1.16
- GRM
- 9.7
CMA / ARV
- ARV (median comp)
- $135,625
- List price
- $249,000
- Delta
- 83.59%
- Verdict
- OVERPRICED
- Comps
- 2 within 1.0 mi
Show comp detail 4 sales within ~0.75 mi
| Address | Dist | Beds/Ba | Sqft | Sold | Price | $/sf | Match |
|---|---|---|---|---|---|---|---|
| 25246 Lee St | 0.32mi | 2/2.0 (-1) | 1,440 (-8%) | 23mo | $252,000 | $175 | 48 |
| 7985 Ricalia Ln | 0.63mi | 3/2.0 | 1,456 (-7%) | 23mo | $265,000 | $182 | 40 |
| 25095 Tehama Vina Rd | 0.75mi | 4/2.0 (+1) | 1,782 (+14%) | 4mo | $69,000 | $39 | 33 |
| 25419 Tehama Vina Rd Rd | 0.67mi | 3/2.0 | 1,350 (-14%) | 22mo | $349,000 | $259 | 28 |
Match score weights: distance 35% · size 25% · config 20% · recency 20%. Top-matched comps best support the ARV.
Projected returns pro-forma
-3.0% appreciation · 3.0% rent growth · sell at horizon
- IRR
- -10.6%
- Equity multiple
- 0.61×
- Total profit
- $-26,884
- Equity at exit
- $37,127
- IRR
- -1.3%
- Equity multiple
- 0.91×
- Total profit
- $-6,384
- Equity at exit
- $21,529
Cash invested: $69,720 (down + closing). Projections, not guarantees.
Landlord ↔ Tenant lean methodology
- Overall (STATE)
- 18 Strongly Tenant-Friendly
- State California
- 18 Strongly Tenant-Friendly · D+13
- County
- — inherits STATE
- City
- — inherits STATE
ZIP-level market 96055
- Home prices YoY
- -10.2%
- Active inventory
- 25
- Price-to-rent
- 9.7×
Monthly cashflow live
- Estimated rent
- $2,150 medium interval (Pro) →
- Mortgage (P&I)
- −$1,306
- Tax from tax record
- −$76 /mo · $910/yr
- Insurance
- −$104
- HOA
- −$0
- Vacancy / Maint / Mgmt
- −$452
- Net cashflow
- $213
Break-even live
Sensitivity live
| Price | -10% $354 | -5% $284 | +0% $213 | +5% $143 | +10% $72 |
|---|---|---|---|---|---|
| Rent | -10% $43 | -5% $128 | +0% $213 | +5% $298 | +10% $383 |
| Rate | -1.0pp $339 | -0.5pp $276 | base $213 | +0.5pp $149 | +1.0pp $83 |
UW: 25.0% down · 7.5% · 30yr · 1.5% tax · 5.0% vac · 8.0% maint · 8.0% mgmt
Financing live
Cash to close
- Down payment
- $62,250
- Closing costs
- $7,470
- Reserves months
- —
- Total cash needed
- —
Loan-product check · same deal, 3 products live
Conventional
25% down · 7.5% · 30yr
- Down + closing
- —
- Monthly P&I
- —
- Monthly cashflow
- —
- DSCR
- —
- Eligible?
- —
Personal DTI + credit; lowest rate.
DSCR
20% down · 8.5% · 30yr
- Down + closing
- —
- Monthly P&I
- —
- Monthly cashflow
- —
- DSCR
- —
- Eligible?
- —
No personal income docs; deal must DSCR.
Hard money
10% down · 12.0% · 12mo
- Down + closing
- —
- Monthly P&I
- —
- Monthly cashflow
- —
- DSCR
- —
- Eligible?
- —
Short-term bridge; refi at stabilization.
Rent comps 1 comps
| Address | Beds | Baths | Sqft | Rent | $/sqft | DOM | Units | Dist |
|---|---|---|---|---|---|---|---|---|
| 8285 Buena Vista Ave Los Molinos, CA | 3.0 | 2.0 | 1379 | $2,150 | $1.56 | 15d | 1 | 1.16mi |
Listing history 21 events
-
2026-06-21days on market $249,000 Active 87 DOM
-
2026-06-19days on market $249,000 Active 85 DOM
-
2026-06-18days on market $249,000 Active 84 DOM
-
2026-06-17days on market $249,000 Active 83 DOM
-
2026-06-16days on market $249,000 Active 82 DOM
-
2026-06-15days on market $249,000 Active 81 DOM
-
2026-06-14days on market $249,000 Active 79 DOM
-
2026-06-13days on market $249,000 Active 78 DOM
-
2026-06-10days on market $249,000 Active 76 DOM
-
2026-06-09days on market $249,000 Active 75 DOM
-
2026-06-08days on market $249,000 Active 74 DOM
-
2026-06-07days on market $249,000 Active 73 DOM
-
2026-06-05days on market $249,000 Active 70 DOM
-
2026-06-03days on market $249,000 Active 69 DOM
-
2026-06-02days on market $249,000 Active 68 DOM
-
2026-06-01days on market $249,000 Active 67 DOM
-
2026-05-31days on market $249,000 Active 66 DOM
-
2026-05-30days on market $249,000 Active 65 DOM
-
2026-03-25$249,000 Active 342-char remark
Show marketing remark (342 chars)
SPACIOUS 3 BED 2 BATH HOME ON CORNER LOT IN LOS MOLINOS. HOME HAS NEWER FLOORING, LARGE LIVING ROOM, MASTER BEDROOM, WALK IN CLOSET, BONUS ROOM OFF DINING/KITCHEN AND LOTS OF STORAGE INSIDE AND OUT. COVERED FRON PORCH WITH RAMP, ALLEY ACCESS AND SHORT COMMUTE TO CHICO OR RED BLUFF. CLOSE TO SCHOOLS AND EMINITIES. HOME IS ON 433A FOUNDATION.
-
2026-03-13historical
-
2025-10-16$299,000 Active
ⓘ Source: listings_history table (triggers on properties + properties_extension) + one-shot
backfill from property_details.listing_events for pre-trigger history.
Tax reassessment forecast CA · Resets to sale price
- Current annual tax
- $910 · $76/mo
- Projected year-2 tax
- $1,892 · $158/mo
- Expected delta
- +$983/yr (+$82/mo · 108.1%)
ⓘ Screening estimate from a state-policy table — verify with the county assessor before closing.
Climate risk First Street
- Flood 5/10 Major FEMA zone X (unshaded) · 24% chance over 30 yrs
- Wildfire 8/10 Severe
- Heat 8/10 Severe 7 d/yr ≥106°F today · 16 d/yr by 30 yrs out
- Wind 1/10 Low
- Air quality 10/10 Extreme 34 unhealthy d/yr today · 38 by 30 yrs out
Nearby sold comps map
Loading sold comps map…
Walkable amenities ~0.75 mi
Loading nearby amenities…
Taxation est. · year 1
- Rental income
- $25,800
- − Mortgage interest
- −$13,948
- − Property taxes
- −$910
- − Insurance
- −$1,245
- − Repairs & maintenance
- −$2,064
- − Management
- −$2,064
- − Depreciation
- −$7,244
- Taxable loss
- −$1,674
- Est. tax savings @ 24.0%
- +$402
- After-tax cash flow
- $2,960/yr
For passive investors: Depreciation is non-cash, so a rental often shows a tax loss while cash-flowing — sheltering income. Rental losses are passive: they offset passive income freely, and up to $25,000/yr can offset ordinary (W-2) income if you actively participate and your MAGI is under $100k (phasing out to $0 by $150k); unused losses carry forward. On sale, claimed depreciation is recaptured at up to 25%, and gains may owe capital-gains tax (a 1031 exchange can defer both). Figures are a year-1 estimate at your 24.0% rate — not tax advice; consult a CPA.
Schools (NCES district)
- District
- Los Molinos Unified
- NCES district ID
- 0622860
- Math proficiency
- 26% ▼ -8.00%
- Reading proficiency
- 37% ▼ -9.00%
- Median HH income
- $39,064
- Composite
- 26.36/100
- National rank
- #7234
- State rank
- #339 of 517 in CA
Livability — Los Molinos
- Score
- 59/100
- State rank
- #650
- US rank
- #20269
Category grades
Schools grade is shown separately in the Schools card above.
Census & demographics
- Census place
- Los Molinos, CA
- Population (ZIP)
- 3,404
Population outlook (Tehama County) Hauer SSP2
- Today (2025)
- 61,058 people
- By 2030
- 59,493 · -2.6%
- By 2040
- 56,076 · -8.2%
- By 2050
- 52,372 · -14.2%
- By 2075
- 43,895 · -28.1%
- By 2100
- 34,186 · -44.0%
Race, ethnicity, and origin ACS 2023
- Neighborhood character
- Majority White (61%)
- Race & ethnicity
- White 61% Hispanic / Latino 34% Two or more races 19% Asian 1%
- Hispanic origin (detail)
- Mexican 32% Puerto Rican 2%
- Common ancestry
- Italian 4% Lithuanian 3% Portuguese 3%
- Foreign-born
- 10% · Canada, China
- Languages at home
- 72% English-only · Spanish 25% Other Indo-European 1% Chinese 1%
Political lean MEDSL · Tehama
- 2024 margin
- Solid R (+41.8) · D 27.9% · R 69.7% · Other 2.3%
- 2008→2024 swing
- -17.7pp toward R · 2008: -24.1pp · 2024: -41.8pp
- All cycles
- 2024: R+41.8 2020: R+35.6 2016: R+36.8 2012: R+27.4 2008: R+24.1
Not yet ingested
- Civics
- —
Market trends
- HPI YoY
- ▼ -29.37%
- Current HPI
- 259.2093
- Rent YoY
- —
- Metro
- —
- State GDP YoY
- ▲ 3.21%
- F500 in state
- 116
Industry mix (Fortune 500 HQ in CA)
| Industry | F500 HQs | Revenue |
|---|---|---|
| Technology | 27 | $1,492B |
|
||
| Financial Services | 3 | $174B |
|
||
| Retail | 3 | $44B |
|
||
| Insurance | 3 | $26B |
|
||
| Media / Entertainment | 2 | $115B |
|
||
| Pharmaceuticals / Biotech | 2 | $62B |
|
||
Price history
-16.7% since first listed3 events — show timeline
- 2026-03-25 Listed $249,000 TCAOR
- 2026-03-13 Listing Removed — CRMLS
- 2025-10-16 Listed $299,000 CRMLS
Property tax history
+12.3%/yrLatest (2025): $910 · +2.0% YoY. Source: county tax records.
Cash-flow waterfall
monthlySold comps — $/sqft
last 12 mo · ≤1 miLoading sold comps…