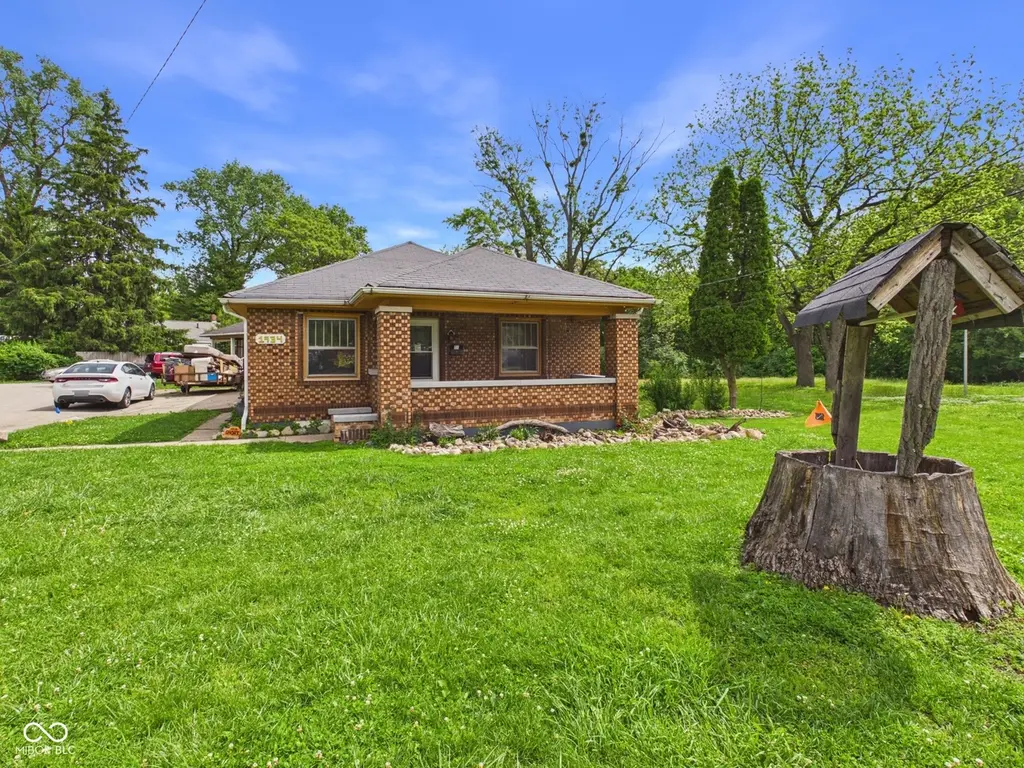
1934 Ohio Ave · Anderson, IN
Flood risk 1/10 · Minimal
- FEMA flood zone
- X (unshaded)
- Chance of flooding over 30 yrs
- 0.0%
- Est. flood insurance / yr
- $473 – $860
Fire risk 1/10 · Minimal
- Est. fire insurance / yr
- $717 – $1,331
Heat risk 3/10 · Minor
- Hot days now (above 100°F)
- 7 days/yr
- Hot days in 30 yrs
- 18 days/yr
Wind risk 2/10 · Minimal
- Chance of severe wind over 30 yrs
- 0.0%
Air-quality risk 3/10 · Minor
- Unhealthy air days now
- 2 days/yr
- Unhealthy air days in 30 yrs
- 3 days/yr
Risk factors via First Street. Map © Google.
Why this score? — see what drove the B+ grade
The composite is a weighted blend of 9 inputs, each scored 0–100. Each bar is that input's sub-score; the figure is the points it added to the 100-point composite (weight × sub-score).
- Cash flow +30.0/30.0
- ARV discount +15.0/15.0
- 1% rule +10.0/10.0
- DSCR +10.0/10.0
- Rent growth +4.5/5.0
- Livability +3.0/5.0
- Condition / age +2.5/5.0
- Schools +1.6/10.0
- Appreciation +0.0/10.0
$58,900
🖨 Deal sheet 📄 Offer letter ✓ Due diligence
Listing remarks MLS
Nice 2 Bdrm 1 Bath brick ranch features Lg Living rm, formal dinning rm, eat-in kitchen. New vinyl floor in bathroom. Full unfinished basement plus 2 car att garage. New gas hot water, base board furnace. New electrical box & wiring. Newer roof. Ready to move in. Extra nice for the price. Great investment potential.
Key facts
- Easy access
- Full basement
- Brick home
Tags
Property features AI
Exterior
- Parking: Attached 2-car garage (504 sq ft)
- Utilities: Public water; Municipal sewer connected
- Home design: Single-family residence; One level
- Construction: Brick construction; Block foundation
- Exterior features: Half- to one-acre lot (0.5 acre)
Interior
- Kitchen: No appliances included
- Bedrooms: 2 bedrooms on the main level
- Bathrooms: 1 full bathroom (main level)
- Heating & cooling: Baseboard and hot water heating; Central air conditioning
- Interior features: Attic access; Finished basement
Neighborhood map
What this means for you Summary
Snapshot
- This is a 2-bed/1.0-bath single-family listed at $59k.
Deal economics
- At list price, monthly cash flow is $365 ($4k/yr) — positive.
- The deal already cash-flows at list — no discount required.
- Meets the 1% rule at list price ($977 rent vs $59k).
- Recommended offer: $58k (1.5% below list) — sets the bar for market timing.
- Cap rate 13.7% vs local median 6.5% in Anderson — top-decile yield for the area; either an underpriced asset or a hidden risk that comps aren't pricing in. Stress-test before assuming the spread holds.
Location & tenants
- Location reads 60/100 on livability (#521 in IN) — a middle-class / working-renter tenant base. Strengths: cost of living A+, housing A+; Watch: schools F, crime D-, amenities F.
- Anderson Community School Corporation (urban): math 15% / reading 23% proficiency, ranked #280 of 301 in IN (top 93%) — low school quality limits family demand, transient renter base, plan for 1-2y turnover; 70% free/reduced lunch — lower-income household profile, screen leases tightly.
- Market conditions: Rents rising fast (+7.9%/yr); 185 active listings in the ZIP; 36 comparable units currently listed for rent nearby; rentals at typical pace (median 24d on market — plan ~3-4 weeks tenant-placement turnaround); 44% of comp listings sitting > 30 days — soft ceiling on asking rent; lower-income renter base — watch delinquency; 184 units permitted in Madison County in 2024 (0 in 5+ unit buildings).
- This rent runs 33% of the median local income ($36k/yr) — at the standard rent-burdened threshold; future hikes will face affordability resistance.
Forward outlook
- Local home prices are declining (-3.0%/yr); year-one equity from $407 of loan paydown is wiped out by about $2k of value loss. Plan a longer hold.
- Madison County population projected at -14% by 2050 — secular population decline; favor cash flow + early exit over multi-decade hold.
- At projected returns (-3.0% appreciation + 7.9% rent growth), your $16k cash investment doubles in ~4 years — after that, you're playing with house money.
Negotiation context
- It's been on market 23 days — a 2% lower offer ($58k) is reasonable based on typical stale-listing flexibility.
- 2 sale attempts since 18y ago; this cycle's ask has dropped $4k (6%) from the opening price — seller is motivated, your offer sets the floor, not the list.
- Current owner paid $30k; list at $59k implies a 96% gain — meaningful room to come down on a strong offer.
Risks & watch-outs
- Watch-outs: built in 1929 — expect roof / HVAC / electrical / plumbing capex.
Questions for the listing agent
- Built in 1929 — when were the roof, HVAC, electrical panel, plumbing, and water heater last replaced?
- Is there a deadline driving the sale (1031 exchange, divorce, estate, relocation)? That informs how much negotiation room exists.
- Schools are F-rated, which usually means shorter tenancies and higher turnover. Who's the typical renter profile here, and what's been the actual vacancy rate?
- Crime grade is D in this area — have there been break-ins, vandalism, or insurance claims at this property in the last 3 years? What carrier currently insures it and at what premium?
- What's the average days-on-market for RENTAL listings here right now (not sales)? A rising rental-DOM trend means longer vacancies and softer asking-rent achievability than the comps imply.
- What's the recent tenant-quality profile in this submarket — average credit score on applications, eviction rate, late-payment / NSF rate, and stable-employment percentage? A property-management company in the area should have these aggregated.
- How much new for-sale + rental construction is in the pipeline within 1–3 miles? Heavy new supply typically softens prices + rents 12–24 months out; constrained supply supports both.
Investment metrics
- 1% rule
- 1.66% ✓
- Cap rate
- 13.72%
- Cash-on-cash
- 26.53%
- DSCR
- 2.18
- GRM
- 5.0
CMA / ARV
- ARV (on-the-fly)
- $77,280
- Comps found
- 12
Show comp detail 12 sales within ~0.75 mi
| Address | Dist | Beds/Ba | Sqft | Sold | Price | $/sf | Match |
|---|---|---|---|---|---|---|---|
| 1611 Johnson Ave | 0.30mi | 2/1.0 | 1,104 (-1%) | 2mo | $25,000 | $23 | 82 |
| 1612 Cincinnati Ave | 0.32mi | 3/1.5 (+1) | 1,080 (-4%) | 4mo | $57,000 | $53 | 68 |
| 2334 Walnut St | 0.64mi | 2/1.0 | 1,136 (+1%) | 1mo | $55,000 | $48 | 67 |
| 1525 Home Ave | 0.56mi | 2/1.0 | 1,209 (+8%) | 5mo | $137,000 | $113 | 57 |
| 2911 E Lynn St | 0.71mi | 2/1.0 | 1,092 (-2%) | 8mo | $70,000 | $64 | 56 |
| 717 E 27th St | 0.68mi | 2/1.0 | 1,092 (-2%) | 12mo | $74,900 | $69 | 54 |
| 1541 Walnut St | 0.63mi | 3/1.0 (+1) | 1,032 (-8%) | 0mo | $47,398 | $46 | 52 |
| 1022 Tousey St | 0.58mi | 3/2.0 (+1) | 1,076 (-4%) | 9mo | $118,000 | $110 | 50 |
| 1911 Pearl St | 0.67mi | 3/1.0 (+1) | 1,112 (-1%) | 20mo | $85,000 | $76 | 46 |
| 1040 Alhambra Dr | 0.69mi | 2/1.0 | 1,204 (+8%) | 19mo | $62,000 | $51 | 39 |
| 2628 Pitt St | 0.51mi | 3/2.0 (+1) | 1,243 (+11%) | 23mo | $129,900 | $105 | 30 |
| 1228 Cincinnati Ave | 0.69mi | 3/1.0 (+1) | 979 (-13%) | 23mo | $108,900 | $111 | 23 |
Match score weights: distance 35% · size 25% · config 20% · recency 20%. Top-matched comps best support the ARV.
Projected returns pro-forma
-3.0% appreciation · 7.88% rent growth · sell at horizon
- IRR
- 25.8%
- Equity multiple
- 2.14×
- Total profit
- $18,720
- Equity at exit
- $8,782
- IRR
- 36.3%
- Equity multiple
- 5.19×
- Total profit
- $69,102
- Equity at exit
- $5,093
Cash invested: $16,492 (down + closing). Projections, not guarantees.
Landlord ↔ Tenant lean methodology
- Overall (STATE)
- 90 Strongly Landlord-Friendly
- State Indiana
- 90 Strongly Landlord-Friendly · R+11
- County
- — inherits STATE
- City
- — inherits STATE
ZIP-level market 46016
- Home prices YoY
- -3.5%
- Rents YoY
- 7.9%
- Active inventory
- 185
- Price-to-rent
- 5.0×
Monthly cashflow live
- Estimated rent
- $977 high interval (Pro) →
- Mortgage (P&I)
- −$309
- Tax est. 1.5%
- −$74 /mo · $884/yr
- Insurance
- −$25
- HOA
- −$0
- Vacancy / Maint / Mgmt
- −$205
- Net cashflow
- $365
Break-even live
UW: 25.0% down · 7.5% · 30yr · 1.5% tax · 5.0% vac · 8.0% maint · 8.0% mgmt
Financing live
Cash to close
- Down payment
- $14,725
- Closing costs
- $1,767
- Reserves months
- —
- Total cash needed
- —
Loan-product check · same deal, 3 products live
Conventional
25% down · 7.5% · 30yr
- Down + closing
- —
- Monthly P&I
- —
- Monthly cashflow
- —
- DSCR
- —
- Eligible?
- —
Personal DTI + credit; lowest rate.
DSCR
20% down · 8.5% · 30yr
- Down + closing
- —
- Monthly P&I
- —
- Monthly cashflow
- —
- DSCR
- —
- Eligible?
- —
No personal income docs; deal must DSCR.
Hard money
10% down · 12.0% · 12mo
- Down + closing
- —
- Monthly P&I
- —
- Monthly cashflow
- —
- DSCR
- —
- Eligible?
- —
Short-term bridge; refi at stabilization.
Rent comps 36 comps
| Address | Beds | Baths | Sqft | Rent | $/sqft | DOM | Units | Dist |
|---|---|---|---|---|---|---|---|---|
| 2233 E Lynn St Anderson, IN | 1.0 | 1.0 | 700 | $695 | $0.99 | 1d | 1 | 0.31mi |
| 2023 McKinley St Anderson, IN | 2.0 | 1.0 | 1500 | $950 | $0.63 | 43d | 1 | 0.35mi |
| 2002 Jefferson St Unit 3 Anderson, IN | 1.0 | 2.0 | 725 | $600 | $0.83 | 43d | 1 | 0.44mi |
| 1726-1728 Walnut St Anderson, IN | 2.0 | 2.0 | 900 | $995 | $1.11 | 2d | 1 | 0.57mi |
| 1318 E 28th St Anderson, IN | 3.0 | 1.0 | 1280 | $1,300 | $1.02 | 12d | 1 | 0.59mi |
| 1232 E 28th St Anderson, IN | 2.0 | 2.0 | 795 | $950 | $1.19 | 43d | 1 | 0.59mi |
| 1411 Home Ave Anderson, IN | 3.0 | 1.0 | 810 | $1,295 | $1.60 | 23d | 1 | 0.63mi |
| 1045 Alhambra Dr Unit 6 Anderson, IN | 2.0 | 1.5 | 900 | $975 | $1.08 | 23d | 1 | 0.66mi |
| 1829 E 8th St Anderson, IN | 1.0–3.0 | 1.0 | 810 | $1,025 | $1.27 | 23d | 9 | 0.73mi |
| 1023 E 8th St Unit 3 Anderson, IN | 2.0 | 1.5 | 1200 | $1,175 | $0.98 | 7d | 1 | 0.77mi |
| 3009 E Lynn St Unit 1 Anderson, IN | 3.0 | 1.0 | 1000 | $875 | $0.88 | 20d | 1 | 0.80mi |
| 2111 Central Ave Anderson, IN | 3.0 | 1.0 | 1026 | $1,250 | $1.22 | 43d | 1 | 0.81mi |
| 1501 E 31st St Anderson, IN | 2.0 | 1.0 | 840 | $1,199 | $1.43 | 20d | 1 | 0.82mi |
| 219 E 13th St Anderson, IN | 3.0 | 1.0 | 882 | $1,000 | $1.13 | 4d | 1 | 0.86mi |
| 3006 Noble St Anderson, IN | 2.0 | 1.0 | 1064 | $995 | $0.94 | 7d | 1 | 0.90mi |
| 223 E 11th St Anderson, IN | 2.0 | 1.0 | 800 | $900 | $1.12 | 43d | 1 | 0.92mi |
| 919 E 6th St Apt 2 Anderson, IN | 1.0 | 1.0 | 700 | $625 | $0.89 | 23d | 1 | 0.93mi |
| 2505 E 10th St Anderson, IN | 1.0–2.0 | 1.0 | 850 | $949 | $1.12 | 43d | 2 | 0.95mi |
| 1317 Main St Anderson, IN | 2.0 | 1.0 | 750 | $800 | $1.07 | 43d | 1 | 0.96mi |
| 228 E 29th St Anderson, IN | 3.0 | 2.0 | 1440 | $1,295 | $0.90 | 4d | 1 | 0.99mi |
| 530 Alhambra Dr Anderson, IN | 1.0–2.0 | 1.0 | 879 | $1,100 | $1.25 | 43d | 1 | 0.99mi |
| 2625 Main St Anderson, IN | 2.0 | 1.0 | 988 | $895 | $0.91 | 23d | 1 | 0.99mi |
| 3000 Fletcher St Unit 3000 Anderson, IN | 2.0 | 1.0 | 800 | $650 | $0.81 | 43d | 1 | 1.02mi |
| 229 W 19th St Anderson, IN | 3.0 | 1.0 | 1200 | $1,000 | $0.83 | 43d | 1 | 1.14mi |
| 2324 Chase St Anderson, IN | 2.0 | 1.0 | 783 | $950 | $1.21 | 43d | 1 | 1.17mi |
| 706 University Blvd Anderson, IN | 2.0 | 1.0 | 1250 | $1,050 | $0.84 | 2d | 1 | 1.21mi |
| 120 W 10th St Anderson, IN | 1.0–3.0 | 1.0 | 1066 | $1,025 | $0.96 | 1d | 1 | 1.22mi |
| 602 Meridian St Apt C Anderson, IN | 2.0 | 1.0 | 800 | $900 | $1.12 | 43d | 1 | 1.26mi |
| 2627 Chase St Anderson, IN | 3.0 | 1.0 | 1050 | $850 | $0.81 | 17d | 1 | 1.27mi |
| 3021 Delaware St Anderson, IN | 2.0 | 1.0 | 1154 | $1,150 | $1.00 | 7d | 1 | 1.29mi |
| 2442 Morton St Anderson, IN | 2.0 | 1.0 | 862 | $1,125 | $1.31 | 23d | 1 | 1.32mi |
| 2233 Fairview St Anderson, IN | 3.0 | 1.5 | 1452 | $1,195 | $0.82 | 23d | 1 | 1.37mi |
| 2904 Lincoln St Anderson, IN | 2.0 | 1.0 | 864 | $900 | $1.04 | 43d | 1 | 1.38mi |
| 618 W 22nd St Anderson, IN | 3.0 | 1.0 | 900 | $1,250 | $1.39 | 43d | 1 | 1.39mi |
| 2301 Sheridan St Anderson, IN | 2.0 | 1.0 | 900 | $950 | $1.06 | 43d | 1 | 1.44mi |
| 2820 Fairview St Unit A Anderson, IN | 2.0 | 1.0 | 850 | $895 | $1.05 | 43d | 1 | 1.47mi |
Listing history 20 events
-
2026-06-19status $58,900 Pending 23 DOM
-
2026-06-18days on market $58,900 Active 23 DOM
-
2026-06-17remarks 478-char remark
-
2026-06-17price $58,900 Active 22 DOM
-
2026-06-17days on market $59,900 Active 22 DOM
-
2026-06-16days on market $59,900 Active 21 DOM
-
2026-06-15days on market $59,900 Active 20 DOM
-
2026-06-13days on market $59,900 Active 18 DOM
-
2026-06-09days on market $59,900 Active 14 DOM
-
2026-06-08days on market $59,900 Active 13 DOM
-
2026-06-07days on market $59,900 Active 12 DOM
-
2026-06-05days on market $59,900 Active 9 DOM
-
2026-06-03days on market $59,900 Active 8 DOM
-
2026-06-02pricedays on market $59,900 Active 7 DOM
-
2026-06-02price $60,500 Active 6 DOM
-
2026-06-01days on market $62,500 Active 6 DOM
-
2026-05-31days on market $62,500 Active 5 DOM
-
2026-05-26$62,500 Active
-
2008-09-29soldstatus $30,000 323-char remark
Show marketing remark (323 chars)
Nice 2 Bdrm 1 Bath brick ranch features Lg Living rm, formal dinning rm, eat-in kitchen. New vinyl floor in bathroom. Full unfinished basement plus 2 car att garage. New gas hot water, base board furnace. New electrical box & wiring. Newer roof. Ready to move in. Extra nice for the price. Great investment potential.
-
2008-07-09$32,900 323-char remark
Show marketing remark (323 chars)
Nice 2 Bdrm 1 Bath brick ranch features Lg Living rm, formal dinning rm, eat-in kitchen. New vinyl floor in bathroom. Full unfinished basement plus 2 car att garage. New gas hot water, base board furnace. New electrical box & wiring. Newer roof. Ready to move in. Extra nice for the price. Great investment potential.
ⓘ Source: listings_history table (triggers on properties + properties_extension) + one-shot
backfill from property_details.listing_events for pre-trigger history.
Climate risk First Street
- Flood 1/10 Low FEMA zone X (unshaded) · 0% chance over 30 yrs
- Wildfire 1/10 Low
- Heat 3/10 Moderate 7 d/yr ≥100°F today · 18 d/yr by 30 yrs out
- Wind 2/10 Low 0% chance of damaging wind over 30 yrs
- Air quality 3/10 Moderate 2 unhealthy d/yr today · 3 by 30 yrs out
Nearby sold comps map
Loading sold comps map…
Walkable amenities ~0.75 mi
Loading nearby amenities…
Taxation est. · year 1
- Rental income
- $11,720
- − Mortgage interest
- −$3,299
- − Property taxes
- −$884
- − Insurance
- −$294
- − Repairs & maintenance
- −$938
- − Management
- −$938
- − Depreciation
- −$1,713
- Taxable income
- $3,654
- Est. tax owed @ 24.0%
- −$877
- After-tax cash flow
- $3,498/yr
For passive investors: Depreciation is non-cash, so a rental often shows a tax loss while cash-flowing — sheltering income. Rental losses are passive: they offset passive income freely, and up to $25,000/yr can offset ordinary (W-2) income if you actively participate and your MAGI is under $100k (phasing out to $0 by $150k); unused losses carry forward. On sale, claimed depreciation is recaptured at up to 25%, and gains may owe capital-gains tax (a 1031 exchange can defer both). Figures are a year-1 estimate at your 24.0% rate — not tax advice; consult a CPA.
Schools (NCES district)
- District
- Anderson Community School Corporation
- NCES district ID
- 1800150
- Math proficiency
- 15% ▼ -14.00%
- Reading proficiency
- 23% ▼ -7.00%
- Median HH income
- $38,208
- Composite
- 15.93/100
- National rank
- #9250
- State rank
- #280 of 301 in IN
Livability — Anderson
- Score
- 60/100
- State rank
- #521
- US rank
- #18709
Category grades
Schools grade is shown separately in the Schools card above.
Census & demographics
- Census place
- Anderson, IN
- County
- Madison County · 69,445 people
- City population
- 57,762
- Metro
- Indianapolis-Carmel-Anderson, IN
- Population (ZIP)
- 17,834
- Household income
- $36,029
- Rent vs Own
- Severe rent burden
- 1193.0
Population outlook (Madison County) Hauer SSP2
- Today (2025)
- 125,800 people
- By 2030
- 122,640 · -2.5%
- By 2040
- 115,420 · -8.3%
- By 2050
- 108,148 · -14.0%
- By 2075
- 91,838 · -27.0%
- By 2100
- 75,670 · -39.8%
Race, ethnicity, and origin ACS 2023
- Neighborhood character
- Diverse neighborhood (Simpson 0.58)
- Race & ethnicity
- White 61% Black 18% Hispanic / Latino 13% Two or more races 11% Native American 1%
- Hispanic origin (detail)
- Mexican 10% Puerto Rican 1%
- Common ancestry
- Italian 2% Slovak 1% Iranian 1%
- Foreign-born
- 4% · Canada
- Languages at home
- 86% English-only · Spanish 12%
Political lean MEDSL · Madison
- 2024 margin
- Strong R (+26.9) · D 35.6% · R 62.5% · Other 1.9%
- 2008→2024 swing
- -33.5pp toward R · 2008: 6.5pp · 2024: -26.9pp
- All cycles
- 2024: R+26.9 2020: R+22.6 2016: R+25.7 2012: R+4.5 2008: D+6.5
Not yet ingested
- Civics
- —
Market trends
- HPI YoY
- ▼ -11.12%
- Current HPI
- 302.7437
- Rent YoY
- ▲ 7.88%
- Metro
- Indianapolis-Carmel-Anderson, IN
- State GDP YoY
- ▲ 2.90%
- F500 in state
- 18
Industry mix (Fortune 500 HQ in IN)
| Industry | F500 HQs | Revenue |
|---|---|---|
| Industrial Machinery | 2 | $37B |
|
||
| Healthcare | 1 | $177B |
|
||
| Pharmaceuticals | 1 | $45B |
|
||
| Metals / Steel | 1 | $18B |
|
||
| Agriculture | 1 | $17B |
|
||
| Packaging | 1 | $12B |
|
||
Price history
+90.0% since first listed3 events — show timeline
- 2026-05-26 Listed $62,500 MIBOR as Distributed by MLS Grid
- 2008-09-29 Sold (MLS) $30,000 MIBOR as Distributed by MLS Grid
- 2008-07-09 Listed $32,900 MIBOR as Distributed by MLS Grid
Cash-flow waterfall
monthlySold comps — $/sqft
last 12 mo · ≤1 miLoading sold comps…