7420 Tribble Gap Rd · Lula, GA
Flood risk 1/10 · Minimal
- FEMA flood zone
- X (unshaded)
- Chance of flooding over 30 yrs
- 0.0%
- Est. flood insurance / yr
- $507 – $1,088
Fire risk 4/10 · Minor
- Est. fire insurance / yr
- $963 – $1,789
Heat risk 4/10 · Minor
- Hot days now (above 101°F)
- 7 days/yr
- Hot days in 30 yrs
- 18 days/yr
Wind risk 2/10 · Minimal
- Chance of severe wind over 30 yrs
- 4.0%
Air-quality risk 4/10 · Minor
- Unhealthy air days now
- 3 days/yr
- Unhealthy air days in 30 yrs
- 6 days/yr
Risk factors via First Street. Map © Google.
Why this score? — see what drove the F grade
The composite is a weighted blend of 9 inputs, each scored 0–100. Each bar is that input's sub-score; the figure is the points it added to the 100-point composite (weight × sub-score).
- ARV discount +7.5/15.0
- Livability +3.4/5.0
- Schools +2.7/10.0
- Rent growth +2.5/5.0
- Condition / age +2.5/5.0
- Cash flow +0.0/30.0
- 1% rule +0.0/10.0
- DSCR +0.0/10.0
- Appreciation +0.0/10.0
$100,000
🖨 Deal sheet 📄 Offer letter ✓ Due diligence
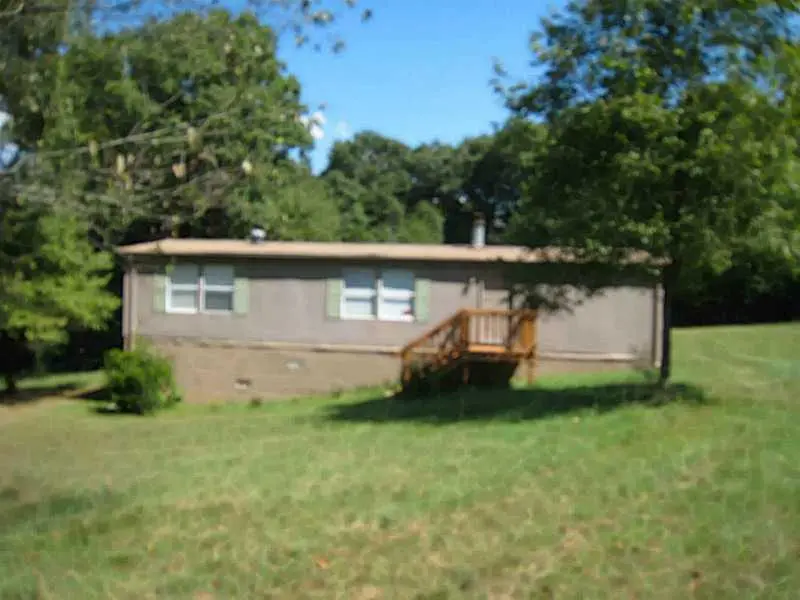
Listing remarks
Affordable opportunity with tons of potential! Tucked away on a quiet 1.19-acre lot, this 3-bedroom, 2-bath manufactured double-wide offers a rare chance to own acreage at a low price point. New subfloors have already been installed, and the bathrooms and kitchen feature tile flooring. The home does need flooring throughout and leveling work, making it ideal for investors, handymen, or buyers looking to build sweat equity. A spacious crawl space provides excellent storage, and the secluded setting offers privacy and room to enjoy country living. Great potential for a rental property, flip, or affordable primary residence.
Key facts
- 1.19-acre lot
- Spacious crawl space
- New subfloors
Tags
Neighborhood map
What this means for you Summary
Snapshot
- This is a 3-bed/2.0-bath other listed at $100k.
Deal economics
- At list price, monthly cash flow is $-587 ($-7k/yr) — negative.
- Rent doesn't cover operating costs at any purchase price — skip.
- Cap rate -0.7% vs local median 3.3% in Lula — below-typical yield; the buyer is paying a premium for something (appreciation thesis, condition, location) that the cap rate doesn't capture.
Location & tenants
- Location reads 68/100 on livability (#130 in GA) — a middle-class / working-renter tenant base. Strengths: cost of living A+, housing A+, crime A; Watch: schools F, amenities F, commute F.
- Hall County (rural): math 28% / reading 33% proficiency, ranked #81 of 174 in GA (top 47%) — families likely to look elsewhere, expect single-tenant / working-renter base with shorter leases.
- Market conditions: 45 active listings in the ZIP; 2,274 units permitted in Hall County in 2024 (620 in 5+ unit buildings).
Forward outlook
- Local home prices are declining (-3.0%/yr); year-one equity from $691 of loan paydown is wiped out by about $3k of value loss. Plan a longer hold.
- Hall County population projected at +30% by 2050 — long-run rental-demand tailwind backs the buy-and-hold thesis.
Negotiation context
- Only 9 days on market — expect competitive offers; lowballing is unlikely to land.
- 5 sale attempts since 12y ago; this cycle's ask has dropped $40k (29%) from the opening price — seller is motivated, your offer sets the floor, not the list.
- Current owner paid $53k; list at $100k implies a 89% gain — meaningful room to come down on a strong offer.
Questions for the listing agent
- What do current leases actually rent for vs. the listed asking? Can we see a recent rent roll and the last 12 months of T-12 income?
- Is there a deadline driving the sale (1031 exchange, divorce, estate, relocation)? That informs how much negotiation room exists.
- Schools are F-rated, which usually means shorter tenancies and higher turnover. Who's the typical renter profile here, and what's been the actual vacancy rate?
- The area grade is low — what's the realistic commute time and amenity access for the typical tenant pool here? Any planned neighborhood developments (good or bad) we should know about?
- What's the average days-on-market for RENTAL listings here right now (not sales)? A rising rental-DOM trend means longer vacancies and softer asking-rent achievability than the comps imply.
- What's the recent tenant-quality profile in this submarket — average credit score on applications, eviction rate, late-payment / NSF rate, and stable-employment percentage? A property-management company in the area should have these aggregated.
- How much new for-sale + rental construction is in the pipeline within 1–3 miles? Heavy new supply typically softens prices + rents 12–24 months out; constrained supply supports both.
Investment metrics
- 1% rule
- 0.00% ✗
- Cap rate
- -0.75%
- Cash-on-cash
- -25.14%
- DSCR
- -0.12
- GRM
- 0.0
CMA / ARV
- ARV (median comp)
- $215,739
- List price
- $100,000
- Delta
- -44.38%
- Verdict
- UNDERPRICED
- Comps
- 1 within 2.0 mi
Projected returns pro-forma
-3.0% appreciation · 3.0% rent growth · sell at horizon
- IRR
- -73.0%
- Equity multiple
- -0.92×
- Total profit
- $-53,626
- Equity at exit
- $14,910
- IRR
- —
- Equity multiple
- -2.40×
- Total profit
- $-95,062
- Equity at exit
- $8,646
Cash invested: $28,000 (down + closing). Projections, not guarantees.
Landlord ↔ Tenant lean methodology
- Overall (STATE)
- 90 Strongly Landlord-Friendly
- State Georgia
- 90 Strongly Landlord-Friendly · R+3
- County
- — inherits STATE
- City
- — inherits STATE
ZIP-level market 30510
- Home prices YoY
- -5.0%
- Active inventory
- 45
Monthly cashflow live
- Estimated rent
- $0 none
- Mortgage (P&I)
- −$524
- Tax from tax record
- −$20 /mo · $246/yr
- Insurance
- −$42
- HOA
- −$0
- Vacancy / Maint / Mgmt
- −$0
- Net cashflow
- $-587
Break-even live
UW: 25.0% down · 7.5% · 30yr · 1.5% tax · 5.0% vac · 8.0% maint · 8.0% mgmt
Financing live
Cash to close
- Down payment
- $25,000
- Closing costs
- $3,000
- Reserves months
- —
- Total cash needed
- —
Loan-product check · same deal, 3 products live
Conventional
25% down · 7.5% · 30yr
- Down + closing
- —
- Monthly P&I
- —
- Monthly cashflow
- —
- DSCR
- —
- Eligible?
- —
Personal DTI + credit; lowest rate.
DSCR
20% down · 8.5% · 30yr
- Down + closing
- —
- Monthly P&I
- —
- Monthly cashflow
- —
- DSCR
- —
- Eligible?
- —
No personal income docs; deal must DSCR.
Hard money
10% down · 12.0% · 12mo
- Down + closing
- —
- Monthly P&I
- —
- Monthly cashflow
- —
- DSCR
- —
- Eligible?
- —
Short-term bridge; refi at stabilization.
Listing history 27 events
-
2026-06-18days on market $100,000 Active 9 DOM
-
2026-06-17days on market $100,000 Active 8 DOM
-
2026-06-16days on market $100,000 Active 7 DOM
-
2026-06-15days on market $100,000 Active 6 DOM
-
2026-06-13days on market $100,000 Active 4 DOM
-
2026-06-10remarks 629-char remark
-
2026-06-10pricestatusdays on market $100,000 Active 1 DOM
-
2026-05-04historical
-
2026-05-04historical
-
2026-03-20price $120,000
-
2026-03-20price $120,000
-
2026-03-10price $130,000
-
2026-03-10price $130,000
-
2026-02-03$140,000 Active
-
2026-02-03$140,000 New
-
2016-01-13soldstatus $53,000
-
2015-03-03soldstatus $54,900
-
2015-02-19historical
-
2015-02-17soldstatus $54,900 Sold
-
2015-02-10soldstatus $54,900 Sold
-
2015-01-31historical Pending
-
2015-01-13status Under Contract
-
2015-01-02$54,900 Active
-
2014-12-30historical
-
2014-09-04$54,900 New
-
2014-09-04$54,900 Active
-
1998-09-30soldstatus $153,000
ⓘ Source: listings_history table (triggers on properties + properties_extension) + one-shot
backfill from property_details.listing_events for pre-trigger history.
Tax reassessment forecast GA · Resets to sale price
- Current annual tax
- $246 · $20/mo
- Projected year-2 tax
- $920 · $77/mo
- Expected delta
- +$674/yr (+$56/mo · 274.5%)
ⓘ Screening estimate from a state-policy table — verify with the county assessor before closing.
Climate risk First Street
- Flood 1/10 Low FEMA zone X (unshaded) · 0% chance over 30 yrs
- Wildfire 4/10 Moderate
- Heat 4/10 Moderate 7 d/yr ≥101°F today · 18 d/yr by 30 yrs out
- Wind 2/10 Low 4% chance of damaging wind over 30 yrs
- Air quality 4/10 Moderate 3 unhealthy d/yr today · 6 by 30 yrs out
Nearby sold comps map
Loading sold comps map…
Walkable amenities ~0.75 mi
Loading nearby amenities…
Taxation est. · year 1
- Rental income
- $0
- − Mortgage interest
- −$5,602
- − Property taxes
- −$246
- − Insurance
- −$500
- − Repairs & maintenance
- −$0
- − Management
- −$0
- − Depreciation
- −$2,909
- Taxable loss
- −$9,256
- Est. tax savings @ 24.0%
- +$2,222
- After-tax cash flow
- $-4,817/yr
For passive investors: Depreciation is non-cash, so a rental often shows a tax loss while cash-flowing — sheltering income. Rental losses are passive: they offset passive income freely, and up to $25,000/yr can offset ordinary (W-2) income if you actively participate and your MAGI is under $100k (phasing out to $0 by $150k); unused losses carry forward. On sale, claimed depreciation is recaptured at up to 25%, and gains may owe capital-gains tax (a 1031 exchange can defer both). Figures are a year-1 estimate at your 24.0% rate — not tax advice; consult a CPA.
Schools (NCES district)
- District
- Hall County
- NCES district ID
- 1302610
- Math proficiency
- 28% ▼ -12.00%
- Reading proficiency
- 33% ▼ -5.00%
- Median HH income
- $55,708
- Composite
- 27.15/100
- National rank
- #7029
- State rank
- #81 of 174 in GA
Livability — Lula
- Score
- 68/100
- State rank
- #130
- US rank
- #9112
Category grades
Schools grade is shown separately in the Schools card above.
Census & demographics
- City population
- 9,167
- Population (ZIP)
- 8,738
Population outlook (Hall County) Hauer SSP2
- Today (2025)
- 225,275 people
- By 2030
- 240,204 · +6.6%
- By 2040
- 268,440 · +19.2%
- By 2050
- 293,596 · +30.3%
- By 2075
- 350,293 · +55.5%
- By 2100
- 389,329 · +72.8%
Race, ethnicity, and origin ACS 2023
- Neighborhood character
- Predominantly White (71%)
- Race & ethnicity
- White 71% Hispanic / Latino 18% Black 7% Two or more races 5% Asian 2% Native American 2%
- Hispanic origin (detail)
- Mexican 15% Puerto Rican 1%
- Common ancestry
- Italian 1% Slovak 1%
- Foreign-born
- 8% · Canada
- Languages at home
- 83% English-only · Spanish 15% Other Asian/Pacific 1% Vietnamese 1%
Political lean MEDSL · Hall
- 2024 margin
- Solid R (+43.8) · D 27.8% · R 71.6%
- 2008→2024 swing
- +7.1pp toward D · 2008: -50.9pp · 2024: -43.8pp
- All cycles
- 2024: R+43.8 2020: R+43.2 2016: R+50.7 2012: R+56.4 2008: R+50.9
Not yet ingested
- Civics
- —
Market trends
- HPI YoY
- ▼ -16.08%
- Current HPI
- 307.9345
- Rent YoY
- —
- Metro
- —
- State GDP YoY
- ▲ 2.66%
- F500 in state
- 28
Industry mix (Fortune 500 HQ in GA)
| Industry | F500 HQs | Revenue |
|---|---|---|
| Paper / Packaging | 2 | $29B |
|
||
| Retail | 1 | $160B |
|
||
| Transportation / Logistics | 1 | $91B |
|
||
| Airlines | 1 | $62B |
|
||
| Consumer Goods | 1 | $47B |
|
||
| Utilities | 1 | $25B |
|
||
Price history
-21.6% since first listed20 events — show timeline
- 2026-05-04 Listing Removed — GAMLS
- 2026-05-04 Listing Removed — FMLS
- 2026-03-20 Price Changed $120,000 GAMLS
- 2026-03-20 Price Changed $120,000 FMLS
- 2026-03-10 Price Changed $130,000 FMLS
- 2026-03-10 Price Changed $130,000 GAMLS
- 2026-02-03 Listed $140,000 GAMLS
- 2026-02-03 Listed $140,000 FMLS
- 2016-01-13 Sold (Public Records) $53,000 Public Records
- 2015-03-03 Sold (Public Records) $54,900 Public Records
- 2015-02-19 Listing Removed — FMLS
- 2015-02-17 Sold (MLS) $54,900 FMLS
- 2015-02-10 Sold (MLS) $54,900 GAMLS
- 2015-01-31 Contingent — FMLS
- 2015-01-13 Pending — GAMLS
- 2015-01-02 Listed $54,900 FMLS
- 2014-12-30 Listing Removed — FMLS
- 2014-09-04 Listed $54,900 GAMLS
- 2014-09-04 Listed $54,900 FMLS
- 1998-09-30 Sold (Public Records) $153,000 Public Records
Property tax history
+9.8%/yrLatest (2025): $246 · -32.1% YoY. Source: county tax records.
Cash-flow waterfall
monthlySold comps — $/sqft
last 12 mo · ≤1 miLoading sold comps…