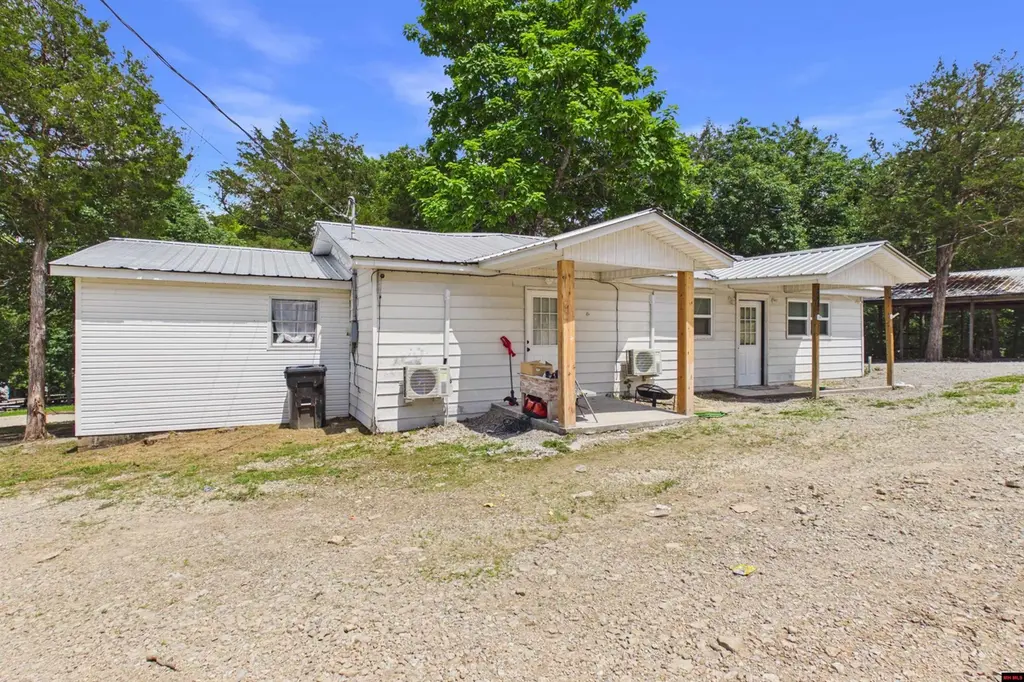
243 Boland Dr · Henderson, AR
Flood risk 1/10 · Minimal
- FEMA flood zone
- X (unshaded)
- Chance of flooding over 30 yrs
- 0.0%
- Est. flood insurance / yr
- $507 – $1,088
Fire risk 3/10 · Minor
- Est. fire insurance / yr
- $1,499 – $2,785
Heat risk 4/10 · Minor
- Hot days now (above 106°F)
- 7 days/yr
- Hot days in 30 yrs
- 20 days/yr
Wind risk 2/10 · Minimal
- Chance of severe wind over 30 yrs
- 1.0%
Air-quality risk 1/10 · Minimal
- Unhealthy air days now
- 0 days/yr
- Unhealthy air days in 30 yrs
- 0 days/yr
Risk factors via First Street. Map © Google.
Why this score? — see what drove the D grade
The composite is a weighted blend of 9 inputs, each scored 0–100. Each bar is that input's sub-score; the figure is the points it added to the 100-point composite (weight × sub-score).
- Appreciation +9.8/10.0
- Cash flow +8.2/30.0
- ARV discount +7.5/15.0
- Schools +3.7/10.0
- Rent growth +2.5/5.0
- Livability +2.5/5.0
- Condition / age +2.5/5.0
- DSCR +2.2/10.0
- 1% rule +1.4/10.0
$189,900
🖨 Deal sheet 📄 Offer letter ✓ Due diligence
Listing remarks MLS
Two units! Located minutes from Lake Norfork Access. This deal is almost to sweet to be true! Each units has its own bedroom, bathroom, living room and kitchen. One unit has some updates. Call today to schedule a look!
Key facts
- Remodeled duplex
- Updated electrical
- Strong rental income
Tags
Property features AI
Exterior
- Home design: Single family residence; Residential property; Located in Norfork Lk Est subdivision
- Construction: Metal siding; Built on a 0.42-acre lot
- Exterior features: Metal roof
Interior
- Kitchen: Electric oven; Electric range; Refrigerator; Microwave
- Bathrooms: 2 full bathrooms; 1 half bathroom
- Heating & cooling: Electric heating; Electric cooling
- Interior features: Electric oven and electric range; Refrigerator; Microwave; No basement
Neighborhood map
What this means for you Summary
Snapshot
- This is a 4-bed/1.0-bath manufactured listed at $190k.
Deal economics
- At list price, monthly cash flow is $-177 ($-2k/yr) — negative.
- To cash-flow at today's rent, offer at most $159k (16.5% below list).
- To meet the 1% rule (rent ≥ 1% of price), the offer needs to be $122k (36.0% below list).
- Recommended offer: $122k (36.0% below list) — sets the bar for 1% rule.
- Cap rate 5.2% vs local median 1.9% in Henderson — top-decile yield for the area; either an underpriced asset or a hidden risk that comps aren't pricing in. Stress-test before assuming the spread holds.
Location & tenants
- Location reads: area grade D — affects rentability + tenant quality, not the cash-flow math above.
- Mountain Home School District (town): math 45% / reading 45% proficiency, ranked #40 of 238 in AR (top 17%) — families likely to look elsewhere, expect single-tenant / working-renter base with shorter leases.
- Market conditions: 31 active listings in the ZIP; 47 units permitted in Baxter County in 2024 (0 in 5+ unit buildings).
Forward outlook
- In year one you build about $19k of equity ($1k loan paydown + $18k appreciation (9.5% local appreciation)).
- Baxter County population projected to shrink 9% by 2050 — rents likely to lag national; underwrite the cash flow, not the appreciation.
- By year 2, paydown + projected appreciation supports a ~$31k cash-out refi (75% LTV) — recoverable capital for the next deal without selling this one.
Negotiation context
- It's been on market 16 days — a 2% lower offer ($187k) is reasonable based on typical stale-listing flexibility.
- 11 sale attempts since 5y ago with the ask held roughly flat each time — persistent listings suggest the price (not the market) is what's stuck; bring a comps-based counter.
- Current owner paid $68k; list at $190k implies a 181% gain — meaningful room to come down on a strong offer.
Questions for the listing agent
- What do current leases actually rent for vs. the listed asking? Can we see a recent rent roll and the last 12 months of T-12 income?
- Is there a deadline driving the sale (1031 exchange, divorce, estate, relocation)? That informs how much negotiation room exists.
- The area grade is low — what's the realistic commute time and amenity access for the typical tenant pool here? Any planned neighborhood developments (good or bad) we should know about?
- What's the average days-on-market for RENTAL listings here right now (not sales)? A rising rental-DOM trend means longer vacancies and softer asking-rent achievability than the comps imply.
- What's the recent tenant-quality profile in this submarket — average credit score on applications, eviction rate, late-payment / NSF rate, and stable-employment percentage? A property-management company in the area should have these aggregated.
- How much new for-sale + rental construction is in the pipeline within 1–3 miles? Heavy new supply typically softens prices + rents 12–24 months out; constrained supply supports both.
Investment metrics
- 1% rule
- 0.64% ✗
- Cap rate
- 5.18%
- Cash-on-cash
- -3.99%
- DSCR
- 0.82
- GRM
- 13.0
CMA / ARV
No comps found within radius.
Projected returns pro-forma
9.54% appreciation · 3.0% rent growth · sell at horizon
- IRR
- 20.4%
- Equity multiple
- 2.62×
- Total profit
- $86,130
- Equity at exit
- $164,760
- IRR
- 18.6%
- Equity multiple
- 5.91×
- Total profit
- $260,880
- Equity at exit
- $348,797
Cash invested: $53,172 (down + closing). Projections, not guarantees.
Landlord ↔ Tenant lean methodology
- Overall (STATE)
- 92 Strongly Landlord-Friendly
- State Arkansas
- 92 Strongly Landlord-Friendly · R+14
- County
- — inherits STATE
- City
- — inherits STATE
ZIP-level market 72544
- Home prices YoY
- 3.7%
- Active inventory
- 31
- Price-to-rent
- 13.0×
Monthly cashflow live
- Estimated rent
- $1,216 medium interval (Pro) →
- Mortgage (P&I)
- −$996
- Tax from tax record
- −$62 /mo · $749/yr
- Insurance
- −$79
- HOA
- −$0
- Vacancy / Maint / Mgmt
- −$255
- Net cashflow
- $-177
Break-even live
UW: 25.0% down · 7.5% · 30yr · 1.5% tax · 5.0% vac · 8.0% maint · 8.0% mgmt
Financing live
Cash to close
- Down payment
- $47,475
- Closing costs
- $5,697
- Reserves months
- —
- Total cash needed
- —
Loan-product check · same deal, 3 products live
Conventional
25% down · 7.5% · 30yr
- Down + closing
- —
- Monthly P&I
- —
- Monthly cashflow
- —
- DSCR
- —
- Eligible?
- —
Personal DTI + credit; lowest rate.
DSCR
20% down · 8.5% · 30yr
- Down + closing
- —
- Monthly P&I
- —
- Monthly cashflow
- —
- DSCR
- —
- Eligible?
- —
No personal income docs; deal must DSCR.
Hard money
10% down · 12.0% · 12mo
- Down + closing
- —
- Monthly P&I
- —
- Monthly cashflow
- —
- DSCR
- —
- Eligible?
- —
Short-term bridge; refi at stabilization.
Listing history 12 events
-
2026-06-19days on market $189,900 Active 16 DOM
-
2026-06-18days on market $189,900 Active 15 DOM
-
2026-06-17days on market $189,900 Active 14 DOM
-
2026-06-16days on market $189,900 Active 13 DOM
-
2026-06-15days on market $189,900 Active 12 DOM
-
2026-06-14days on market $189,900 Active 10 DOM
-
2026-06-12days on market $189,900 Active 9 DOM
-
2026-06-09days on market $189,900 Active 6 DOM
-
2026-06-08days on market $189,900 Active 5 DOM
-
2026-06-07days on market $189,900 Active 4 DOM
-
2026-06-05remarks 607-char remark
-
2026-06-05$189,900 Active 1 DOM
ⓘ Source: listings_history table (triggers on properties + properties_extension) + one-shot
backfill from property_details.listing_events for pre-trigger history.
Tax reassessment forecast AR · Resets to sale price
- Current annual tax
- $749 · $62/mo
- Projected year-2 tax
- $1,215 · $101/mo
- Expected delta
- +$467/yr (+$39/mo · 62.3%)
ⓘ Screening estimate from a state-policy table — verify with the county assessor before closing.
Climate risk First Street
- Flood 1/10 Low FEMA zone X (unshaded) · 0% chance over 30 yrs
- Wildfire 3/10 Moderate
- Heat 4/10 Moderate 7 d/yr ≥106°F today · 20 d/yr by 30 yrs out
- Wind 2/10 Low 100% chance of damaging wind over 30 yrs
- Air quality 1/10 Low 0 unhealthy d/yr today · 0 by 30 yrs out
Nearby sold comps map
Loading sold comps map…
Walkable amenities ~0.75 mi
Loading nearby amenities…
Taxation est. · year 1
- Rental income
- $14,589
- − Mortgage interest
- −$10,637
- − Property taxes
- −$749
- − Insurance
- −$950
- − Repairs & maintenance
- −$1,167
- − Management
- −$1,167
- − Depreciation
- −$5,524
- Taxable loss
- −$5,605
- Est. tax savings @ 24.0%
- +$1,345
- After-tax cash flow
- $-778/yr
For passive investors: Depreciation is non-cash, so a rental often shows a tax loss while cash-flowing — sheltering income. Rental losses are passive: they offset passive income freely, and up to $25,000/yr can offset ordinary (W-2) income if you actively participate and your MAGI is under $100k (phasing out to $0 by $150k); unused losses carry forward. On sale, claimed depreciation is recaptured at up to 25%, and gains may owe capital-gains tax (a 1031 exchange can defer both). Figures are a year-1 estimate at your 24.0% rate — not tax advice; consult a CPA.
Schools (NCES district)
- District
- Mountain Home School District
- NCES district ID
- 0500043
- Math proficiency
- 45% ▼ -8.00%
- Reading proficiency
- 45% ▼ -4.00%
- Median HH income
- $36,966
- Composite
- 37.4/100
- National rank
- #4424
- State rank
- #40 of 238 in AR
Livability — Henderson
No livability data for this city. (Only ~50 U.S. cities are tracked.)
Census & demographics
- Census place
- Henderson, AR
- Population (ZIP)
- 965
Population outlook (Baxter County) Hauer SSP2
- Today (2025)
- 39,886 people
- By 2030
- 39,226 · -1.7%
- By 2040
- 37,810 · -5.2%
- By 2050
- 36,287 · -9.0%
- By 2075
- 32,965 · -17.4%
- By 2100
- 28,002 · -29.8%
Race, ethnicity, and origin ACS 2023
- Neighborhood character
- Predominantly White (98%)
- Race & ethnicity
- White 98% Two or more races 2% Hispanic / Latino 1%
- Common ancestry
- Romanian 3% Lithuanian 2% Iranian 1%
- Languages at home
- 99% English-only · German/W. Germanic 1%
Political lean MEDSL · Baxter
- 2024 margin
- Solid R (+56.9) · D 20.7% · R 77.6% · Other 1.7%
- 2008→2024 swing
- -25.3pp toward R · 2008: -31.6pp · 2024: -56.9pp
- All cycles
- 2024: R+56.9 2020: R+53.3 2016: R+53.6 2012: R+44.0 2008: R+31.6
Not yet ingested
- Civics
- —
Market trends
- HPI YoY
- ▲ 9.54%
- Current HPI
- 269.1532
- Rent YoY
- —
- Metro
- —
- State GDP YoY
- ▲ 3.80%
- F500 in state
- 10
Industry mix (Fortune 500 HQ in AR)
| Industry | F500 HQs | Revenue |
|---|---|---|
| Retail | 1 | $681B |
|
||
| Food / Agriculture | 1 | $53B |
|
||
| Retail / Energy | 1 | $22B |
|
||
| Transportation / Logistics | 1 | $12B |
|
||
| Energy | 1 | $4B |
|
||
Price history
+804.3% since first listed25 events — show timeline
- 2026-06-03 Listed $189,900 MHMLS
- 2026-03-12 Sold (MLS) $67,500 CARMLS
- 2026-03-12 Sold (MLS) $67,500 NWARMLS
- 2026-03-12 Sold (MLS) $67,500 MHMLS
- 2026-02-06 Pending — NWARMLS
- 2026-02-06 Pending — CARMLS
- 2026-02-06 Pending — CARMLS
- 2026-02-06 Listing Removed — CARMLS
- 2026-01-30 Listed $45,000 MHMLS
- 2026-01-30 Listed $45,000 CARMLS
- 2026-01-30 Listed $45,000 CARMLS
- 2026-01-30 Listed $45,000 NWARMLS
- 2026-01-30 Listed $45,000 MHMLS
- 2025-03-28 Contingent — MHMLS
- 2025-03-28 Contingent — MHMLS
- 2025-03-21 Relisted — MHMLS
- 2025-03-21 Relisted — MHMLS
- 2025-03-07 Contingent — MHMLS
- 2025-03-07 Contingent — MHMLS
- 2025-02-11 Listed $145,000 MHMLS
- 2025-02-11 Listed $145,000 MHMLS
- 2021-11-19 Sold (Public Records) $110,000 Public Records
- 2021-08-13 Sold (MLS) $110,000 NEABOR MLS
- 2021-02-09 Listed $114,900 NEABOR MLS
- 1995-02-09 Sold (Public Records) $21,000 Public Records
Property tax history
+18.9%/yrLatest (2025): $749 · +813.2% YoY. Source: county tax records.
Cash-flow waterfall
monthlySold comps — $/sqft
last 12 mo · ≤1 miLoading sold comps…